Toronto Market Watch East
•
0 likes•314 views

Here is the Market Watch from The Toront Real Estate Board for the East Region.

Recommended
Recommended
More Related Content
What's hot
What's hot (13)
Viewers also liked
Viewers also liked (13)
Similar to Toronto Market Watch East
Similar to Toronto Market Watch East (20)
More from Richard Silver, Certified International REALTOR®
More from Richard Silver, Certified International REALTOR® (20)
Recently uploaded
Recently uploaded (20)
Toronto Market Watch East
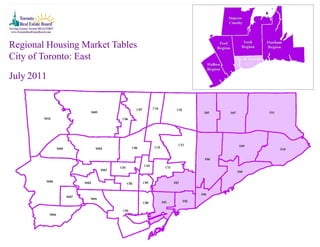
- 1. Regional Housing Market Tables City of Toronto: East July 2011
- 2. Toronto Real Estate Board Regional Housing Market Tables City of Toronto, Toronto East JULY 2011 1 1 1 1 2 3 4 5 Sales Dollar Volume Average Price Median Price New Listings Active Listings Avg. SP/LP Avg. DOM All Home Types 885 $345,467,383 $390,359 $370,000 1,409 1,658 100% 23 Detached 354 $178,712,938 $504,839 $462,250 555 529 100% 17 Semi-Detached 126 $58,262,722 $462,403 $438,250 184 159 101% 15 Condominium Townhouse 85 $23,939,978 $281,647 $293,400 124 155 99% 30 Condominium Apartment 257 $59,508,079 $231,549 $219,000 448 718 97% 33 Link 15 $6,147,288 $409,819 $448,000 33 25 100% 16 Att/Row/Townhouse 47 $18,632,678 $396,440 $390,000 62 58 100% 20 Co-Operative Apartment 0 $0 - - 3 11 - - Detached Condominium 1 $263,700 $263,700 $263,700 0 2 95% 26 Co-Ownership Apartment 0 $0 - - 0 1 - - 6 City of Toronto, Toronto East YEAR-TO-DATE 2011 Sales1 Dollar Volume1 Average Price1 Median Price1 New Listings2 Avg. SP/LP 4 Avg. DOM5 All Home Types 6,310 $2,539,176,571 $402,405 $375,000 10,357 100% 21 Detached 2,746 $1,381,717,801 $503,175 $442,000 4,270 101% 16 Semi-Detached 964 $460,321,377 $477,512 $442,250 1,450 103% 13 Condominium Townhouse 562 $157,857,741 $280,886 $280,000 932 99% 26 Condominium Apartment 1,620 $370,218,389 $228,530 $213,252 3,024 98% 32 Link 82 $33,735,670 $411,411 $414,400 132 102% 15 Att/Row/Townhouse 314 $130,706,793 $416,264 $385,000 496 101% 18 Co-Operative Apartment 16 $2,692,200 $168,263 $144,750 41 96% 28 Detached Condominium 4 $1,353,700 $338,425 $287,500 10 98% 23 Co-Ownership Apartment 2 $572,900 $286,450 $286,450 2 104% 103 NOTES 1 Sales, dollar volume, average sale prices and median sale prices are based on firm transactions entered into the TorontoMLS® system between the first and last day of the month/period being reported. 2 New listings entered into the TorontoMLS® system between the first and last day of the month/period being reported. 3 Active listings at the end of the last day of the month/period being reported. 4 Ratio of the average selling price to the average listing price for firm transactions entered into the TorontoMLS® system between the first and last day of the month/period being reported. 5 Average number of days on the market for firm transactions entered into the TorontoMLS® system between the first and last day of the month/period being reported. 6 Past monthly and year-to-date figures are revised on a monthly basis. Toronto East, July 2011 2
- 3. Toronto Real Estate Board Regional Housing Market Tables City of Toronto, Toronto E01 JULY 2011 1 1 1 1 2 3 4 5 Sales Dollar Volume Average Price Median Price New Listings Active Listings Avg. SP/LP Avg. DOM All Home Types 67 $34,108,864 $509,088 $491,000 109 120 102% 14 Detached 16 $10,192,777 $637,049 $619,500 21 33 100% 12 Semi-Detached 29 $14,321,600 $493,848 $477,500 46 40 103% 15 Condominium Townhouse 6 $2,193,500 $365,583 $349,250 11 9 100% 17 Condominium Apartment 8 $3,620,300 $452,538 $409,950 22 31 101% 15 Link 0 - - - 0 0 - - Att/Row/Townhouse 8 $3,780,687 $472,586 $529,500 9 7 107% 12 Co-Operative Apartment 0 - - - 0 0 - - Detached Condominium 0 - - - 0 0 - - Co-Ownership Apartment 0 - - - 0 0 - - 6 City of Toronto, Toronto E01 YEAR-TO-DATE 2011 Sales1 Dollar Volume1 Average Price1 Median Price1 New Listings2 Avg. SP/LP 4 Avg. DOM5 All Home Types 574 $313,308,217 $545,833 $521,750 934 104% 14 Detached 137 $90,167,151 $658,154 $625,000 229 104% 11 Semi-Detached 274 $150,905,983 $550,752 $527,500 413 104% 12 Condominium Townhouse 32 $11,918,393 $372,450 $347,500 54 100% 25 Condominium Apartment 63 $26,587,600 $422,025 $423,000 137 100% 19 Link 0 - - - 0 - - Att/Row/Townhouse 67 $33,214,090 $495,733 $516,000 100 104% 14 Co-Operative Apartment 0 - - - 0 - - Detached Condominium 1 $515,000 $515,000 $515,000 1 99% 14 Co-Ownership Apartment 0 - - - 0 - - NOTES 1 Sales, dollar volume, average sale prices and median sale prices are based on firm transactions entered into the TorontoMLS® system between the first and last day of the month/period being reported. 2 New listings entered into the TorontoMLS® system between the first and last day of the month/period being reported. 3 Active listings at the end of the last day of the month/period being reported. 4 Ratio of the average selling price to the average listing price for firm transactions entered into the TorontoMLS® system between the first and last day of the month/period being reported. 5 Average number of days on the market for firm transactions entered into the TorontoMLS® system between the first and last day of the month/period being reported. 6 Past monthly and year-to-date figures are revised on a monthly basis. Toronto East, July 2011 3
- 4. Toronto Real Estate Board Regional Housing Market Tables City of Toronto, Toronto E02 JULY 2011 1 1 1 1 2 3 4 5 Sales Dollar Volume Average Price Median Price New Listings Active Listings Avg. SP/LP Avg. DOM All Home Types 71 $42,896,321 $604,174 $545,000 100 84 100% 15 Detached 22 $17,451,600 $793,255 $747,250 38 30 100% 12 Semi-Detached 32 $17,175,421 $536,732 $517,500 38 25 102% 14 Condominium Townhouse 3 $1,292,000 $430,667 $430,000 3 5 98% 14 Condominium Apartment 10 $4,409,300 $440,930 $420,750 16 16 99% 27 Link 0 - - - 0 0 - - Att/Row/Townhouse 4 $2,568,000 $642,000 $645,000 5 4 99% 10 Co-Operative Apartment 0 - - - 0 3 - - Detached Condominium 0 - - - 0 0 - - Co-Ownership Apartment 0 - - - 0 1 - - 6 City of Toronto, Toronto E02 YEAR-TO-DATE 2011 Sales1 Dollar Volume1 Average Price1 Median Price1 New Listings2 Avg. SP/LP 4 Avg. DOM5 All Home Types 558 $353,413,779 $633,358 $545,000 901 101% 14 Detached 210 $172,838,541 $823,041 $740,000 335 101% 12 Semi-Detached 225 $120,985,338 $537,713 $500,000 339 102% 12 Condominium Townhouse 24 $12,351,100 $514,629 $485,000 44 98% 21 Condominium Apartment 53 $23,127,900 $436,375 $405,000 97 99% 20 Link 0 - - - 0 - - Att/Row/Townhouse 42 $22,841,400 $543,843 $500,800 69 101% 15 Co-Operative Apartment 3 $888,000 $296,000 $285,000 14 95% 13 Detached Condominium 0 - - - 1 - - Co-Ownership Apartment 1 $381,500 $381,500 $381,500 2 106% 8 NOTES 1 Sales, dollar volume, average sale prices and median sale prices are based on firm transactions entered into the TorontoMLS® system between the first and last day of the month/period being reported. 2 New listings entered into the TorontoMLS® system between the first and last day of the month/period being reported. 3 Active listings at the end of the last day of the month/period being reported. 4 Ratio of the average selling price to the average listing price for firm transactions entered into the TorontoMLS® system between the first and last day of the month/period being reported. 5 Average number of days on the market for firm transactions entered into the TorontoMLS® system between the first and last day of the month/period being reported. 6 Past monthly and year-to-date figures are revised on a monthly basis. Toronto East, July 2011 4
- 5. Toronto Real Estate Board Regional Housing Market Tables City of Toronto, Toronto E03 JULY 2011 1 1 1 1 2 3 4 5 Sales Dollar Volume Average Price Median Price New Listings Active Listings Avg. SP/LP Avg. DOM All Home Types 91 $39,179,172 $430,540 $430,000 120 150 100% 21 Detached 46 $23,302,471 $506,575 $477,500 67 78 100% 19 Semi-Detached 22 $10,886,301 $494,832 $469,750 28 24 101% 13 Condominium Townhouse 0 - - - 0 1 - - Condominium Apartment 20 $3,759,400 $187,970 $157,750 19 40 97% 33 Link 0 - - - 0 0 - - Att/Row/Townhouse 3 $1,231,000 $410,333 $425,000 6 7 97% 28 Co-Operative Apartment 0 - - - 0 0 - - Detached Condominium 0 - - - 0 0 - - Co-Ownership Apartment 0 - - - 0 0 - - 6 City of Toronto, Toronto E03 YEAR-TO-DATE 2011 Sales1 Dollar Volume1 Average Price1 Median Price1 New Listings2 Avg. SP/LP 4 Avg. DOM5 All Home Types 772 $342,403,483 $443,528 $431,000 1,246 102% 19 Detached 417 $217,103,658 $520,632 $475,000 681 102% 15 Semi-Detached 165 $81,501,874 $493,951 $481,000 250 103% 13 Condominium Townhouse 10 $3,108,800 $310,880 $294,500 11 98% 33 Condominium Apartment 168 $35,582,551 $211,801 $181,500 274 97% 32 Link 0 - - - 0 - - Att/Row/Townhouse 11 $4,915,200 $446,836 $385,000 30 101% 19 Co-Operative Apartment 0 - - - 0 - - Detached Condominium 0 - - - 0 - - Co-Ownership Apartment 1 $191,400 $191,400 $191,400 0 101% 198 NOTES 1 Sales, dollar volume, average sale prices and median sale prices are based on firm transactions entered into the TorontoMLS® system between the first and last day of the month/period being reported. 2 New listings entered into the TorontoMLS® system between the first and last day of the month/period being reported. 3 Active listings at the end of the last day of the month/period being reported. 4 Ratio of the average selling price to the average listing price for firm transactions entered into the TorontoMLS® system between the first and last day of the month/period being reported. 5 Average number of days on the market for firm transactions entered into the TorontoMLS® system between the first and last day of the month/period being reported. 6 Past monthly and year-to-date figures are revised on a monthly basis. Toronto East, July 2011 5
- 6. Toronto Real Estate Board Regional Housing Market Tables City of Toronto, Toronto E04 JULY 2011 1 1 1 1 2 3 4 5 Sales Dollar Volume Average Price Median Price New Listings Active Listings Avg. SP/LP Avg. DOM All Home Types 97 $30,877,765 $318,327 $325,000 169 199 100% 27 Detached 44 $18,004,100 $409,184 $406,500 86 71 101% 16 Semi-Detached 7 $2,396,500 $342,357 $329,000 14 16 100% 11 Condominium Townhouse 13 $3,672,290 $282,484 $280,000 19 24 98% 38 Condominium Apartment 32 $6,414,875 $200,465 $203,500 46 82 97% 43 Link 0 - - - 0 0 - - Att/Row/Townhouse 1 $390,000 $390,000 $390,000 4 4 98% 11 Co-Operative Apartment 0 - - - 0 2 - - Detached Condominium 0 - - - 0 0 - - Co-Ownership Apartment 0 - - - 0 0 - - 6 City of Toronto, Toronto E04 YEAR-TO-DATE 2011 Sales1 Dollar Volume1 Average Price1 Median Price1 New Listings2 Avg. SP/LP 4 Avg. DOM5 All Home Types 599 $192,080,562 $320,669 $340,000 1,013 100% 21 Detached 301 $119,407,119 $396,701 $390,000 453 100% 14 Semi-Detached 38 $12,356,800 $325,179 $313,750 72 99% 12 Condominium Townhouse 69 $20,441,630 $296,256 $304,990 147 99% 22 Condominium Apartment 168 $32,163,725 $191,451 $193,500 307 97% 33 Link 0 - - - 0 - - Att/Row/Townhouse 19 $7,122,288 $374,857 $389,000 27 100% 46 Co-Operative Apartment 4 $589,000 $147,250 $117,000 7 95% 37 Detached Condominium 0 - - - 0 - - Co-Ownership Apartment 0 - - - 0 - - NOTES 1 Sales, dollar volume, average sale prices and median sale prices are based on firm transactions entered into the TorontoMLS® system between the first and last day of the month/period being reported. 2 New listings entered into the TorontoMLS® system between the first and last day of the month/period being reported. 3 Active listings at the end of the last day of the month/period being reported. 4 Ratio of the average selling price to the average listing price for firm transactions entered into the TorontoMLS® system between the first and last day of the month/period being reported. 5 Average number of days on the market for firm transactions entered into the TorontoMLS® system between the first and last day of the month/period being reported. 6 Past monthly and year-to-date figures are revised on a monthly basis. Toronto East, July 2011 6
- 7. Toronto Real Estate Board Regional Housing Market Tables City of Toronto, Toronto E05 JULY 2011 1 1 1 1 2 3 4 5 Sales Dollar Volume Average Price Median Price New Listings Active Listings Avg. SP/LP Avg. DOM All Home Types 115 $43,947,487 $382,152 $339,000 147 127 101% 18 Detached 33 $19,642,199 $595,218 $619,000 41 28 104% 11 Semi-Detached 9 $3,817,500 $424,167 $436,500 13 5 99% 5 Condominium Townhouse 22 $6,305,800 $286,627 $292,000 27 21 100% 20 Condominium Apartment 43 $10,608,188 $246,702 $236,900 50 64 98% 27 Link 6 $2,779,800 $463,300 $464,000 7 3 102% 12 Att/Row/Townhouse 2 $794,000 $397,000 $397,000 7 4 99% 16 Co-Operative Apartment 0 - - - 2 2 - - Detached Condominium 0 - - - 0 0 - - Co-Ownership Apartment 0 - - - 0 0 - - 6 City of Toronto, Toronto E05 YEAR-TO-DATE 2011 Sales1 Dollar Volume1 Average Price1 Median Price1 New Listings2 Avg. SP/LP 4 Avg. DOM5 All Home Types 681 $246,778,973 $362,377 $321,000 975 101% 18 Detached 186 $102,261,489 $549,793 $547,000 279 103% 11 Semi-Detached 49 $19,672,588 $401,481 $391,500 63 101% 7 Condominium Townhouse 148 $42,711,452 $288,591 $286,400 197 101% 16 Condominium Apartment 249 $61,170,026 $245,663 $235,500 370 98% 26 Link 31 $14,052,618 $453,310 $458,000 39 102% 16 Att/Row/Townhouse 18 $6,910,800 $383,933 $381,750 25 104% 8 Co-Operative Apartment 0 - - - 2 - - Detached Condominium 0 - - - 0 - - Co-Ownership Apartment 0 - - - 0 - - NOTES 1 Sales, dollar volume, average sale prices and median sale prices are based on firm transactions entered into the TorontoMLS® system between the first and last day of the month/period being reported. 2 New listings entered into the TorontoMLS® system between the first and last day of the month/period being reported. 3 Active listings at the end of the last day of the month/period being reported. 4 Ratio of the average selling price to the average listing price for firm transactions entered into the TorontoMLS® system between the first and last day of the month/period being reported. 5 Average number of days on the market for firm transactions entered into the TorontoMLS® system between the first and last day of the month/period being reported. 6 Past monthly and year-to-date figures are revised on a monthly basis. Toronto East, July 2011 7
- 8. Toronto Real Estate Board Regional Housing Market Tables City of Toronto, Toronto E06 JULY 2011 1 1 1 1 2 3 4 5 Sales Dollar Volume Average Price Median Price New Listings Active Listings Avg. SP/LP Avg. DOM All Home Types 38 $16,946,200 $445,953 $412,500 39 60 99% 20 Detached 28 $13,104,900 $468,032 $422,500 31 36 99% 18 Semi-Detached 4 $1,598,500 $399,625 $379,500 3 8 99% 17 Condominium Townhouse 0 - - - 0 1 - - Condominium Apartment 4 $1,336,900 $334,225 $357,450 4 7 98% 24 Link 0 - - - 0 0 - - Att/Row/Townhouse 2 $905,900 $452,950 $452,950 1 7 98% 50 Co-Operative Apartment 0 - - - 0 1 - - Detached Condominium 0 - - - 0 0 - - Co-Ownership Apartment 0 - - - 0 0 - - 6 City of Toronto, Toronto E06 YEAR-TO-DATE 2011 Sales1 Dollar Volume1 Average Price1 Median Price1 New Listings2 Avg. SP/LP 4 Avg. DOM5 All Home Types 372 $168,573,555 $453,155 $402,250 600 99% 21 Detached 275 $132,368,764 $481,341 $420,000 434 99% 20 Semi-Detached 43 $15,803,801 $367,530 $335,000 73 99% 21 Condominium Townhouse 6 $1,952,990 $325,498 $317,500 8 101% 24 Condominium Apartment 26 $8,529,100 $328,042 $296,200 42 99% 28 Link 0 - - - 0 - - Att/Row/Townhouse 22 $9,918,900 $450,859 $444,750 42 99% 21 Co-Operative Apartment 0 - - - 1 - - Detached Condominium 0 - - - 0 - - Co-Ownership Apartment 0 - - - 0 - - NOTES 1 Sales, dollar volume, average sale prices and median sale prices are based on firm transactions entered into the TorontoMLS® system between the first and last day of the month/period being reported. 2 New listings entered into the TorontoMLS® system between the first and last day of the month/period being reported. 3 Active listings at the end of the last day of the month/period being reported. 4 Ratio of the average selling price to the average listing price for firm transactions entered into the TorontoMLS® system between the first and last day of the month/period being reported. 5 Average number of days on the market for firm transactions entered into the TorontoMLS® system between the first and last day of the month/period being reported. 6 Past monthly and year-to-date figures are revised on a monthly basis. Toronto East, July 2011 8
- 9. Toronto Real Estate Board Regional Housing Market Tables City of Toronto, Toronto E07 JULY 2011 1 1 1 1 2 3 4 5 Sales Dollar Volume Average Price Median Price New Listings Active Listings Avg. SP/LP Avg. DOM All Home Types 93 $33,163,466 $356,596 $347,000 175 190 99% 20 Detached 33 $16,394,400 $496,800 $495,000 46 36 101% 16 Semi-Detached 6 $2,450,500 $408,417 $399,500 14 12 102% 11 Condominium Townhouse 9 $2,763,188 $307,021 $300,000 14 9 104% 11 Condominium Apartment 34 $7,389,990 $217,353 $225,125 77 116 94% 30 Link 6 $2,405,888 $400,981 $394,444 17 15 101% 15 Att/Row/Townhouse 5 $1,759,500 $351,900 $348,000 7 2 99% 7 Co-Operative Apartment 0 - - - 0 0 - - Detached Condominium 0 - - - 0 0 - - Co-Ownership Apartment 0 - - - 0 0 - - 6 City of Toronto, Toronto E07 YEAR-TO-DATE 2011 Sales1 Dollar Volume1 Average Price1 Median Price1 New Listings2 Avg. SP/LP 4 Avg. DOM5 All Home Types 578 $216,714,323 $374,938 $378,500 976 101% 19 Detached 233 $118,529,840 $508,712 $482,000 337 101% 15 Semi-Detached 55 $21,681,076 $394,201 $391,500 74 102% 13 Condominium Townhouse 50 $14,875,826 $297,517 $291,400 72 101% 17 Condominium Apartment 173 $36,473,241 $210,828 $215,500 391 97% 30 Link 39 $15,560,752 $398,994 $402,000 68 102% 11 Att/Row/Townhouse 27 $9,369,588 $347,022 $348,000 33 101% 11 Co-Operative Apartment 1 $224,000 $224,000 $224,000 1 98% 23 Detached Condominium 0 - - - 0 - - Co-Ownership Apartment 0 - - - 0 - - NOTES 1 Sales, dollar volume, average sale prices and median sale prices are based on firm transactions entered into the TorontoMLS® system between the first and last day of the month/period being reported. 2 New listings entered into the TorontoMLS® system between the first and last day of the month/period being reported. 3 Active listings at the end of the last day of the month/period being reported. 4 Ratio of the average selling price to the average listing price for firm transactions entered into the TorontoMLS® system between the first and last day of the month/period being reported. 5 Average number of days on the market for firm transactions entered into the TorontoMLS® system between the first and last day of the month/period being reported. 6 Past monthly and year-to-date figures are revised on a monthly basis. Toronto East, July 2011 9
- 10. Toronto Real Estate Board Regional Housing Market Tables City of Toronto, Toronto E08 JULY 2011 1 1 1 1 2 3 4 5 Sales Dollar Volume Average Price Median Price New Listings Active Listings Avg. SP/LP Avg. DOM All Home Types 60 $20,984,338 $349,739 $357,500 101 158 98% 32 Detached 32 $15,431,488 $482,234 $409,500 46 56 99% 26 Semi-Detached 1 $360,000 $360,000 $360,000 2 3 96% 21 Condominium Townhouse 5 $1,423,500 $284,700 $290,000 12 16 96% 39 Condominium Apartment 22 $3,769,350 $171,334 $170,000 36 78 96% 41 Link 0 - - - 3 2 - - Att/Row/Townhouse 0 - - - 2 2 - - Co-Operative Apartment 0 - - - 0 0 - - Detached Condominium 0 - - - 0 1 - - Co-Ownership Apartment 0 - - - 0 0 - - 6 City of Toronto, Toronto E08 YEAR-TO-DATE 2011 Sales1 Dollar Volume1 Average Price1 Median Price1 New Listings2 Avg. SP/LP 4 Avg. DOM5 All Home Types 513 $181,776,749 $354,341 $347,000 849 98% 29 Detached 291 $135,305,899 $464,969 $397,000 456 98% 21 Semi-Detached 14 $4,129,500 $294,964 $286,500 16 98% 36 Condominium Townhouse 44 $11,684,150 $265,549 $280,000 80 98% 33 Condominium Apartment 151 $25,860,600 $171,262 $165,500 275 96% 45 Link 2 $820,100 $410,050 $410,050 6 106% 4 Att/Row/Townhouse 11 $3,976,500 $361,500 $358,000 15 97% 19 Co-Operative Apartment 0 - - - 0 - - Detached Condominium 0 - - - 1 - - Co-Ownership Apartment 0 - - - 0 - - NOTES 1 Sales, dollar volume, average sale prices and median sale prices are based on firm transactions entered into the TorontoMLS® system between the first and last day of the month/period being reported. 2 New listings entered into the TorontoMLS® system between the first and last day of the month/period being reported. 3 Active listings at the end of the last day of the month/period being reported. 4 Ratio of the average selling price to the average listing price for firm transactions entered into the TorontoMLS® system between the first and last day of the month/period being reported. 5 Average number of days on the market for firm transactions entered into the TorontoMLS® system between the first and last day of the month/period being reported. 6 Past monthly and year-to-date figures are revised on a monthly basis. Toronto East, July 2011 10
- 11. Toronto Real Estate Board Regional Housing Market Tables City of Toronto, Toronto E09 JULY 2011 1 1 1 1 2 3 4 5 Sales Dollar Volume Average Price Median Price New Listings Active Listings Avg. SP/LP Avg. DOM All Home Types 115 $34,075,476 $296,308 $279,500 238 285 99% 25 Detached 42 $16,323,900 $388,664 $378,500 87 64 101% 14 Semi-Detached 4 $1,310,900 $327,725 $328,500 7 5 99% 24 Condominium Townhouse 8 $1,578,700 $197,338 $205,350 9 25 95% 47 Condominium Apartment 59 $14,071,976 $238,508 $233,800 134 190 97% 30 Link 0 - - - 0 0 - - Att/Row/Townhouse 2 $790,000 $395,000 $395,000 1 1 98% 11 Co-Operative Apartment 0 - - - 0 0 - - Detached Condominium 0 - - - 0 0 - - Co-Ownership Apartment 0 - - - 0 0 - - 6 City of Toronto, Toronto E09 YEAR-TO-DATE 2011 Sales1 Dollar Volume1 Average Price1 Median Price1 New Listings2 Avg. SP/LP 4 Avg. DOM5 All Home Types 743 $213,907,585 $287,897 $273,000 1,307 99% 27 Detached 267 $101,919,944 $381,723 $376,600 404 100% 19 Semi-Detached 21 $6,680,145 $318,102 $317,000 23 99% 27 Condominium Townhouse 71 $13,990,300 $197,046 $208,000 117 96% 43 Condominium Apartment 380 $89,764,996 $236,224 $235,000 754 98% 30 Link 0 - - - 0 - - Att/Row/Townhouse 4 $1,552,200 $388,050 $395,000 9 98% 11 Co-Operative Apartment 0 - - - 0 - - Detached Condominium 0 - - - 0 - - Co-Ownership Apartment 0 - - - 0 - - NOTES 1 Sales, dollar volume, average sale prices and median sale prices are based on firm transactions entered into the TorontoMLS® system between the first and last day of the month/period being reported. 2 New listings entered into the TorontoMLS® system between the first and last day of the month/period being reported. 3 Active listings at the end of the last day of the month/period being reported. 4 Ratio of the average selling price to the average listing price for firm transactions entered into the TorontoMLS® system between the first and last day of the month/period being reported. 5 Average number of days on the market for firm transactions entered into the TorontoMLS® system between the first and last day of the month/period being reported. 6 Past monthly and year-to-date figures are revised on a monthly basis. Toronto East, July 2011 11
- 12. Toronto Real Estate Board Regional Housing Market Tables City of Toronto, Toronto E10 JULY 2011 1 1 1 1 2 3 4 5 Sales Dollar Volume Average Price Median Price New Listings Active Listings Avg. SP/LP Avg. DOM All Home Types 39 $18,865,400 $483,728 $460,000 64 82 98% 27 Detached 28 $15,683,400 $560,121 $510,000 46 53 98% 26 Semi-Detached 2 $758,500 $379,250 $379,250 1 1 99% 19 Condominium Townhouse 2 $363,000 $181,500 $181,500 8 13 97% 28 Condominium Apartment 2 $237,500 $118,750 $118,750 5 7 97% 26 Link 0 - - - 0 0 - - Att/Row/Townhouse 5 $1,823,000 $364,600 $390,000 3 5 98% 41 Co-Operative Apartment 0 - - - 1 3 - - Detached Condominium 0 - - - 0 0 - - Co-Ownership Apartment 0 - - - 0 0 - - 6 City of Toronto, Toronto E10 YEAR-TO-DATE 2011 Sales1 Dollar Volume1 Average Price1 Median Price1 New Listings2 Avg. SP/LP 4 Avg. DOM5 All Home Types 329 $134,885,117 $409,985 $405,500 519 99% 22 Detached 235 $110,748,195 $471,269 $446,000 364 99% 19 Semi-Detached 13 $4,897,786 $376,753 $380,000 17 101% 16 Condominium Townhouse 27 $6,012,050 $222,669 $220,000 50 98% 33 Condominium Apartment 21 $3,195,500 $152,167 $148,000 37 96% 36 Link 0 - - - 0 - - Att/Row/Townhouse 25 $9,040,386 $361,615 $355,000 36 99% 22 Co-Operative Apartment 8 $991,200 $123,900 $140,000 15 98% 29 Detached Condominium 0 - - - 0 - - Co-Ownership Apartment 0 - - - 0 - - NOTES 1 Sales, dollar volume, average sale prices and median sale prices are based on firm transactions entered into the TorontoMLS® system between the first and last day of the month/period being reported. 2 New listings entered into the TorontoMLS® system between the first and last day of the month/period being reported. 3 Active listings at the end of the last day of the month/period being reported. 4 Ratio of the average selling price to the average listing price for firm transactions entered into the TorontoMLS® system between the first and last day of the month/period being reported. 5 Average number of days on the market for firm transactions entered into the TorontoMLS® system between the first and last day of the month/period being reported. 6 Past monthly and year-to-date figures are revised on a monthly basis. Toronto East, July 2011 12
- 13. Toronto Real Estate Board Regional Housing Market Tables City of Toronto, Toronto E11 JULY 2011 1 1 1 1 2 3 4 5 Sales Dollar Volume Average Price Median Price New Listings Active Listings Avg. SP/LP Avg. DOM All Home Types 99 $30,422,894 $307,302 $297,000 147 203 98% 31 Detached 30 $13,181,703 $439,390 $429,250 46 44 99% 17 Semi-Detached 10 $3,187,000 $318,700 $307,500 18 20 98% 25 Condominium Townhouse 17 $4,348,000 $255,765 $240,000 21 31 97% 43 Condominium Apartment 23 $3,890,300 $169,143 $160,000 39 87 97% 49 Link 3 $961,600 $320,533 $330,000 6 5 97% 30 Att/Row/Townhouse 15 $4,590,591 $306,039 $276,500 17 15 100% 20 Co-Operative Apartment 0 - - - 0 0 - - Detached Condominium 1 $263,700 $263,700 $263,700 0 1 95% 26 Co-Ownership Apartment 0 - - - 0 0 - - 6 City of Toronto, Toronto E11 YEAR-TO-DATE 2011 Sales1 Dollar Volume1 Average Price1 Median Price1 New Listings2 Avg. SP/LP 4 Avg. DOM5 All Home Types 591 $175,334,228 $296,674 $285,000 1,037 99% 29 Detached 194 $81,067,201 $417,872 $410,000 298 99% 19 Semi-Detached 67 $21,706,486 $323,977 $295,000 110 100% 14 Condominium Townhouse 81 $18,811,050 $232,235 $220,000 152 97% 32 Condominium Apartment 168 $27,763,150 $165,257 $162,000 340 97% 49 Link 10 $3,302,200 $330,220 $330,000 19 99% 30 Att/Row/Townhouse 68 $21,845,441 $321,256 $319,950 110 99% 18 Co-Operative Apartment 0 - - - 1 - - Detached Condominium 3 $838,700 $279,567 $285,000 7 97% 26 Co-Ownership Apartment 0 - - - 0 - - NOTES 1 Sales, dollar volume, average sale prices and median sale prices are based on firm transactions entered into the TorontoMLS® system between the first and last day of the month/period being reported. 2 New listings entered into the TorontoMLS® system between the first and last day of the month/period being reported. 3 Active listings at the end of the last day of the month/period being reported. 4 Ratio of the average selling price to the average listing price for firm transactions entered into the TorontoMLS® system between the first and last day of the month/period being reported. 5 Average number of days on the market for firm transactions entered into the TorontoMLS® system between the first and last day of the month/period being reported. 6 Past monthly and year-to-date figures are revised on a monthly basis. Toronto East, July 2011 13