Download as PDF, PPTX


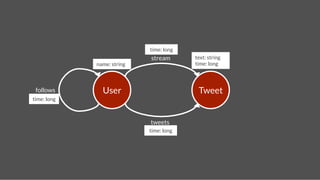
![Connecting Titan
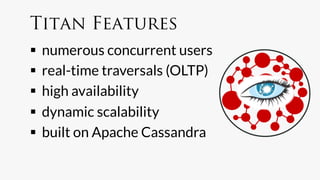
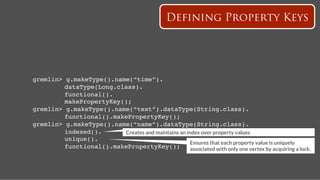
titan$ bin/gremlin.sh!
,,,/!
(o o)!
-----oOOo-(_)-oOOo-----!
gremlin> conf = new BaseConfiguration();!
==>org.apache.commons.configuration.BaseConfiguration@763861e6!
gremlin> conf.setProperty("storage.backend","cassandra");!
gremlin> conf.setProperty("storage.hostname","77.77.77.77");!
gremlin> g = TitanFactory.open(conf);
==>titangraph[cassandra:77.77.77.77]!
gremlin>!](https://image.slidesharecdn.com/titancassandra-120808134054-phpapp02/85/Titan-Big-Graph-Data-with-Cassandra-38-320.jpg)
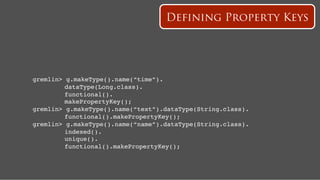
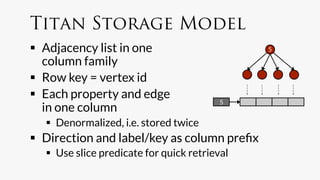
![name: Hercules
name: Pluto
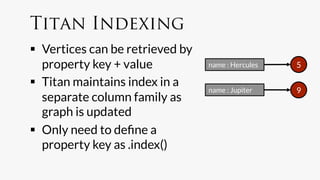
Create Accounts
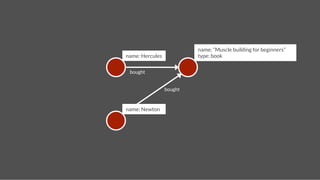
gremlin> hercules = g.addVertex(['name':'Hercules']);!
gremlin> pluto = g.addVertex(['name':'Pluto']);!](https://image.slidesharecdn.com/titancassandra-120808134054-phpapp02/85/Titan-Big-Graph-Data-with-Cassandra-52-320.jpg)
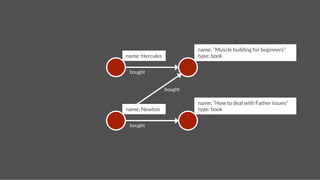
![name: Hercules
name: Pluto
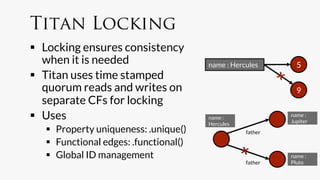
Add Followship
follows
time:2
gremlin> hercules = g.addVertex(['name':'Hercules']);!
gremlin> pluto = g.addVertex(['name':'Pluto']);!
gremlin> g.addEdge(hercules,pluto,"follows",['time':2]);!](https://image.slidesharecdn.com/titancassandra-120808134054-phpapp02/85/Titan-Big-Graph-Data-with-Cassandra-53-320.jpg)
![name: Hercules
name: Pluto
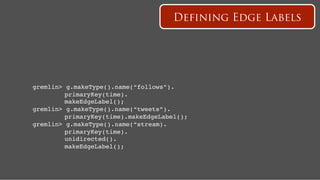
Publish Tweet
follows
time:2
tweets
time:4
text: A tweet!
time: 4!
gremlin> hercules = g.addVertex(['name':'Hercules']);!
gremlin> pluto = g.addVertex(['name':'Pluto']);!
gremlin> g.addEdge(hercules,pluto,"follows",['time':2]);!
gremlin> tweet = g.addVertex(['text':'A tweet!','time':4])!
gremlin> g.addEdge(pluto,tweet,"tweets",['time':4]) !](https://image.slidesharecdn.com/titancassandra-120808134054-phpapp02/85/Titan-Big-Graph-Data-with-Cassandra-54-320.jpg)
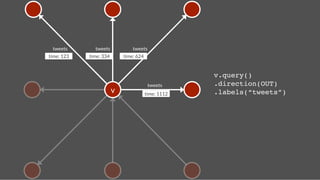
![name: Hercules
name: Pluto
Update Streams
follows
time:2
stream
tweets
time:4
time:4
text: A tweet!
time: 4!
gremlin> hercules = g.addVertex(['name':'Hercules']);!
gremlin> pluto = g.addVertex(['name':'Pluto']);!
gremlin> g.addEdge(hercules,pluto,"follows",['time':2]);!
gremlin> tweet = g.addVertex(['text':'A tweet!','time':4])!
gremlin> g.addEdge(pluto,tweet,"tweets",['time':4]) !
gremlin> pluto.in("follows").each{g.addEdge(it,tweet,"stream",['time':4])} !](https://image.slidesharecdn.com/titancassandra-120808134054-phpapp02/85/Titan-Big-Graph-Data-with-Cassandra-55-320.jpg)
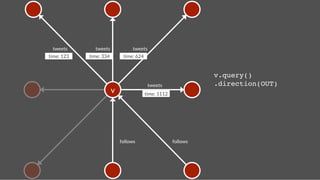
![name: Hercules
name: Pluto
Read Stream
follows
time:2
stream
tweets
time:4
time:4
text: A tweet!
time: 4!
gremlin> hercules = g.addVertex(['name':'Hercules']);!
gremlin> pluto = g.addVertex(['name':'Pluto']);!
gremlin> g.addEdge(hercules,pluto,"follows",['time':2]);!
gremlin> tweet = g.addVertex(['text':'A tweet!','time':4])!
gremlin> g.addEdge(pluto,tweet,"tweets",['time':4]) !
gremlin> pluto.in("follows").each{g.addEdge(it,tweet,"stream",['time':4])} !
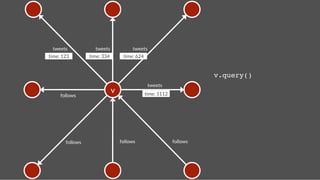
gremlin> hercules.outE('stream')[0..9].inV.map!
Sorted by time because its ‘stream’s primary key](https://image.slidesharecdn.com/titancassandra-120808134054-phpapp02/85/Titan-Big-Graph-Data-with-Cassandra-56-320.jpg)
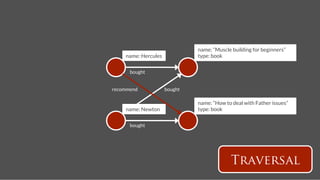
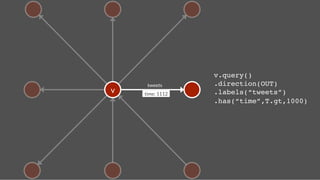
![Followship name: Hercules
name: Pluto
Recommendation
follows
time:2
follows
follows
time:9
name: Neptune
follows = g.V('name',’Hercules’).out('follows').toList()!
follows20 = follows[(0..19).collect{random.nextInt(follows.size)}]!
m = [:]!
follows20.each !
{ it.outE('follows’[0..29].inV.except(follows).groupCount(m).iterate() }!
m.sort{a,b -> b.value <=> a.value}[0..4]!](https://image.slidesharecdn.com/titancassandra-120808134054-phpapp02/85/Titan-Big-Graph-Data-with-Cassandra-57-320.jpg)


Titan is an open-source distributed graph database built on Apache Cassandra, designed for real-time applications accommodating thousands of concurrent users and capable of handling graphs with billions of edges. It features efficient data models, query languages, and techniques for edge compression, facilitating big graph data processing. A performance benchmark demonstrates Titan's ability to manage high loads and swift transaction times in social network simulations.


![Big Data [sorry] & Data Science: What Does a Data Scientist Do?](https://cdn.slidesharecdn.com/ss_thumbnails/dslatcloudmsevent20130125-130126065651-phpapp01-thumbnail.jpg?width=640&height=640&fit=bounds)


