Download as PDF, PPTX
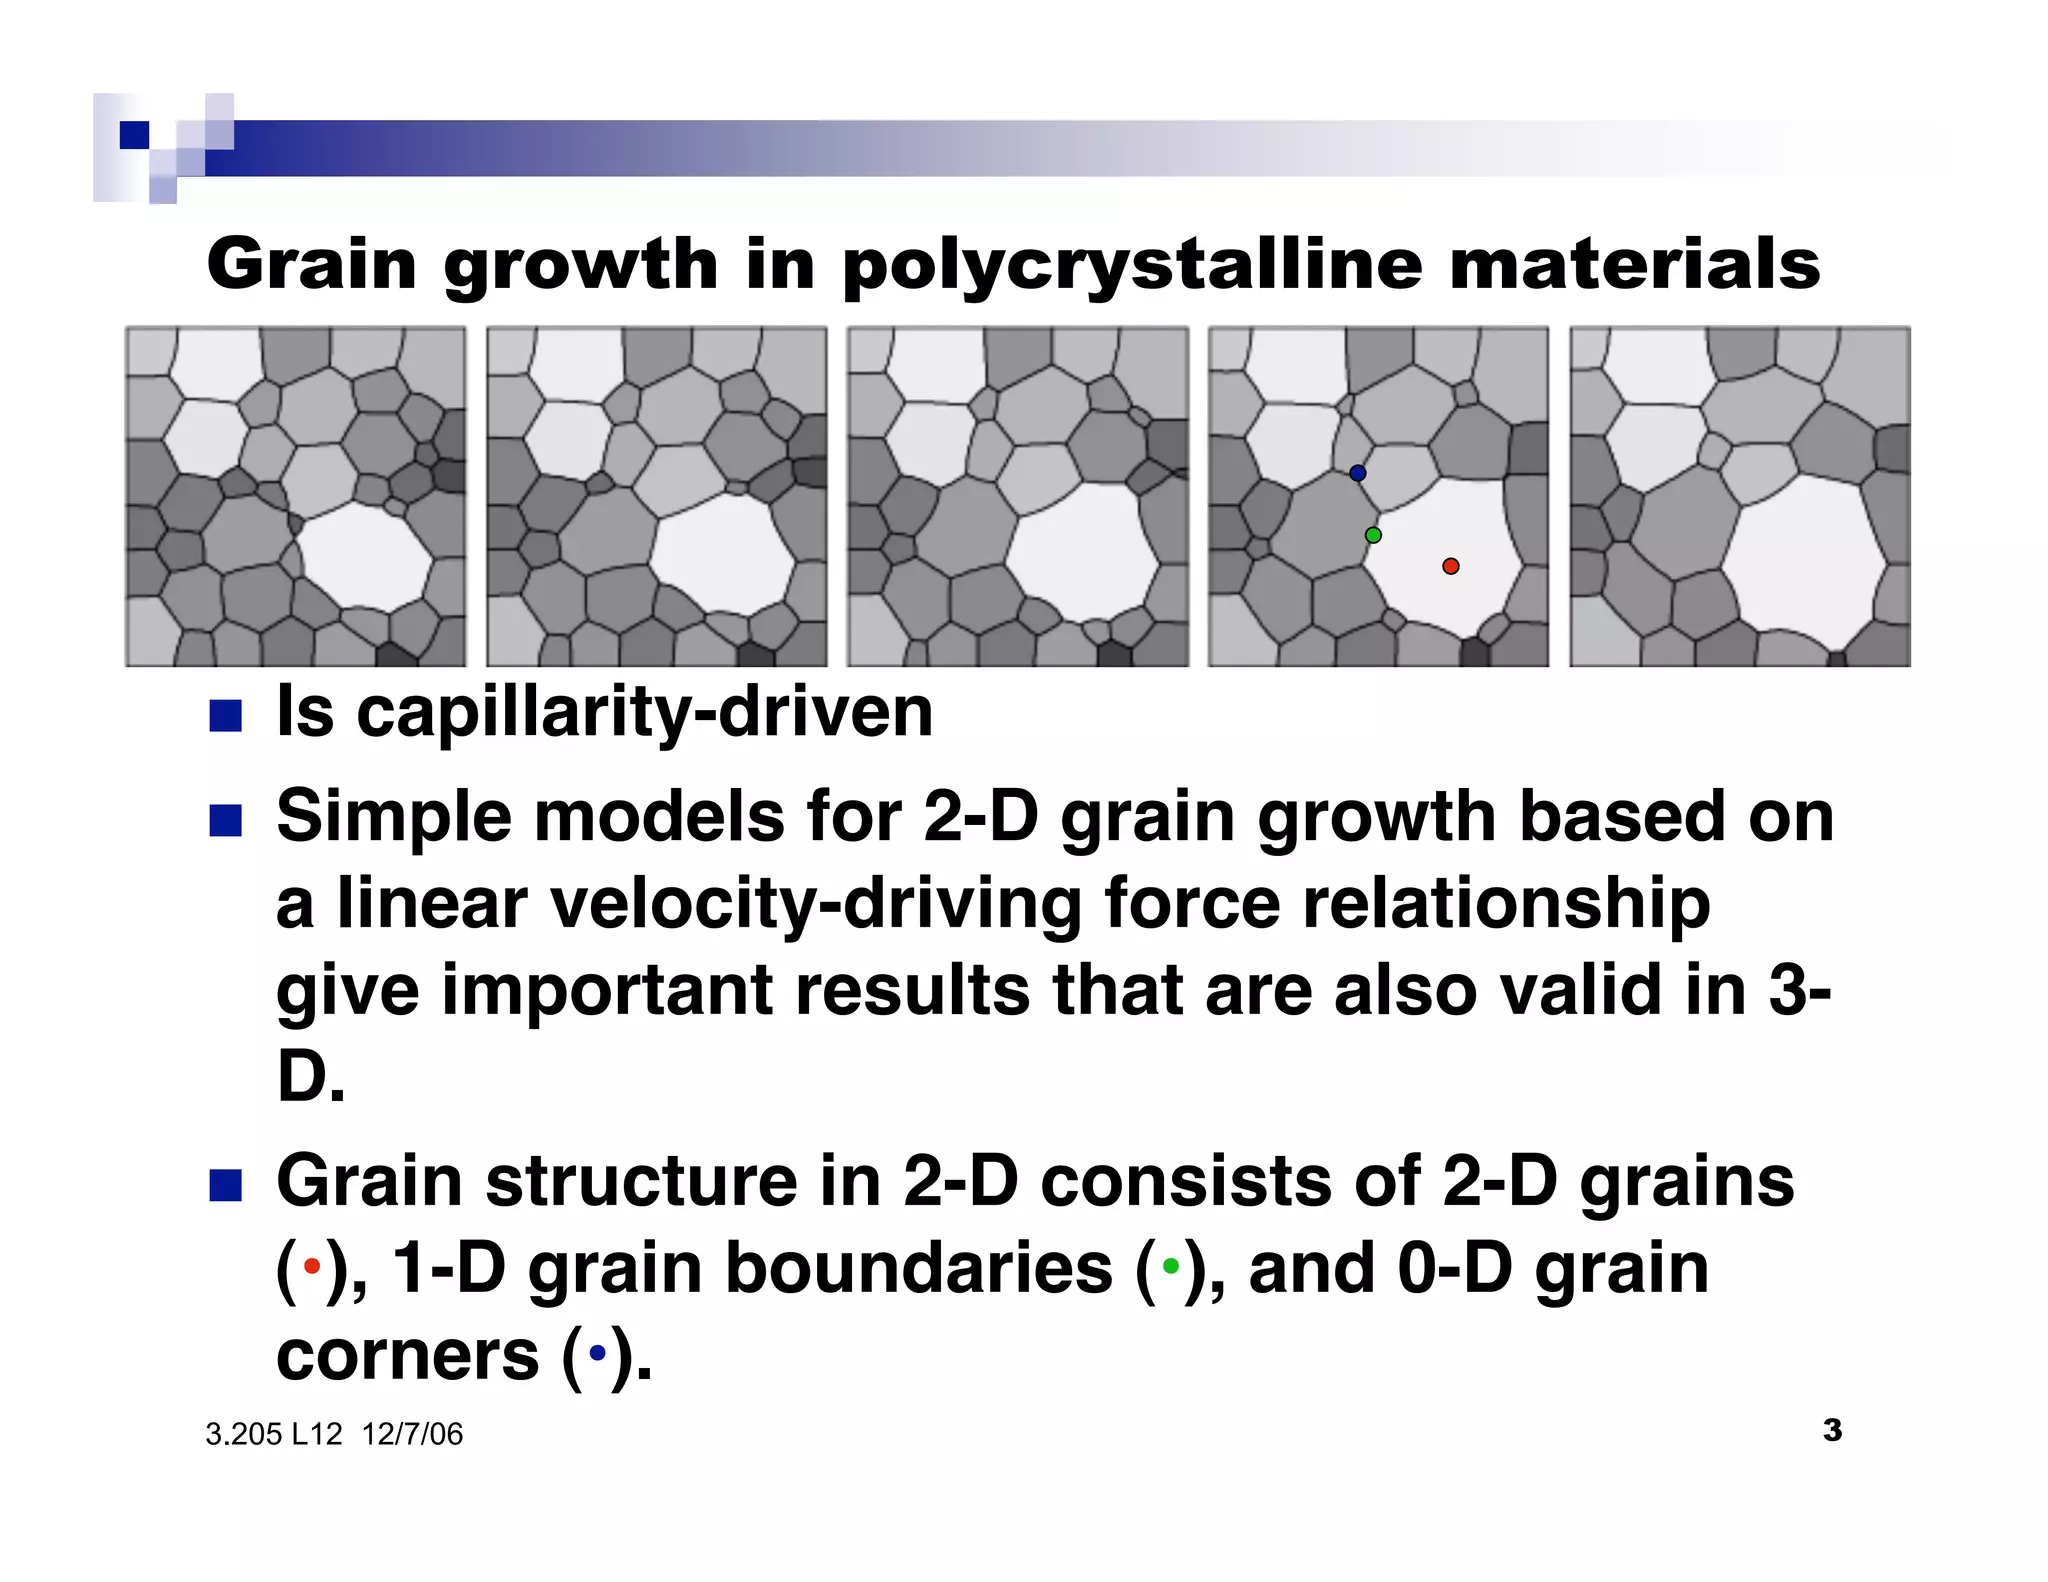
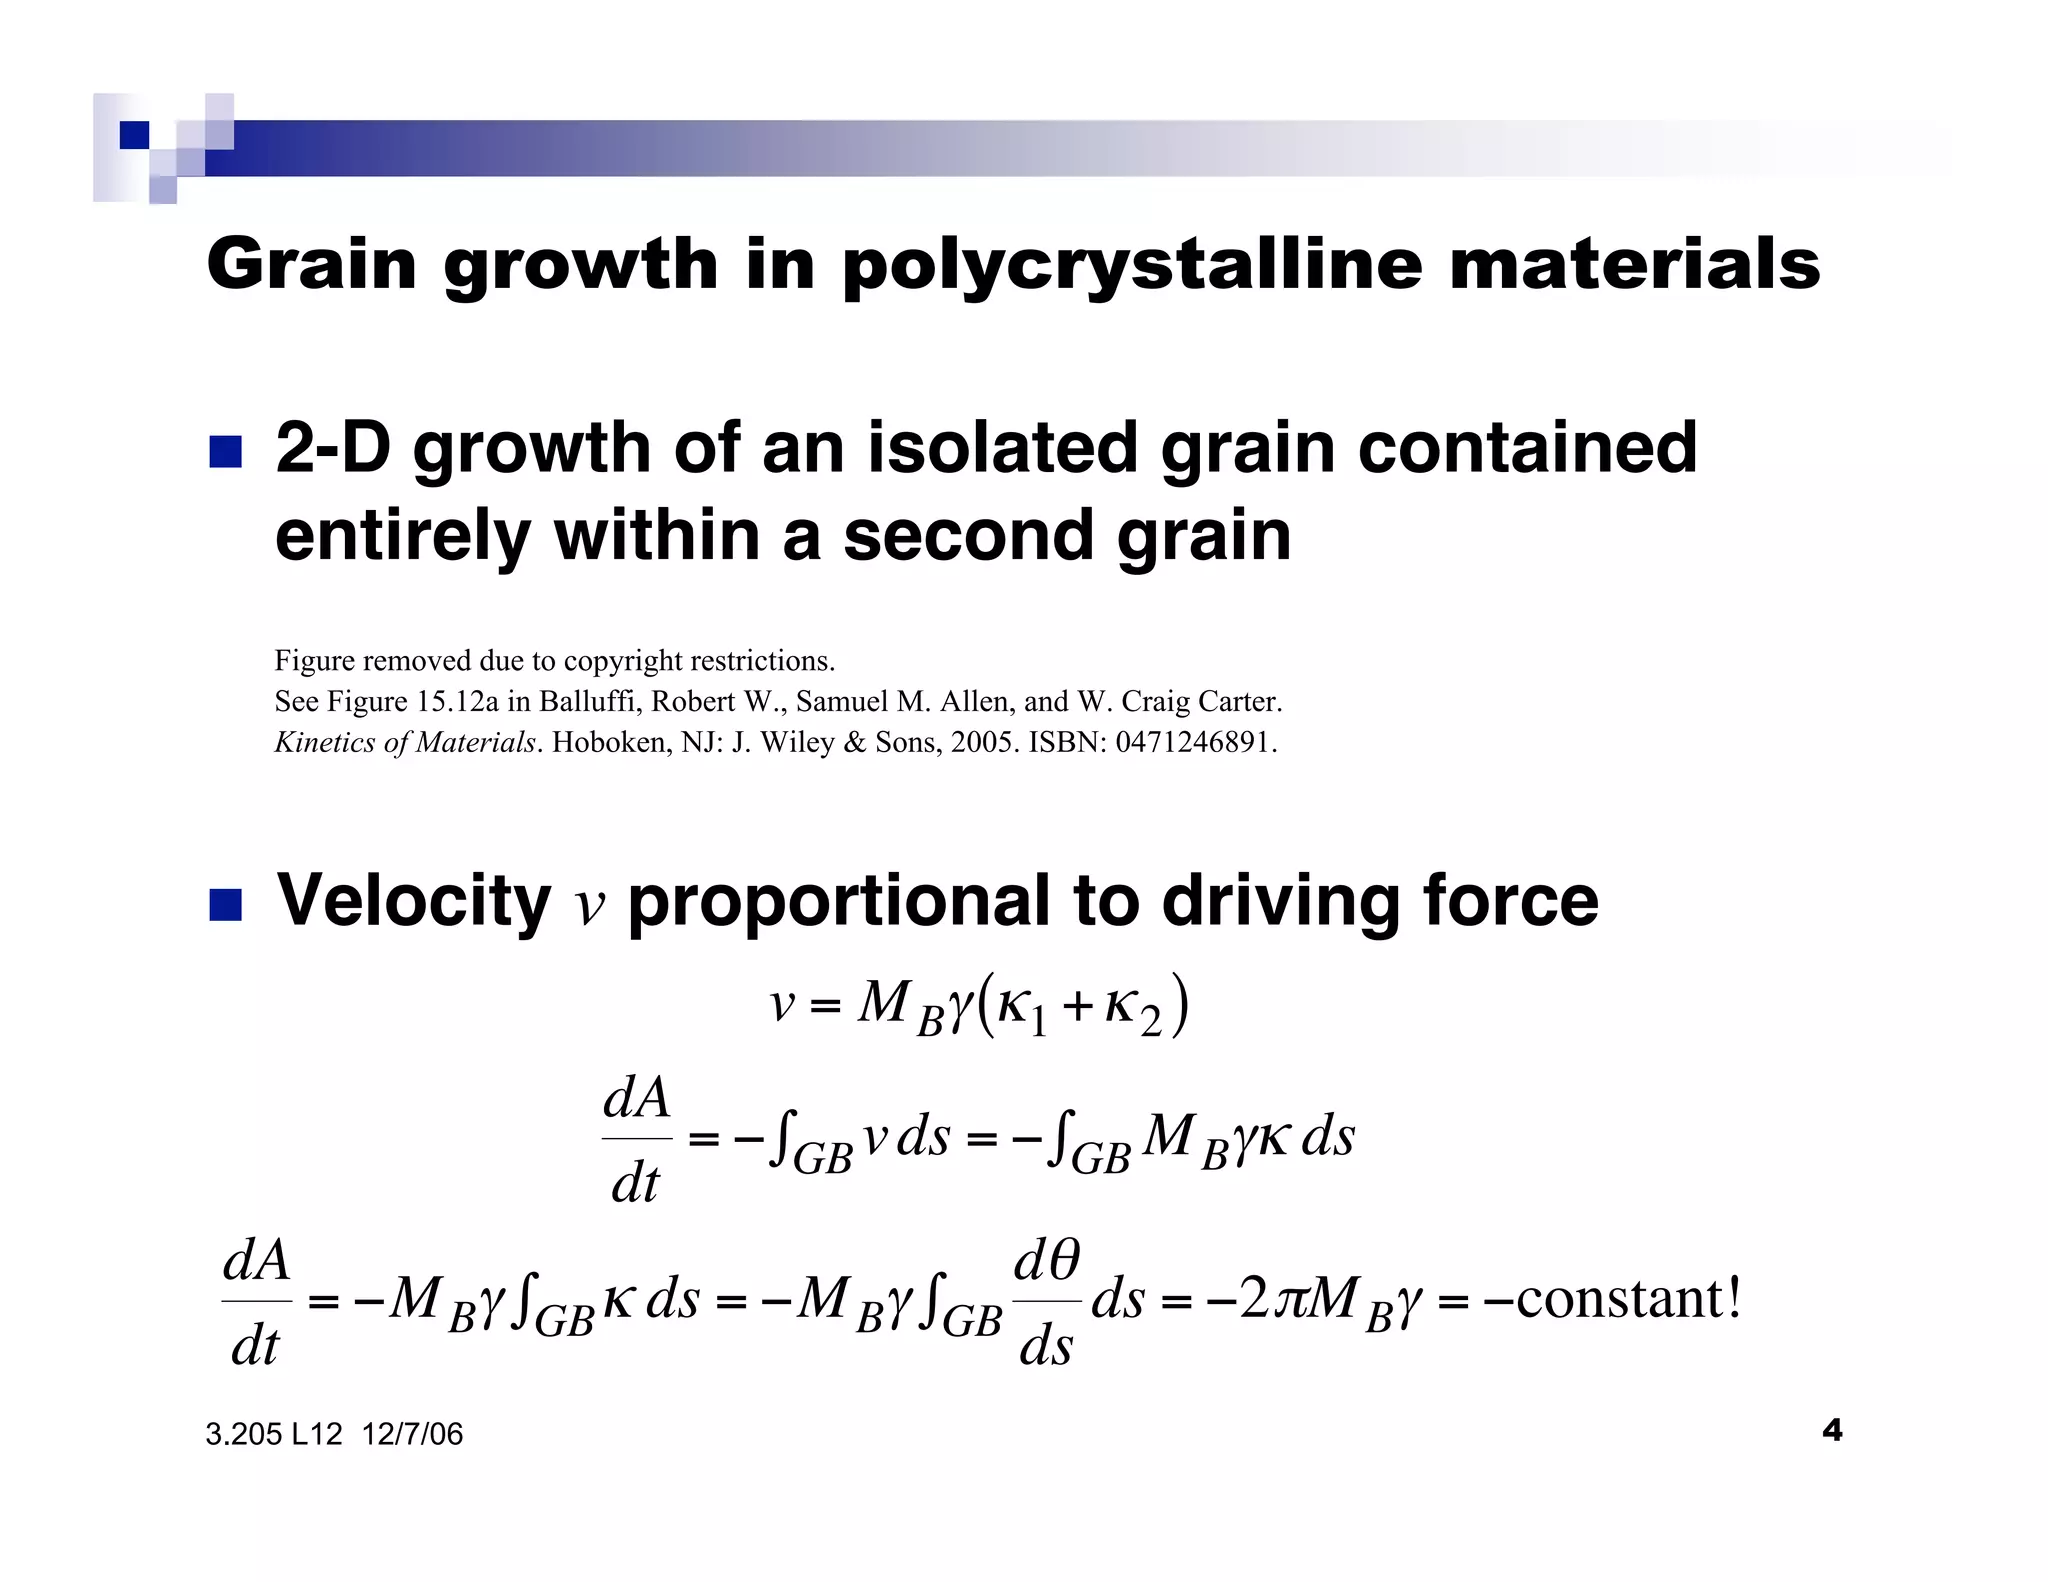
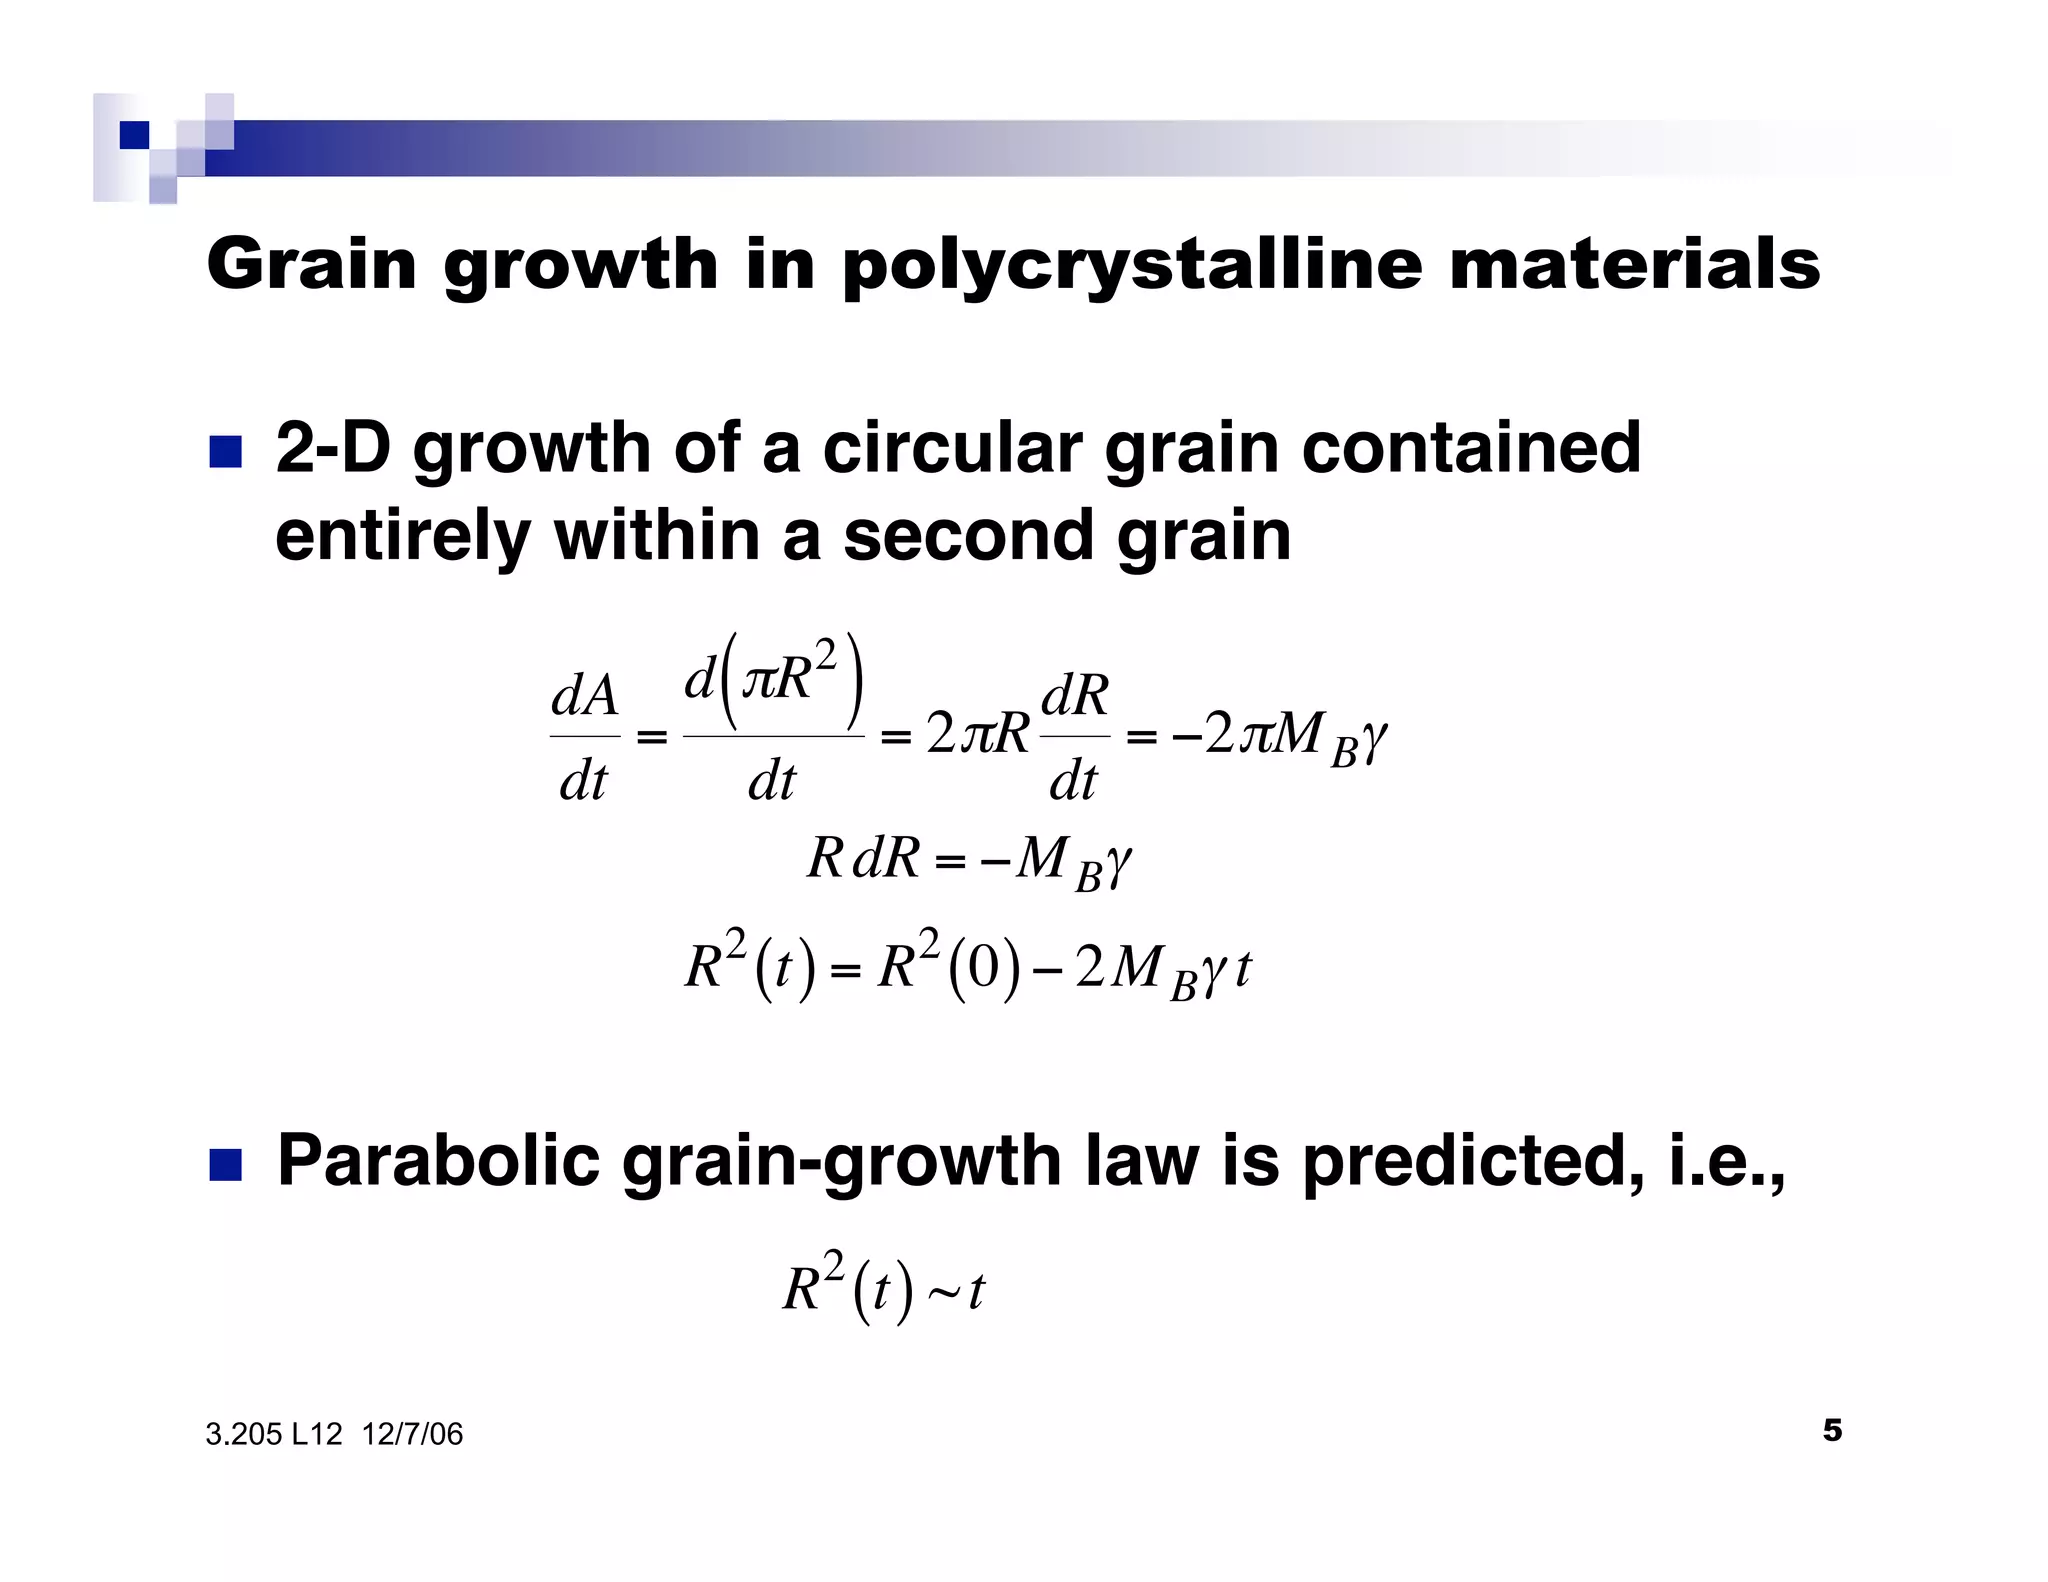
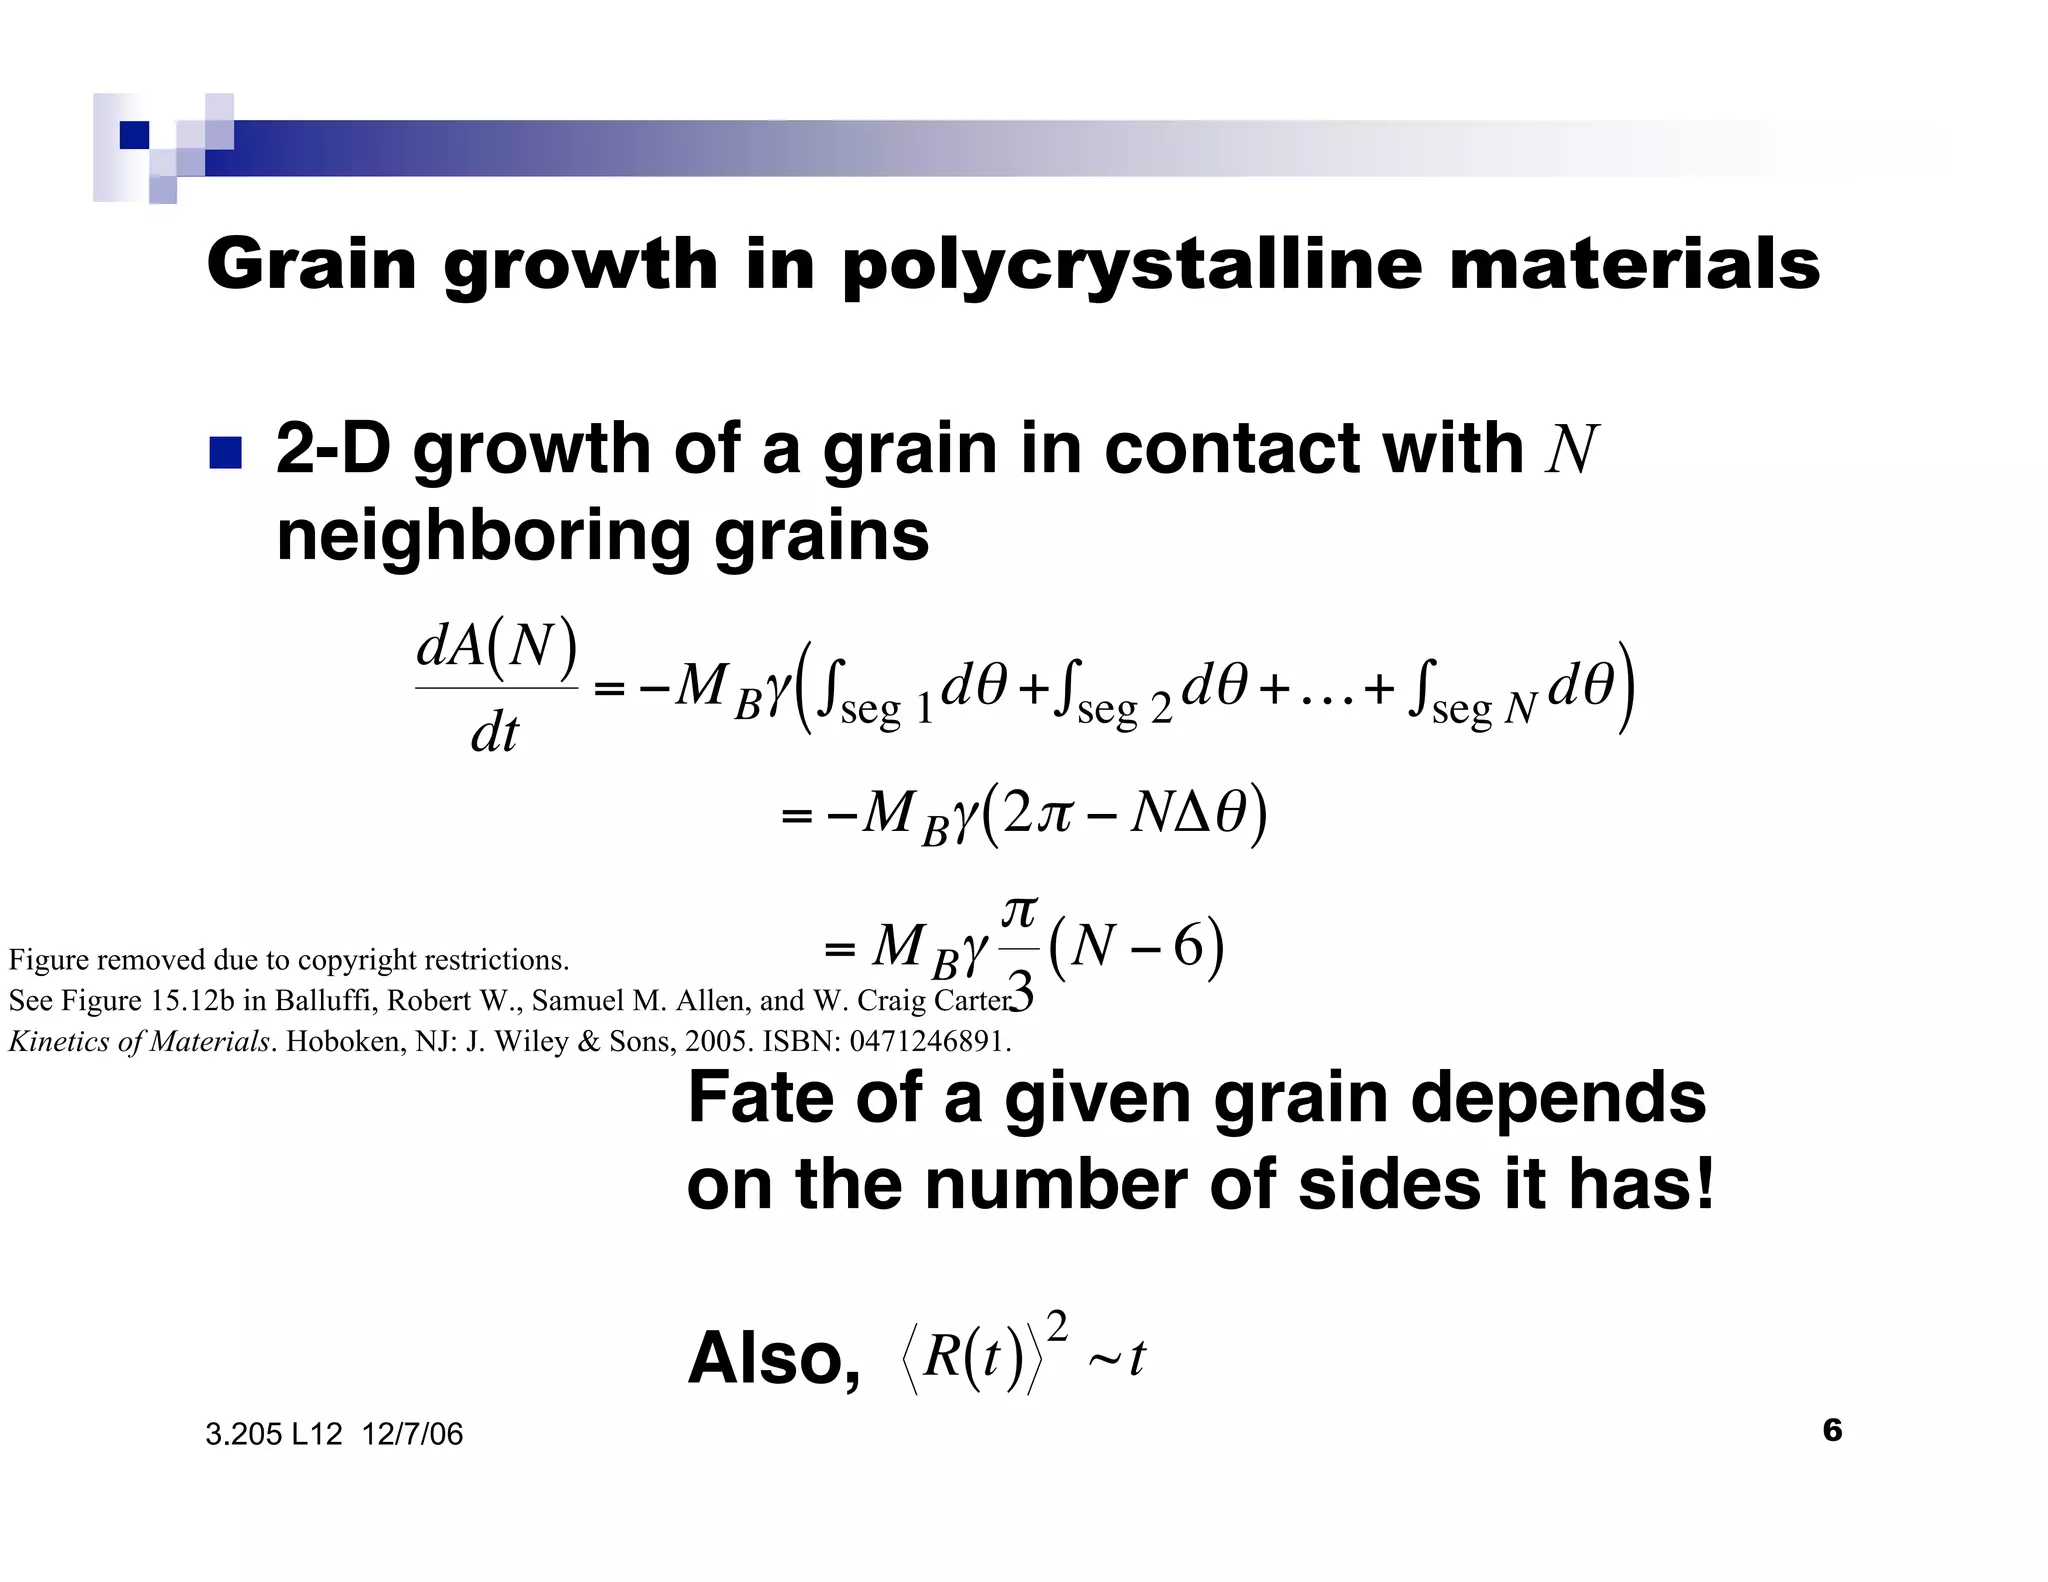
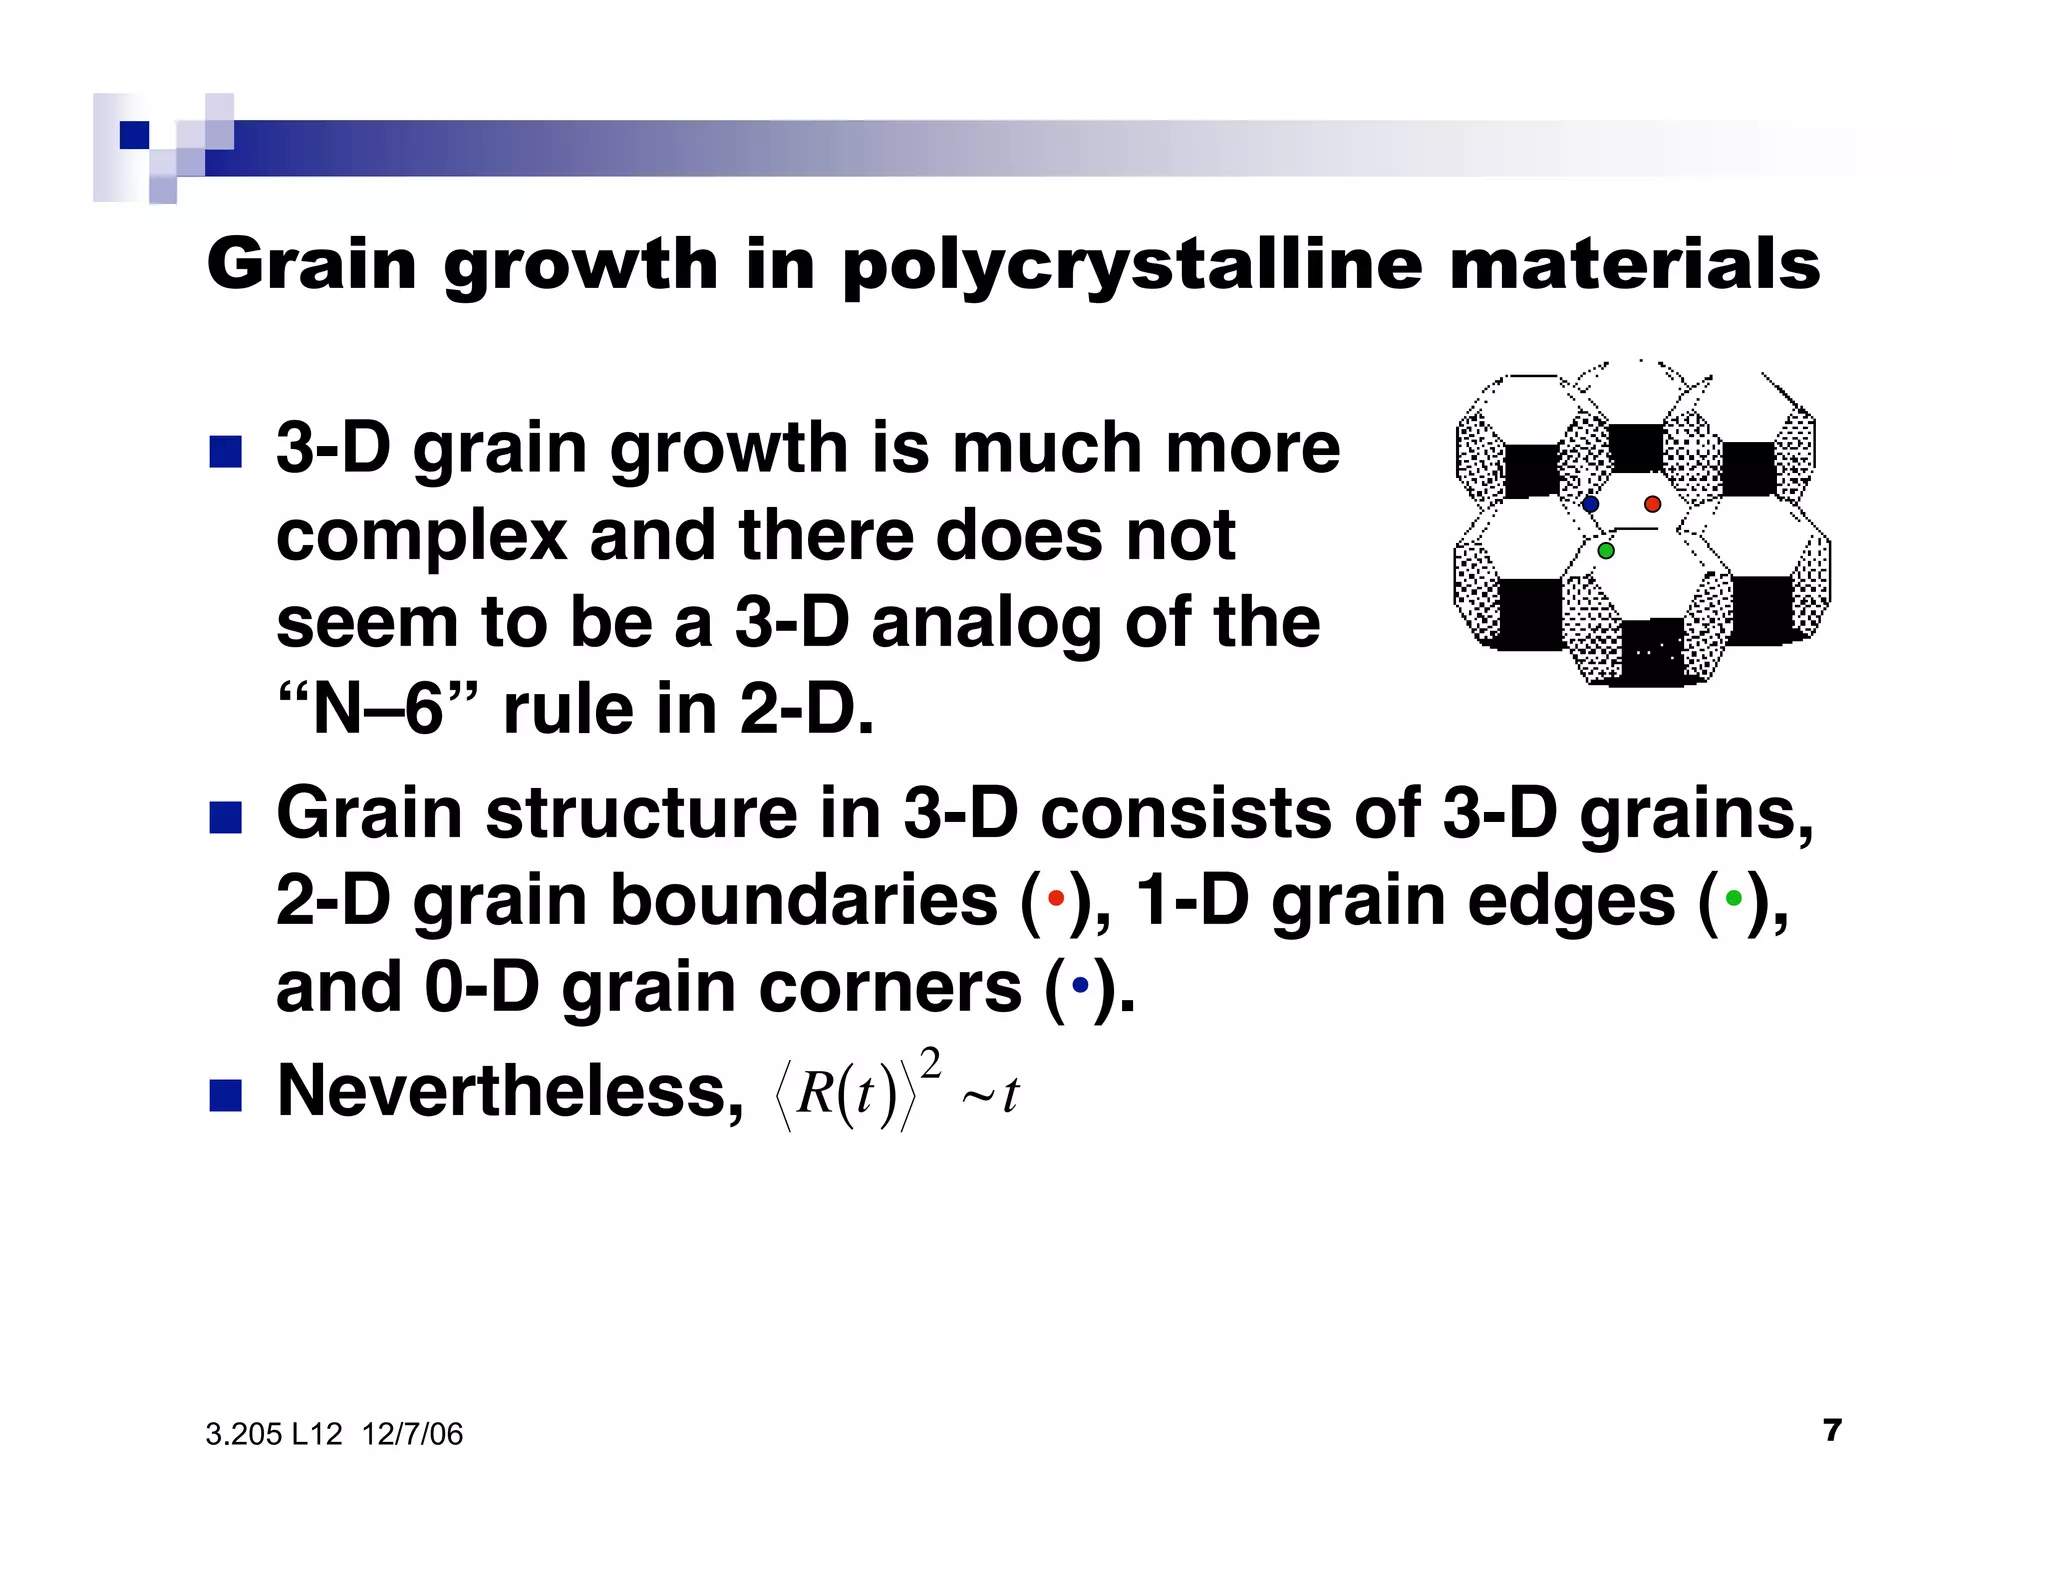
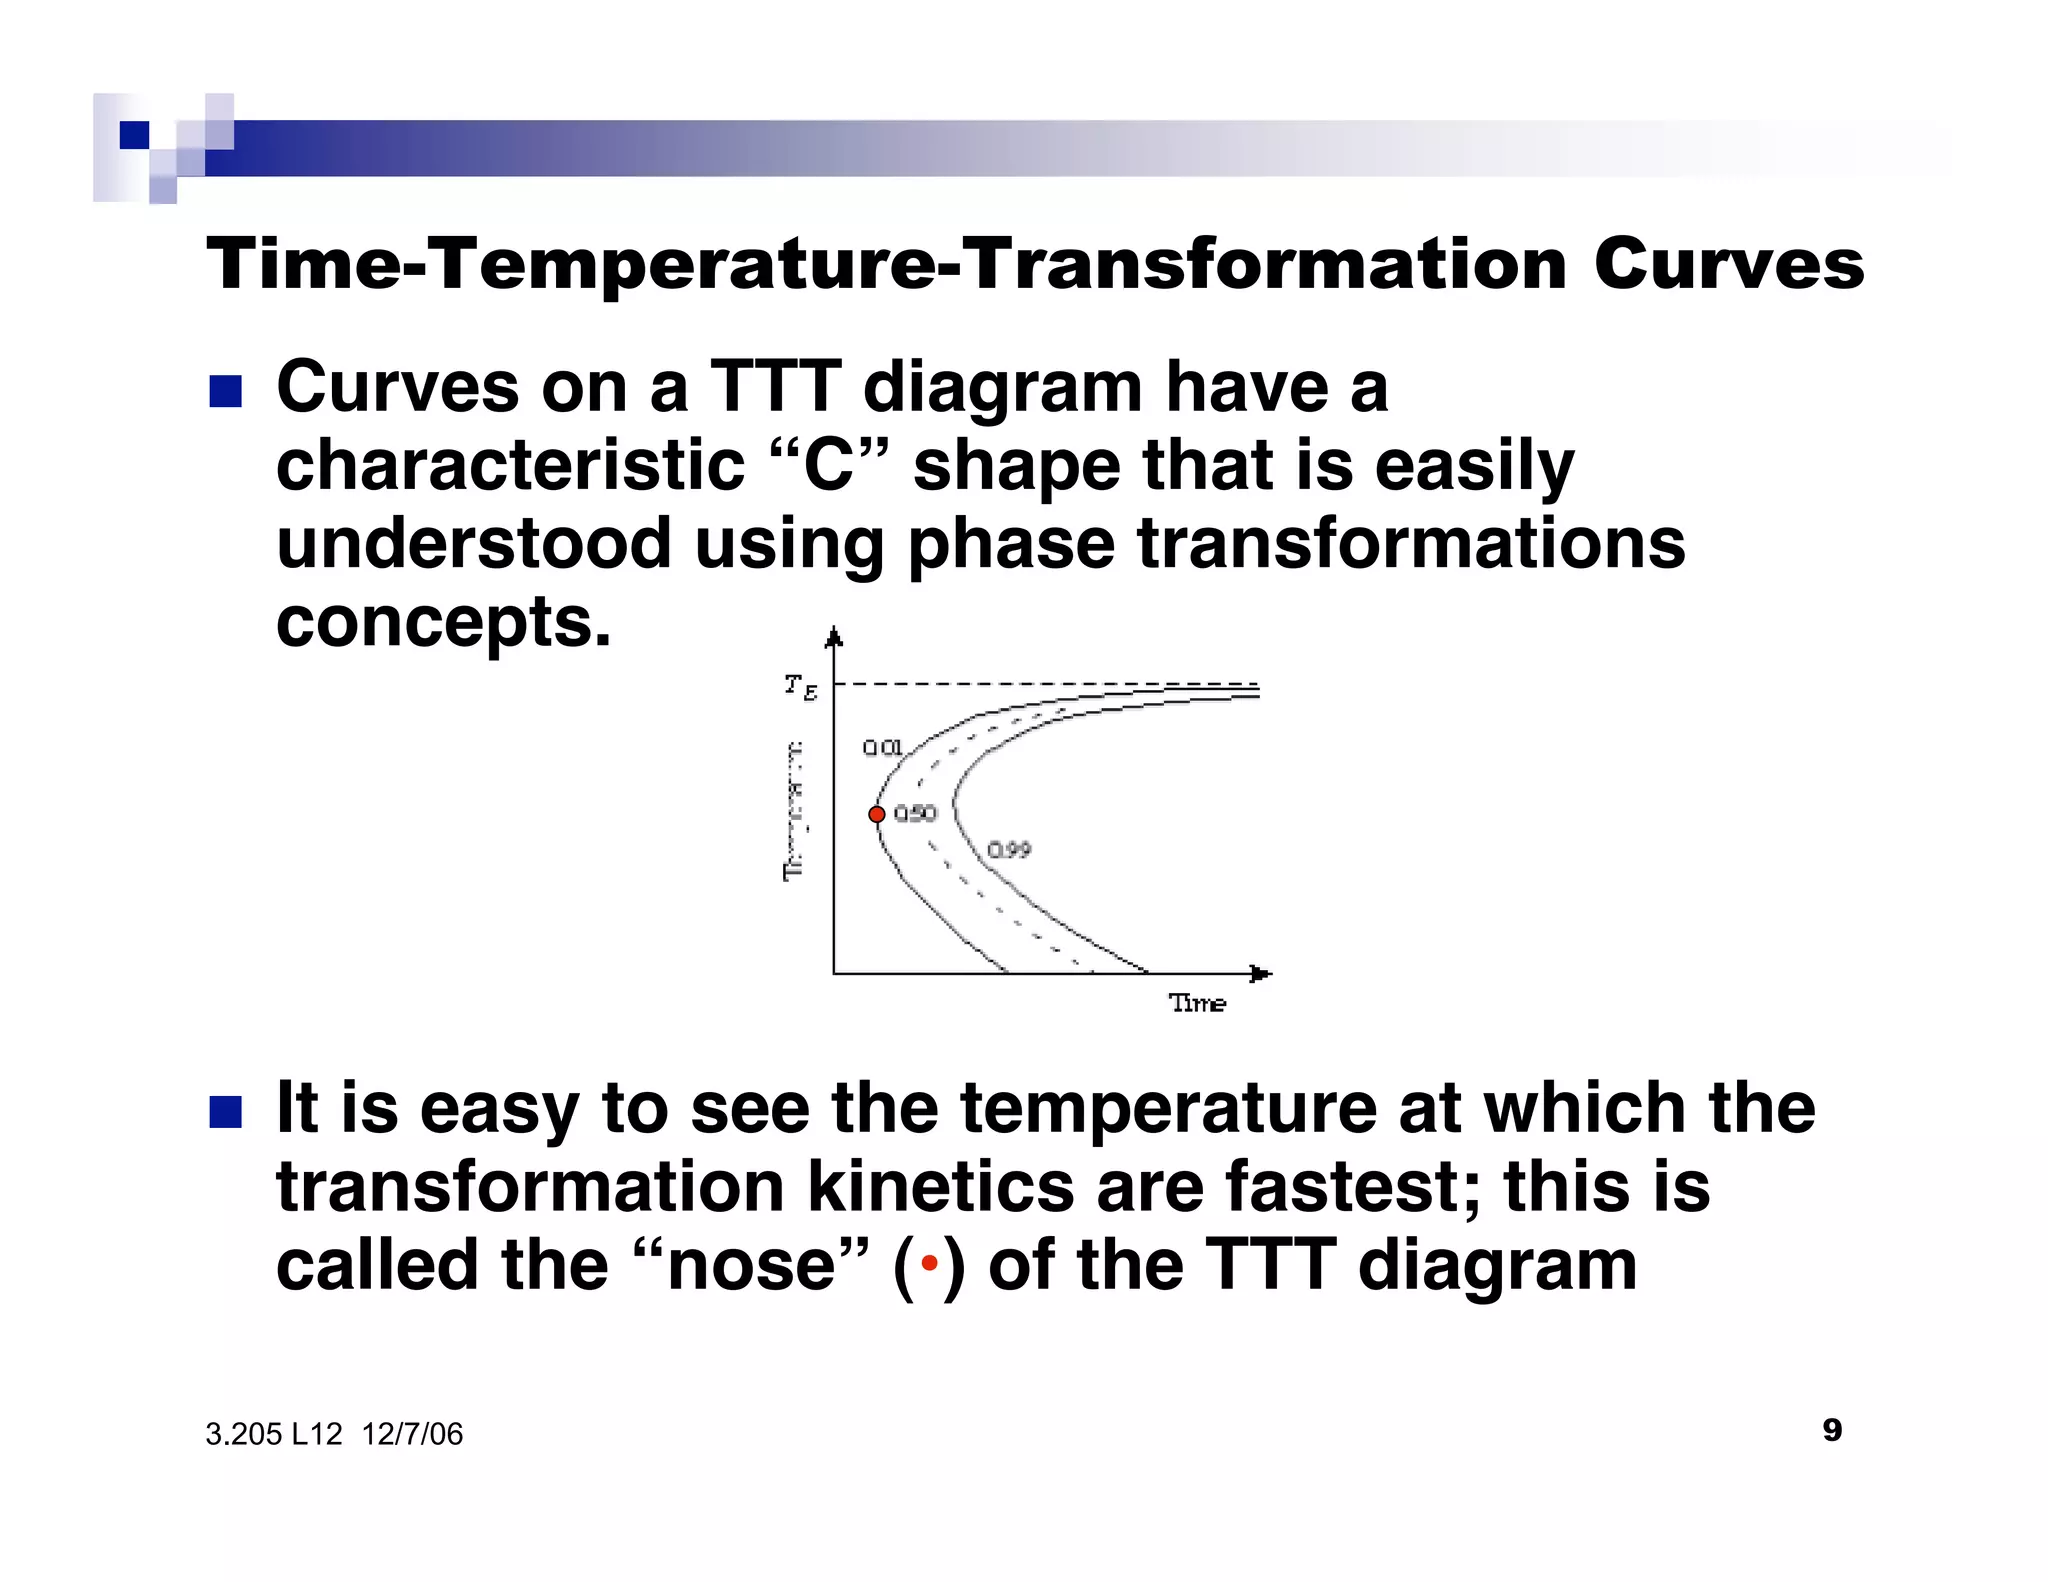
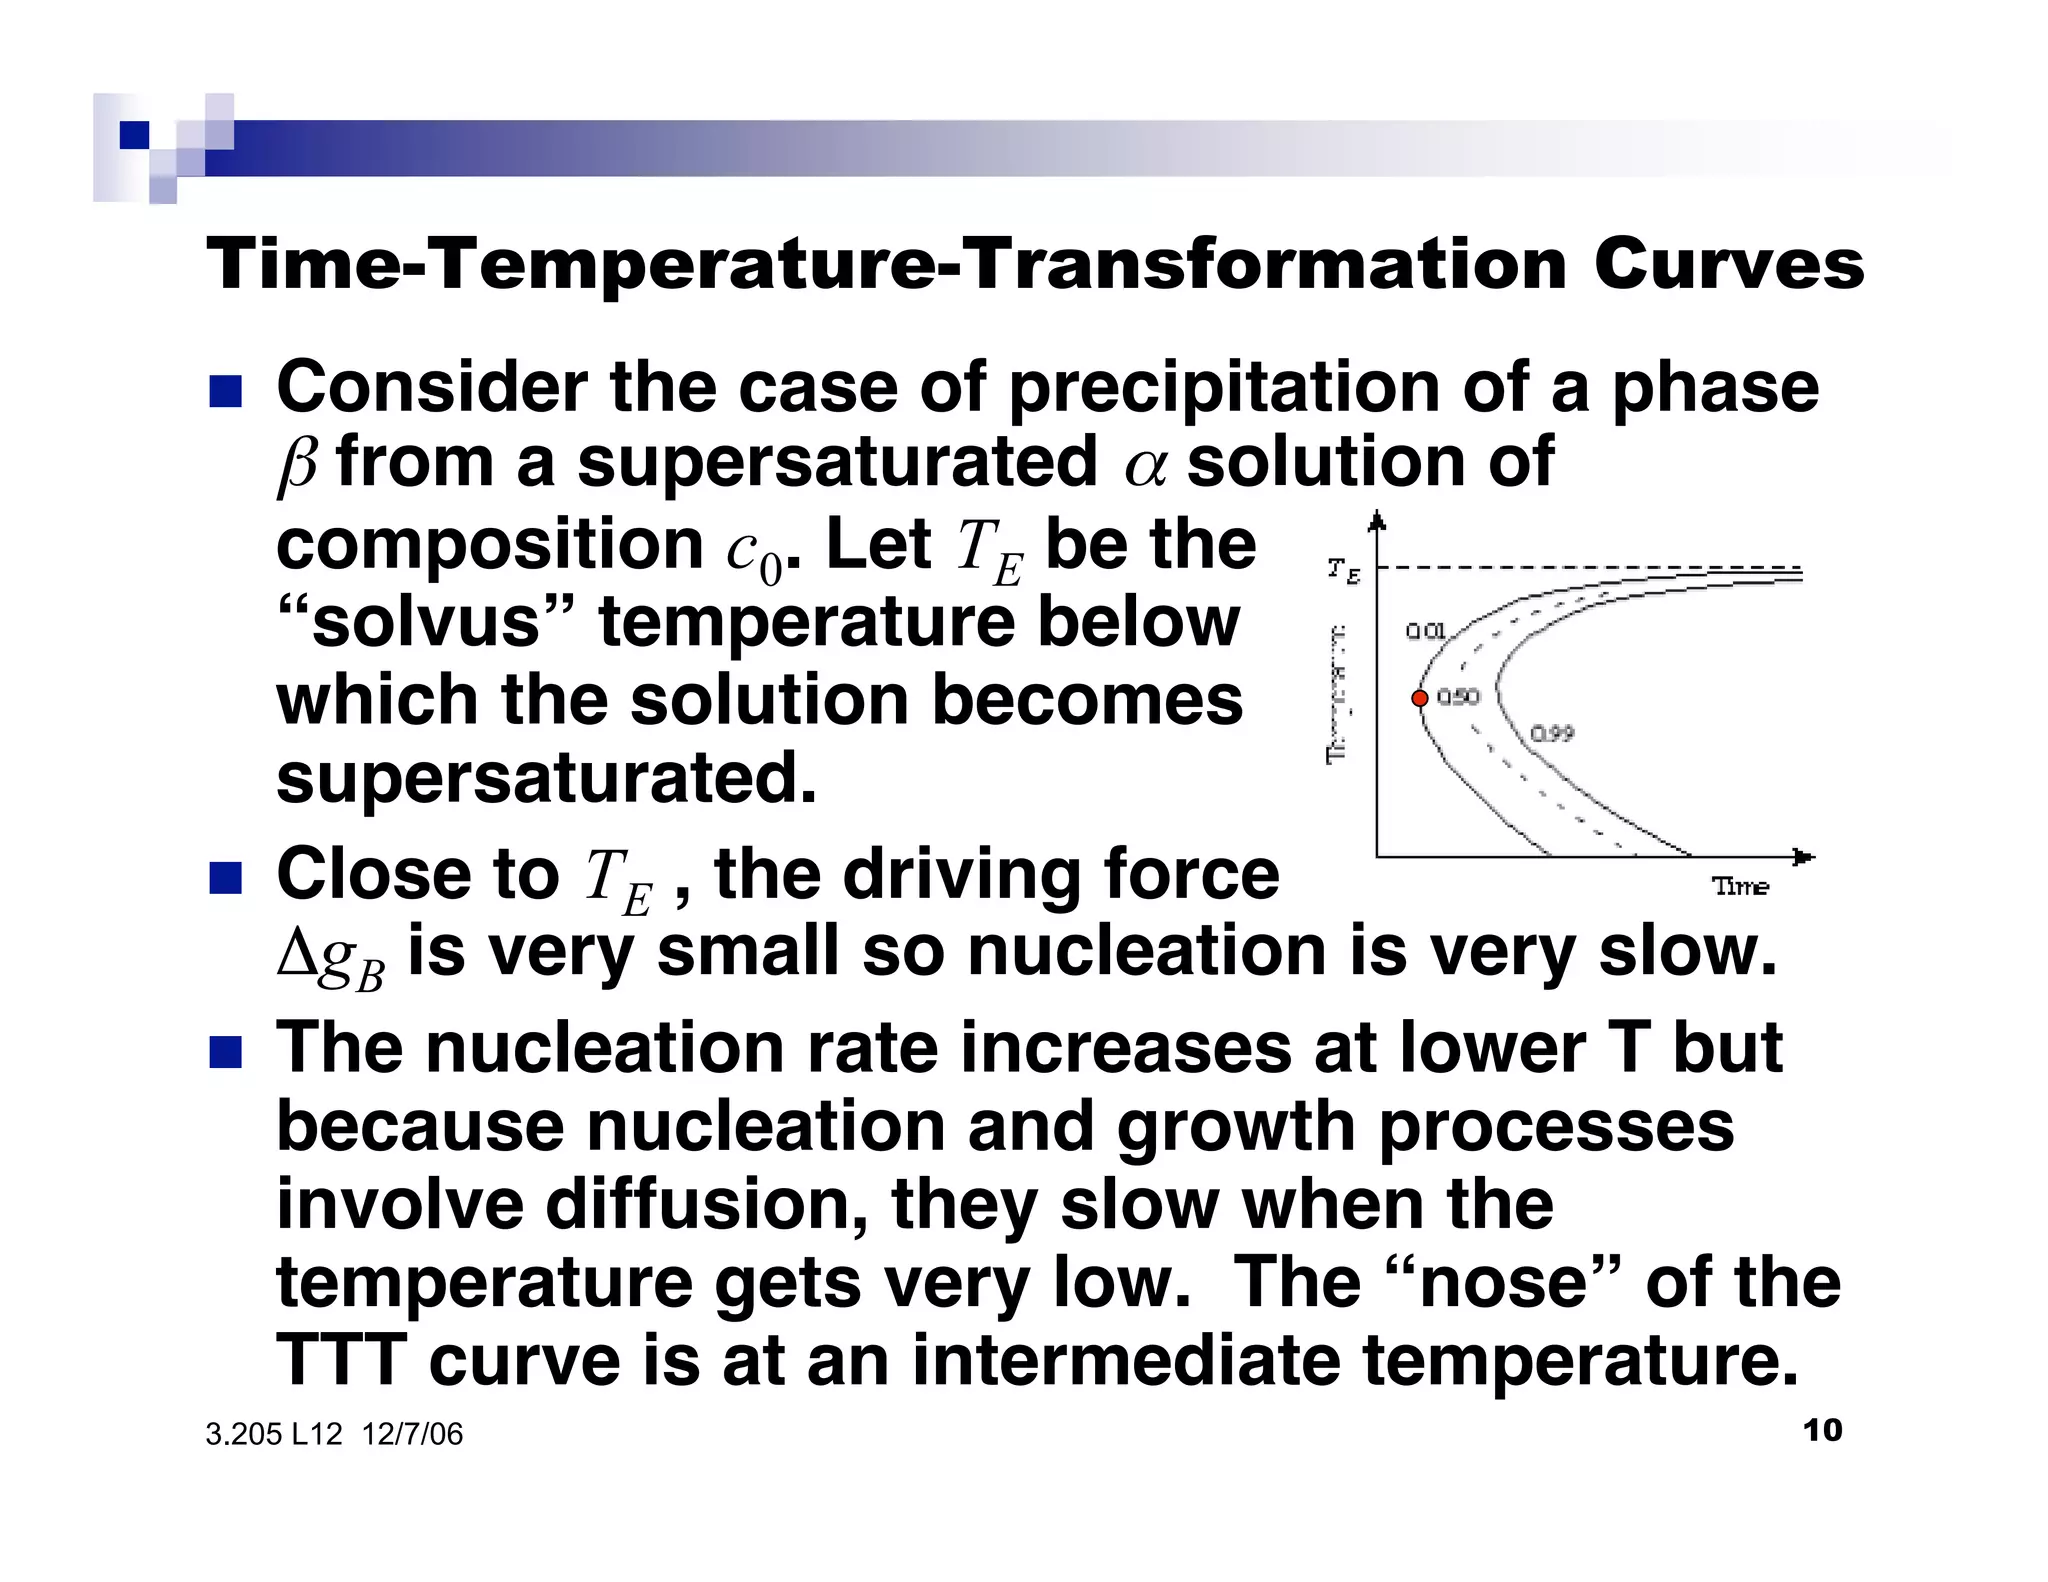

The document discusses phase transformations in materials, focusing on grain growth kinetics in 2D and 3D contexts, and outlines how the velocity of grain growth is influenced by various forces. It also introduces time-temperature-transformation (TTT) curves, which plot transformation kinetics and demonstrate the fastest transformation kinetics at a specific temperature known as the 'nose'. Additionally, it highlights the complexities of 3D grain growth and the factors affecting nucleation rates based on temperature.


