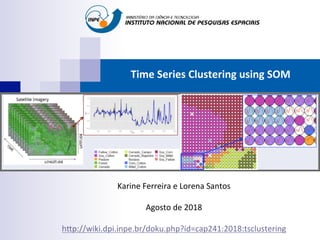
The document discusses time series clustering using self-organizing maps (SOM). It describes how SOM can be used to cluster time series data by organizing input neurons into clusters of similar time series. The output neurons of the SOM represent clusters, with neighboring neurons representing more similar time series. Distance measures like Dynamic Time Warping are commonly used to assess similarity between time series for clustering.
Overview of the state-of-the-art Time Series Clustering based on literature study; distance metrics, prototypes, time-series preprocessing, and clustering algorithms
Survey for recursive neural networks. Including recursive neural network (RNN), recursive autoencoder (RAE), unfolding RAE & dynamic pooling, matrix-vector RNN (MV-RNN), and recursive neural tensor network (RNTN), published by Socher et al.
Hierarchical Clustering | Hierarchical Clustering in R |Hierarchical Clusteri...Simplilearn
This presentation about hierarchical clustering will help you understand what is clustering, what is hierarchical clustering, how does hierarchical clustering work, what is distance measure, what is agglomerative clustering, what is divisive clustering and you will also see a demo on how to group states based on their sales using clustering method. Clustering is the method of dividing the objects into clusters which are similar between them and are dissimilar to the objects belonging to another cluster. It is used to find data clusters such that each cluster has the most closely matched data. Prototype-based clustering, hierarchical clustering, and density-based clustering are the three types of clustering algorithms. Lets us discuss hierarchical clustering in this video. In simple terms, Hierarchical clustering is separating data into different groups based on some measure of similarity.
Below topics are explained in this "Hierarchical Clustering" presentation:
1. What is clustering?
2. What is hierarchical clustering
3. How hierarchical clustering works?
4. Distance measure
5. What is agglomerative clustering
6. What is divisive clustering
7. Demo: to group states based on their sales
Why learn Machine Learning?
Machine Learning is taking over the world- and with that, there is a growing need among companies for professionals to know the ins and outs of Machine Learning
The Machine Learning market size is expected to grow from USD 1.03 Billion in 2016 to USD 8.81 Billion by 2022, at a Compound Annual Growth Rate (CAGR) of 44.1% during the forecast period.
What skills will you learn from this Machine Learning course?
By the end of this Machine Learning course, you will be able to:
1. Master the concepts of supervised, unsupervised and reinforcement learning concepts and modeling.
2. Gain practical mastery over principles, algorithms, and applications of Machine Learning through a hands-on approach which includes working on 28 projects and one capstone project.
3. Acquire thorough knowledge of the mathematical and heuristic aspects of Machine Learning.
4. Understand the concepts and operation of support vector machines, kernel SVM, naive Bayes, decision tree classifier, random forest classifier, logistic regression, K-nearest neighbors, K-means clustering and more.
5. Be able to model a wide variety of robust Machine Learning algorithms including deep learning, clustering, and recommendation systems
We recommend this Machine Learning training course for the following professionals in particular:
1. Developers aspiring to be a data scientist or Machine Learning engineer
2. Information architects who want to gain expertise in Machine Learning algorithms
3. Analytics professionals who want to work in Machine Learning or artificial intelligence
4. Graduates looking to build a career in data science and Machine Learning
Learn more at www.simplilearn.com
A very high-level introduction to scaling out wth Hadoop and NoSQL combined with some experiences on my current project. I gave this presentation at the JFall 2009 conference in the Netherlands
K Means Clustering Algorithm | K Means Clustering Example | Machine Learning ...Simplilearn
This K-Means clustering algorithm presentation will take you through the machine learning introduction, types of clustering algorithms, k-means clustering, how does K-Means clustering work and at least explains K-Means clustering by taking a real life use case. This Machine Learning algorithm tutorial video is ideal for beginners to learn how K-Means clustering work.
Below topics are covered in this K-Means Clustering Algorithm presentation:
1. Types of Machine Learning?
2. What is K-Means Clustering?
3. Applications of K-Means Clustering
4. Common distance measure
5. How does K-Means Clustering work?
6. K-Means Clustering Algorithm
7. Demo: k-Means Clustering
8. Use case: Color compression
- - - - - - - -
About Simplilearn Machine Learning course:
A form of artificial intelligence, Machine Learning is revolutionizing the world of computing as well as all people’s digital interactions. Machine Learning powers such innovative automated technologies as recommendation engines, facial recognition, fraud protection and even self-driving cars.This Machine Learning course prepares engineers, data scientists and other professionals with knowledge and hands-on skills required for certification and job competency in Machine Learning.
- - - - - - -
Why learn Machine Learning?
Machine Learning is taking over the world- and with that, there is a growing need among companies for professionals to know the ins and outs of Machine Learning
The Machine Learning market size is expected to grow from USD 1.03 Billion in 2016 to USD 8.81 Billion by 2022, at a Compound Annual Growth Rate (CAGR) of 44.1% during the forecast period.
- - - - - -
What skills will you learn from this Machine Learning course?
By the end of this Machine Learning course, you will be able to:
1. Master the concepts of supervised, unsupervised and reinforcement learning concepts and modeling.
2. Gain practical mastery over principles, algorithms, and applications of Machine Learning through a hands-on approach which includes working on 28 projects and one capstone project.
3. Acquire thorough knowledge of the mathematical and heuristic aspects of Machine Learning.
4. Understand the concepts and operation of support vector machines, kernel SVM, naive bayes, decision tree classifier, random forest classifier, logistic regression, K-nearest neighbors, K-means clustering and more.
5. Be able to model a wide variety of robust Machine Learning algorithms including deep learning, clustering, and recommendation systems
- - - - - - -
Course "Machine Learning and Data Mining" for the degree of Computer Engineering at the Politecnico di Milano. In in this lecture we overview the mining of data streams
There are two primary forms of data exchange between parallel tasks - accessing a shared data space and exchanging messages.
Platforms that provide a shared data space are called shared-address-space machines or multiprocessors.
Platforms that support messaging are also called message passing platforms or multicomputers.
Support Vector Machine - How Support Vector Machine works | SVM in Machine Le...Simplilearn
This Support Vector Machine (SVM) presentation will help you understand Support Vector Machine algorithm, a supervised machine learning algorithm which can be used for both classification and regression problems. This SVM presentation will help you learn where and when to use SVM algorithm, how does the algorithm work, what are hyperplanes and support vectors in SVM, how distance margin helps in optimizing the hyperplane, kernel functions in SVM for data transformation and advantages of SVM algorithm. At the end, we will also implement Support Vector Machine algorithm in Python to differentiate crocodiles from alligators for a given dataset.
Below topics are explained in this Support Vector Machine presentation:
1. What is Machine Learning?
2. Why support vector machine?
3. What is support vector machine?
4. Understanding support vector machine
5. Advantages of support vector machine
6. Use case in Python
- - - - - - - -
About Simplilearn Machine Learning course:
A form of artificial intelligence, Machine Learning is revolutionizing the world of computing as well as all people’s digital interactions. Machine Learning powers such innovative automated technologies as recommendation engines, facial recognition, fraud protection and even self-driving cars.This Machine Learning course prepares engineers, data scientists and other professionals with knowledge and hands-on skills required for certification and job competency in Machine Learning.
- - - - - - -
Why learn Machine Learning?
Machine Learning is taking over the world- and with that, there is a growing need among companies for professionals to know the ins and outs of Machine Learning
The Machine Learning market size is expected to grow from USD 1.03 Billion in 2016 to USD 8.81 Billion by 2022, at a Compound Annual Growth Rate (CAGR) of 44.1% during the forecast period.
- - - - - -
What skills will you learn from this Machine Learning course?
By the end of this Machine Learning course, you will be able to:
1. Master the concepts of supervised, unsupervised and reinforcement learning concepts and modeling.
2. Gain practical mastery over principles, algorithms, and applications of Machine Learning through a hands-on approach which includes working on 28 projects and one capstone project.
3. Acquire thorough knowledge of the mathematical and heuristic aspects of Machine Learning.
4. Understand the concepts and operation of support vector machines, kernel SVM, Naive Bayes, decision tree classifier, random forest classifier, logistic regression, K-nearest neighbors, K-means clustering and more.
5. Be able to model a wide variety of robust Machine Learning algorithms including deep learning, clustering, and recommendation systems
- - - - - - -
Case-based reasoning (CBR) classifiers use a database of problem solutions to solve
new problems. Unlike nearest-neighbor classifiers, which store training tuples as points
in Euclidean space, CBR stores the tuples or “cases” for problem solving as complex
symbolic descriptions.
Multi Objective Optimization and Pareto Multi Objective Optimization with cas...Aditya Deshpande
This gives basic idea of MOO ie. Multi Objective Optimization and also Pareto graph used for it.
Here i have done Ansys optimization on simple object to elaborate concept of MOO.
Thanks
Aditya D
deshadi805@gmail.com
Efficient initialization for nonnegative matrix factorization based on nonneg...Daichi Kitamura
Daichi Kitamura, Nobutaka Ono, "Efficient initialization for nonnegative matrix factorization based on nonnegative independent component analysis," The 15th International Workshop on Acoustic Signal Enhancement (IWAENC 2016), Xi'an, China, September 2016.
Self-organzing maps in Earth Observation Data Cube AnalysisLorena Santos
Earth Observation (EO) Data Cubes infrastructures model
analysis-ready data generated from remote sensing images as multidimensional cubes (space, time and properties), especially for satellite image time series analysis. These infrastructures take advantage of big data technologies and methods to store, process and analyze the big amount of Earth observation satellite images freely available nowadays. Recently, EO Data Cubes infrastructures and satellite image time series analysis
have brought new opportunities and challenges for the Land Use and Cover Change (LUCC) monitoring over large areas. LUCC have caused a great impact on tropical ecosystems, increasing global greenhouse gases emissions and reducing the planet’s biodiversity. This paper presents the
utility of Self-Organizing Maps (SOM) neural network method in the
process to extract LUCC information from EO Data Cubes infrastructures, using image time series analysis. Most classification techniques to create LUCC maps from satellite image time series are based on supervised learning methods. In this context, SOM is used as a method to assess land use and cover samples and to evaluate which spectral bands and vegetation indexes are best suitable for the separability of land use and cover classes. A case study is described in this work and shows the potential of SOM in this application
A Land Data Assimilation System Utilizing Low Frequency Passive Microwave Rem...drboon
To address the gap in bridging global and smaller modelling scales, downscaling approaches have been reported as an appropriate solution. Downscaling on its own is not wholly adequate in the quest to produce local phenomena, and in this paper we use a physical downscaling method combined with data assimilation strategies, to obtain physically consistent land surface condition prediction. Using data assimilation strategies, it has been demonstrated that by minimizing a cost function, a solution utilizing imperfect models and observation data including observation errors is feasible. We demonstrate that by assimilating lower frequency passive microwave brightness temperature data using a validated theoretical radiative transfer model, we can obtain very good predictions that agree well with observed conditions.
A knowledge-based model for identifying and mapping tropical wetlands and pea...ExternalEvents
This presentation was presented during the 2 Parallel session on Theme 3.1, Managing SOC in: Soils with high SOC – peatlands, permafrost, and black soils, of the Global Symposium on Soil Organic Carbon that took place in Rome 21-23 March 2017. The presentation was made by Mr. Thomas Gumbricht, from Center for International Forestry Research – Indonesia, in FAO Hq, Rome
Contributions of Satellite Images in the Diachronic Study of the Stanley-Pool...INFOGAIN PUBLICATION
With increased population now days, there is a marked change in morphology of the land when it comes the analysis of space images (satellite) using remote sensing. This study covers a sample application of the use of spatial imagery for mapping land cover in the Stanley-Pool (Congo - Brazzaville). The approach used here is based on confrontation of satellite data acquired on different dates (2001-2005). These images were chosen because of realization a demographic growth during this period. The results of this study show a great advance in land occupation which affected the whole of the autonomous port of Brazzaville.
Evaluation of optical and synthetic aperture radar image fusion methods: a ca...IJECEIAES
This paper evaluates different optical and synthetic aperture radar (SAR) image fusion methods applied to open-access Sentinel images with global coverage. The objective of this research was to evaluate the potential of image fusion methods to get a greater visual difference in land cover, especially in oil palm crops with natural forest areas that are difficult to differentiate visually. The application of the image fusion methods: Brovey (BR), high-frequency modulation (HFM), Gram-Schmidt (GS), and principal components (PC) was evaluated on Sentinel-2 optical and Sentinel-1 SAR images using a cloud computing environment. The results show that the application of the implemented optical/SAR image fusion methods allows the creation of a synthetic image with the characteristics of both data sources. The multispectral information provided by the optical image and information associated with the geometry and texture/roughness of the land covers, provided by the SAR image, allows a greater differentiation in the visualization of the various land covers, achieving a better understanding of the study area. The fusion methods that visually presented greater characteristics associated with the SAR image were the BR and GS methods. The HFM method reached the best statistical indicators; however, this method did not present significant visual changes in the SAR contribution.
Summary: The province of Mendoza can administrate water using digital tools that are used for the Science of Earth, and that way to optimize the use of resource, with an intrinsic impact on Economic Science, it is said projections on its productive array. Thus, early development of abilities on this kind of tools that takes part of the so-called Administration 4.0, allows to the professional future of Economic Science and more specifically to the Public Administrators, being more competitive, keeping up online with the new demands that visualize by the digital revolution that are undertaking.
Land use/land cover classification using machine learning modelsIJECEIAES
An ensemble model has been proposed in this work by combining the extreme gradient boosting classification (XGBoost) model with support vector machine (SVM) for land use and land cover classification (LULCC). We have used the multispectral Landsat-8 operational land imager sensor (OLI) data with six spectral bands in the electromagnetic spectrum (EM). The area of study is the administrative boundary of the twin cities of Odisha. Data collected in 2020 is classified into seven land use classes/labels: river, canal, pond, forest, urban, agricultural land, and sand. Comparative assessments of the results of ten machine learning models are accomplished by computing the overall accuracy, kappa coefficient, producer accuracy and user accuracy. An ensemble classifier model makes the classification more precise than the other state-of-the-art machine learning classifiers.
The International Journal of Engineering and Science (The IJES)theijes
The International Journal of Engineering & Science is aimed at providing a platform for researchers, engineers, scientists, or educators to publish their original research results, to exchange new ideas, to disseminate information in innovative designs, engineering experiences and technological skills. It is also the Journal's objective to promote engineering and technology education. All papers submitted to the Journal will be blind peer-reviewed. Only original articles will be published.
Paddy field classification with MODIS-terra multi-temporal image transformati...IJECEIAES
This paper presents the paddy field classification model using the approach based on periodic plant life cycle events and how these elevations in climate as well as habitat factors, such as elevation. The data used are MODIS-Terra two tiles of H28v09 and H29v09 of 2016, consist of 46 series of 8-daily data, with 500 meter resolution in Java region. The paddy field classification method based on the phenological model is done by Maximum Likelihood on the transformed annual multi-temporal image of the reflectance data, index data, and the combination of reflectance and index data. The results of the study showed that, with the reference of the Paddy Field Map from the Ministry of Agriculture (MoA), the overall accuracies of the paddy field classification results using the combination of reflectance and index data provide the highest (85.4%) among the reflectance data (83.5%) and index data (81.7%). The accuracy levels were varied; these depend on the slope and the types of paddy fields. Paddy fields on the slopes of 0-2% could be well identified by MODIS-Terra data, whereas it was difficult to identify the paddy fields on the slope >2%. Rain-fed lowland paddy field type has a lower user accuracy than irrigated paddy fields. This study also performed correlation (r2) between the analysis results and the statistical data based on district and provincial boundaries were >0.85 and >0.99 respectively. These correlations were much higher than the previous study results, which reached 0.49-0.65 (hilly-flat areas of county-level), and 0.80-0.88 (hilly-flat areas of provincial level) for China, and reached 0.44 for Indonesia.
Using Remote Sensing Techniques For Monitoring Ecological Changes In Lakes: C...IJERA Editor
The ability to use remote sensing in studying lake ecology lies in the capability of satellite sensors to measure
the spectral reflectance of constituents in water bodies. This reflectance can be used to determine the
concentration of the constituents of the water column through mathematical relationships. This work identified a
simple linear equation for estimating suspended matter in Lake Naivasha with reflectance in Landsat7 ETM+
image. A R² = 0.94, n = 6 for suspended matter was obtained. Archive of Landsat imagery was used to
produce maps of suspended matter concentrations in the lake. The suspended matter concentrations at five
different locations in the lake over 30 year’s period were then estimated. It was therefore concluded that the
ecological changes Lake Naivasha is experiencing is the result of the high water abstraction and the effect of
climate change.
Opendatabay - Open Data Marketplace.pptxOpendatabay
Opendatabay.com unlocks the power of data for everyone. Open Data Marketplace fosters a collaborative hub for data enthusiasts to explore, share, and contribute to a vast collection of datasets.
First ever open hub for data enthusiasts to collaborate and innovate. A platform to explore, share, and contribute to a vast collection of datasets. Through robust quality control and innovative technologies like blockchain verification, opendatabay ensures the authenticity and reliability of datasets, empowering users to make data-driven decisions with confidence. Leverage cutting-edge AI technologies to enhance the data exploration, analysis, and discovery experience.
From intelligent search and recommendations to automated data productisation and quotation, Opendatabay AI-driven features streamline the data workflow. Finding the data you need shouldn't be a complex. Opendatabay simplifies the data acquisition process with an intuitive interface and robust search tools. Effortlessly explore, discover, and access the data you need, allowing you to focus on extracting valuable insights. Opendatabay breaks new ground with a dedicated, AI-generated, synthetic datasets.
Leverage these privacy-preserving datasets for training and testing AI models without compromising sensitive information. Opendatabay prioritizes transparency by providing detailed metadata, provenance information, and usage guidelines for each dataset, ensuring users have a comprehensive understanding of the data they're working with. By leveraging a powerful combination of distributed ledger technology and rigorous third-party audits Opendatabay ensures the authenticity and reliability of every dataset. Security is at the core of Opendatabay. Marketplace implements stringent security measures, including encryption, access controls, and regular vulnerability assessments, to safeguard your data and protect your privacy.
Levelwise PageRank with Loop-Based Dead End Handling Strategy : SHORT REPORT ...Subhajit Sahu
Abstract — Levelwise PageRank is an alternative method of PageRank computation which decomposes the input graph into a directed acyclic block-graph of strongly connected components, and processes them in topological order, one level at a time. This enables calculation for ranks in a distributed fashion without per-iteration communication, unlike the standard method where all vertices are processed in each iteration. It however comes with a precondition of the absence of dead ends in the input graph. Here, the native non-distributed performance of Levelwise PageRank was compared against Monolithic PageRank on a CPU as well as a GPU. To ensure a fair comparison, Monolithic PageRank was also performed on a graph where vertices were split by components. Results indicate that Levelwise PageRank is about as fast as Monolithic PageRank on the CPU, but quite a bit slower on the GPU. Slowdown on the GPU is likely caused by a large submission of small workloads, and expected to be non-issue when the computation is performed on massive graphs.
Data Centers - Striving Within A Narrow Range - Research Report - MCG - May 2...pchutichetpong
M Capital Group (“MCG”) expects to see demand and the changing evolution of supply, facilitated through institutional investment rotation out of offices and into work from home (“WFH”), while the ever-expanding need for data storage as global internet usage expands, with experts predicting 5.3 billion users by 2023. These market factors will be underpinned by technological changes, such as progressing cloud services and edge sites, allowing the industry to see strong expected annual growth of 13% over the next 4 years.
Whilst competitive headwinds remain, represented through the recent second bankruptcy filing of Sungard, which blames “COVID-19 and other macroeconomic trends including delayed customer spending decisions, insourcing and reductions in IT spending, energy inflation and reduction in demand for certain services”, the industry has seen key adjustments, where MCG believes that engineering cost management and technological innovation will be paramount to success.
MCG reports that the more favorable market conditions expected over the next few years, helped by the winding down of pandemic restrictions and a hybrid working environment will be driving market momentum forward. The continuous injection of capital by alternative investment firms, as well as the growing infrastructural investment from cloud service providers and social media companies, whose revenues are expected to grow over 3.6x larger by value in 2026, will likely help propel center provision and innovation. These factors paint a promising picture for the industry players that offset rising input costs and adapt to new technologies.
According to M Capital Group: “Specifically, the long-term cost-saving opportunities available from the rise of remote managing will likely aid value growth for the industry. Through margin optimization and further availability of capital for reinvestment, strong players will maintain their competitive foothold, while weaker players exit the market to balance supply and demand.”
Explore our comprehensive data analysis project presentation on predicting product ad campaign performance. Learn how data-driven insights can optimize your marketing strategies and enhance campaign effectiveness. Perfect for professionals and students looking to understand the power of data analysis in advertising. for more details visit: https://bostoninstituteofanalytics.org/data-science-and-artificial-intelligence/