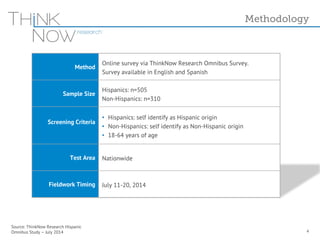
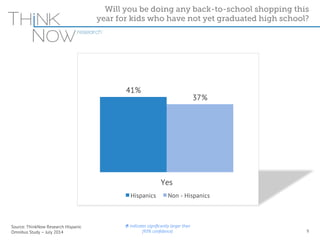
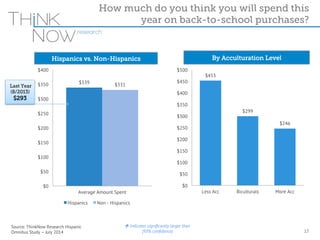
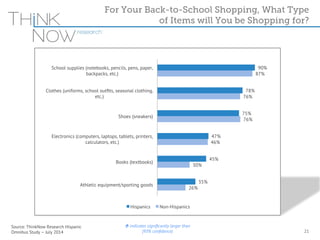
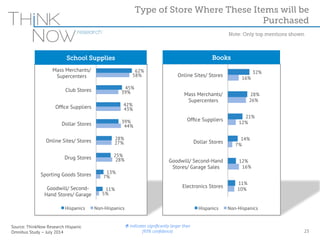
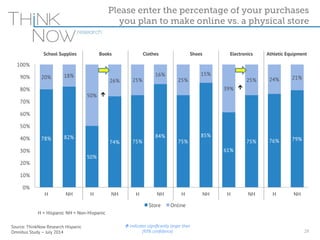
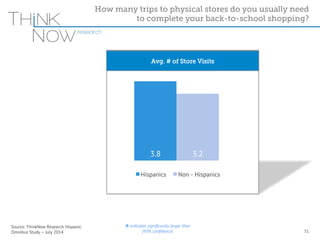
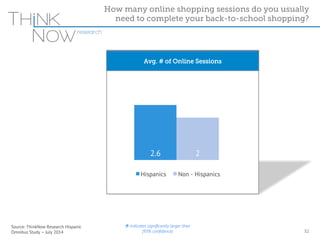
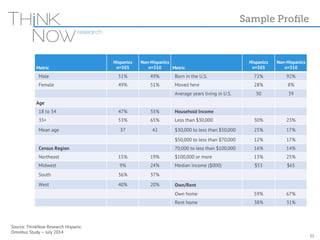
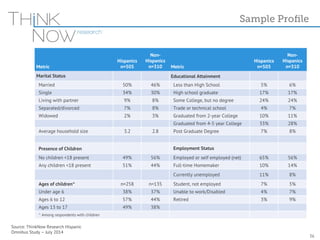
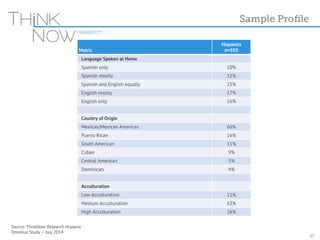
Understanding Hispanics’ 
July 2014 
Back-to-School Shopping Behavior
Source: ThinkNow Research Hispanic 
Omnibus Study – July 2014 
Outline 
2 
Methodology 
Key Findings 
Detailed Findings 
Appendix
Methodology
Method Online survey via ThinkNow Research Omnibus Survey. 
Source: ThinkNow Research Hispanic 
Omnibus Study – July 2014 
Survey available in English and Spanish 
Sample Size Hispanics: n=505 
Non-Hispanics: n=310 
Screening Criteria 
• Hispanics: self identify as Hispanic origin 
• Non-Hispanics: self identify as Non-Hispanic origin 
• 18-64 years of age 
Test Area Nationwide 
Fieldwork Timing July 11-20, 2014 
Methodology 
4
Key Findings
• Approximately 4-in-10 Hispanic adults have started to or are 
planning on shopping for back-to-school items this year. This is 
slightly higher than non-Hispanic adults (37%). 
• The back-to-school shopping season for most Hispanic parents (as 
well as non-Hispanic) begins in July and end in August. 
• On average, Hispanic parents shop for more children compared to 
non-Hispanics (2 vs. 1.5) 
• Hispanics will spend an average of $340 this back-to-school 
season which is higher than last year ($293). 
Source: ThinkNow Research Hispanic 
Omnibus Study – July 2014 
Key Findings, 1 
6
• General school supplies (notebooks, paper, pencils, etc.) are the most 
common items purchased by parents, followed by clothing and shoes. 
• Most back-to-school items are purchased in-person at retailer stores. 
For books and electronics, Hispanics are more likely to shop for these 
online compared to non-Hispanics. 
• Mass merchants such as Walmart and Target are the most popular 
retailers for the purchase of general back-to-school supplies, as well 
clothing and shoes. 
• As Hispanics have more children to shop for compared to non- 
Hispanics, they make more trips to the store to buy back-to-school 
items and have more online sessions as well. 
Source: ThinkNow Research Hispanic 
Omnibus Study – July 2014 
Key Findings, 2 
7
Detailed Findings
Source: ThinkNow Research Hispanic 
Omnibus Study – July 2014 
Will you be doing any back-to-school shopping this 
year for kids who have not yet graduated high school? 
9 
41% 
37% 
Yes 
Hispanics Non - Hispanics 
Û indicates significantly larger than 
(95% confidence)
Approximately 4-in-10 Hispanic 
adults have started to or are planning 
on shopping for back-to-school items 
this year. This is slightly higher than 
non-Hispanics. 
10
3% 
100% 
90% 
80% 
70% 
60% 
50% 
40% 
30% 
20% 
10% 
Source: ThinkNow Research Hispanic 
Omnibus Study – July 2014 
61% 
When did you or will you Start 
Your Back-to-School Shopping? 
34% 
62% 
37% 
0% 2% 
0% 1% 
Hispanics Non-Hispanics 
11 
June 2014 July 2014 August 2014 September 2014 
Û indicates significantly larger than 
(95% confidence)
12 
July is the start of the back-to-school 
shopping season for most parents.
1% 
100% 
90% 
80% 
70% 
60% 
50% 
40% 
30% 
20% 
10% 
Source: ThinkNow Research Hispanic 
Omnibus Study – July 2014 
38% 
When did you or will you Finish 
Your Back-to-School Shopping? 
53% 
8% 
0% 
34% 
59% 
7% 
0% 
Hispanics Non-Hispanics 
13 
June 2014 July 2014 August 2014 September 2014 
Û indicates significantly larger than 
(95% confidence)
14 
While most of the shopping is done 
by August, a significant portion is 
finished by July.
How many children that have not yet graduated 
Source: ThinkNow Research Hispanic 
Omnibus Study – July 2014 
high school will you be shopping for? 
1.9 
1.5 
Hispanic Non-Hispanic 
Û indicates significantly larger than 
(95% confidence)
As Hispanics have larger households 
than non-Hispanics, they shop for 
more children on average. 
16
$339 $331 
$400 
$350 
$300 
$250 
$200 
$150 
$100 
$50 
$0 
Average Amount Spent 
Hispanics Non - Hispanics 
Source: ThinkNow Research Hispanic 
Omnibus Study – July 2014 
How much do you think you will spend this 
year on back-to-school purchases? 
17 
Hispanics vs. Non-Hispanics By Acculturation Level 
Last Year 
(8/2013) 
$293 
$453 
$299 
$246 
$500 
$450 
$400 
$350 
$300 
$250 
$200 
$150 
$100 
$50 
$0 
Less Acc Biculturals More Acc 
Û indicates significantly larger than 
(95% confidence)
Hispanics will spend an average of 
$340 this back-to-school season 
which is higher than one year ago. 
The Less Acculturated segment will 
spend the most overall. 
18
Source: ThinkNow Research Hispanic 
Omnibus Study – July 2014 
Overall, do you think you will spend more or less on back-to-school 
shopping compared to what you spent last year? 
19 19 
2% 1% 
20% 18% 
30% 37% 
48% 45% 
Hispanics Non-Hispanics 
Did not shop for back-to-school 
items last year / 
does not apply 
Will spend LESS 
About the same 
Will spend MORE 
Planning to Use 
Layaway Service 
Û indicates significantly larger than 
(95% confidence) 
26% 26% 
Hispanics Non - Hispanics
Nearly half of Hispanics and non- 
Hispanics say they will be spending more 
on back-to-school supplies compared to 
last year and about one-quarter will use 
layaway - the same as one year ago.
Source: ThinkNow Research Hispanic 
Omnibus Study – July 2014 
For Your Back-to-School Shopping, What Type 
of Items will You be Shopping for? 
90% 
78% 
75% 
47% 
45% 
35% 
87% 
76% 
76% 
46% 
30% 
26% 
School supplies (notebooks, pencils, pens, paper, 
backpacks, etc.) 
Clothes (uniforms, school outfits, seasonal clothing, 
etc.) 
Shoes (sneakers) 
Electronics (computers, laptops, tablets, printers, 
calculators, etc.) 
Books (textbooks) 
Athletic equipment/sporting goods 
Hispanics Non-Hispanics 
21 
Û indicates significantly larger than 
(95% confidence)
General school supplies are the most 
common items purchased, followed by 
clothes. Hispanics are significantly more 
likely to buy textbooks for back-to-school 
compared to non-Hispanics. 
22
Source: ThinkNow Research Hispanic 
Omnibus Study – July 2014 
62% 
45% 
42% 
39% 
28% 
25% 
13% 
11% 
58% 
39% 
43% 
44% 
27% 
28% 
7% 
5% 
Mass Merchants/ 
Supercenters 
Club Stores 
Office Suppliers 
Dollar Stores 
Online Sites/ Stores 
Drug Stores 
Sporting Goods Stores 
Goodwill/ Second- 
Hand Stores/ Garage 
Hispanics Non-Hispanics 
Type of Store Where These Items will be 
Purchased 
23 
School Supplies Books 
32% 
16% 
28% 
21% 
14% 
12% 
11% 
26% 
12% 
7% 
16% 
10% 
Online Sites/ Stores 
Mass Merchants/ 
Supercenters 
Office Suppliers 
Dollar Stores 
Goodwill/ Second-Hand 
Stores/ Garage Sales 
Electronics Stores 
Hispanics Non-Hispanics 
Û indicates significantly larger than 
(95% confidence) 
Note: Only top mentions shown
Hispanics and non-Hispanics are 
most likely to buy general school 
supplies at mass merchants such as 
Walmart and Target. 
24
Source: ThinkNow Research Hispanic 
Omnibus Study – July 2014 
53% 
53% 
49% 
25% 
23% 
17% 
13% 
12% 
46% 
33% 
50% 
20% 
16% 
12% 
13% 
11% 
Apparel Stores 
Department Stores 
Mass Merchants/ 
Supercenters 
Online Sites/ Stores 
Goodwill/ Second- 
Hand Stores/ Garage 
Club Stores 
Sporting Goods Stores 
Dollar Stores 
Hispanics Non-Hispanics 
Type of Store Where These Items 
will be Purchased 
25 
Clothes Shoes 
43% 
38% 
30% 
28% 
26% 
14% 
14% 
39% 
44% 
21% 
17% 
17% 
9% 
9% 
Department Stores 
Mass Merchants/ 
Supercenters 
Apparel Stores 
Sporting Goods Stores 
Online Sites/ Stores 
Club Stores 
Goodwill/ Second- 
Hand Stores/ Garage 
Sales 
Hispanics Non-Hispanics 
Û indicates significantly larger than 
(95% confidence) 
Note: Only top mentions shown
Apparel stores, Departments stores and 
Mass merchants are the most popular 
retailers for back-to-school clothes 
and shoes. 
26
Source: ThinkNow Research Hispanic 
Omnibus Study – July 2014 
35% 
28% 
22% 
16% 
15% 
11% 
32% 
15% 
20% 
10% 
15% 
12% 
Electronics Stores 
Online Sites/ Stores 
Mass Merchants/ 
Supercenters 
Office Suppliers 
Club Stores 
Goodwill/ Second- 
Hand Stores/ 
Garage Sales 
Hispanics Non-Hispanics 
Type of Store Where These Items 
will be Purchased 
Note: Only top mentions shown 
27 
Electronics Athletic Equipment 
30% 
20% 
19% 
11% 
11% 
29% 
25% 
15% 
9% 
4% 
Sporting Goods Stores 
Mass Merchants/ 
Supercenters 
Online Sites/ Stores 
Apparel Stores 
Club Stores 
Hispanics Non-Hispanics 
Û indicates significantly larger than 
(95% confidence)
Hispanics are significantly more likely to 
shop for electronics online compared to 
non-Hispanics. 
28
Please enter the percentage of your purchases 
you plan to make online vs. a physical store 
School Supplies Books Clothes Shoes Electronics Athletic Equipment 
78% 82% 
100% 
90% 
80% 
70% 
60% 
50% 
40% 
30% 
20% 
10% 
Source: ThinkNow Research Hispanic 
Omnibus Study – July 2014 
50% 
74% 75% 
84% 
75% 
85% 
61% 
75% 76% 79% 
20% 18% 
50% 
26% 25% 
16% 
25% 
15% 
39% 
25% 24% 21% 
0% 
Û 
H NH H NH H NH H NH H NH H NH 
Store Online 
29 
H = Hispanic NH = Non-Hispanic 
Û 
Û indicates significantly larger than 
(95% confidence)
Most back-to-school items are 
purchased in-person. For books and 
electronics, however, Hispanics are 
more likely to shop for these online 
compared to Non-Hispanics. 
30
Source: ThinkNow Research Hispanic 
Omnibus Study – July 2014 
How many trips to physical stores do you usually need 
to complete your back-to-school shopping? 
Avg. # of Store Visits 
3.8 3.2 
Hispanics Non - Hispanics 
Û indicates significantly larger than 
(95% confidence) 31
Source: ThinkNow Research Hispanic 
Omnibus Study – July 2014 
How many online shopping sessions do you usually 
need to complete your back-to-school shopping? 
Avg. # of Online Sessions 
2.6 2 
Hispanics Non - Hispanics 
Û indicates significantly larger than 
(95% confidence) 32
As Hispanics are shopping for more 
children, they tend to make more store 
visits and have more online sessions 
when buying back-to-school supplies. 
33
Appendix
Metric 
Source: ThinkNow Research Hispanic 
Omnibus Study – July 2014 
Hispanics 
n=505 
Non-Hispanics 
n=310 Metric 
Sample Profile 
Hispanics 
n=505 
Non-Hispanics 
n=310 
Male 51% 49% Born in the U.S. 72% 92% 
Female 49% 51% Moved here 28% 8% 
Average years living in U.S. 30 39 
Age 
18 to 34 47% 35% Household Income 
35+ 53% 65% Less than $30,000 30% 23% 
Mean age 37 42 $30,000 to less than $50,000 25% 17% 
$50,000 to less than $70,000 12% 17% 
Census Region 70,000 to less than $100,000 16% 14% 
Northeast 15% 19% $100,000 or more 13% 25% 
Midwest 9% 24% Median income ($000) $53 $65 
South 36% 37% 
West 40% 20% Own/Rent 
Own home 59% 67% 
Rent home 38% 31% 
35
Metric 
Source: ThinkNow Research Hispanic 
Omnibus Study – July 2014 
Hispanics 
n=505 
Non- 
Hispanics 
n=310 Metric 
Sample Profile 
Hispanics 
n=505 
Non- 
Hispanics 
n=310 
Marital Status Educational Attainment 
Married 50% 46% Less than High School 5% 6% 
Single 34% 30% High school graduate 17% 17% 
Living with partner 9% 8% Some College, but no degree 24% 24% 
Separated/divorced 7% 8% Trade or technical school 4% 7% 
Widowed 2% 3% Graduated from 2-year College 10% 11% 
Graduated from 4-5 year College 33% 28% 
Average household size 3.2 2.8 Post Graduate Degree 7% 8% 
Presence of Children Employment Status 
No children <18 present 49% 56% Employed or self employed (net) 65% 56% 
Any children <18 present 51% 44% Full-time Homemaker 10% 14% 
Currently unemployed 11% 8% 
Ages of children^ n=258 n=135 Student, not employed 7% 5% 
Under age 6 38% 37% Unable to work/Disabled 4% 7% 
Ages 6 to 12 57% 44% Retired 3% 9% 
Ages 13 to 17 49% 38% 
^ Among respondents with children 
36
Metric 
Source: ThinkNow Research Hispanic 
Omnibus Study – July 2014 
Hispanics 
n=505 
Language Spoken at Home 
Spanish only 10% 
Spanish mostly 32% 
Spanish and English equally 25% 
English mostly 17% 
English only 16% 
Country of Origin 
Mexican/Mexican American 60% 
Puerto Rican 16% 
South American 11% 
Cuban 9% 
Central American 5% 
Dominican 4% 
Acculturation 
Low Acculturation 11% 
Medium Acculturation 63% 
High Acculturation 26% 
Sample Profile 
37

ThinkNow Research - Understanding Hispanics' Back-to-School Shopping Behavior

  • 1.
    Understanding Hispanics’ July2014 Back-to-School Shopping Behavior
  • 2.
    Source: ThinkNow ResearchHispanic Omnibus Study – July 2014 Outline 2 Methodology Key Findings Detailed Findings Appendix
  • 3.
  • 4.
    Method Online surveyvia ThinkNow Research Omnibus Survey. Source: ThinkNow Research Hispanic Omnibus Study – July 2014 Survey available in English and Spanish Sample Size Hispanics: n=505 Non-Hispanics: n=310 Screening Criteria • Hispanics: self identify as Hispanic origin • Non-Hispanics: self identify as Non-Hispanic origin • 18-64 years of age Test Area Nationwide Fieldwork Timing July 11-20, 2014 Methodology 4
  • 5.
  • 6.
    • Approximately 4-in-10Hispanic adults have started to or are planning on shopping for back-to-school items this year. This is slightly higher than non-Hispanic adults (37%). • The back-to-school shopping season for most Hispanic parents (as well as non-Hispanic) begins in July and end in August. • On average, Hispanic parents shop for more children compared to non-Hispanics (2 vs. 1.5) • Hispanics will spend an average of $340 this back-to-school season which is higher than last year ($293). Source: ThinkNow Research Hispanic Omnibus Study – July 2014 Key Findings, 1 6
  • 7.
    • General schoolsupplies (notebooks, paper, pencils, etc.) are the most common items purchased by parents, followed by clothing and shoes. • Most back-to-school items are purchased in-person at retailer stores. For books and electronics, Hispanics are more likely to shop for these online compared to non-Hispanics. • Mass merchants such as Walmart and Target are the most popular retailers for the purchase of general back-to-school supplies, as well clothing and shoes. • As Hispanics have more children to shop for compared to non- Hispanics, they make more trips to the store to buy back-to-school items and have more online sessions as well. Source: ThinkNow Research Hispanic Omnibus Study – July 2014 Key Findings, 2 7
  • 8.
  • 9.
    Source: ThinkNow ResearchHispanic Omnibus Study – July 2014 Will you be doing any back-to-school shopping this year for kids who have not yet graduated high school? 9 41% 37% Yes Hispanics Non - Hispanics Û indicates significantly larger than (95% confidence)
  • 10.
    Approximately 4-in-10 Hispanic adults have started to or are planning on shopping for back-to-school items this year. This is slightly higher than non-Hispanics. 10
  • 11.
    3% 100% 90% 80% 70% 60% 50% 40% 30% 20% 10% Source: ThinkNow Research Hispanic Omnibus Study – July 2014 61% When did you or will you Start Your Back-to-School Shopping? 34% 62% 37% 0% 2% 0% 1% Hispanics Non-Hispanics 11 June 2014 July 2014 August 2014 September 2014 Û indicates significantly larger than (95% confidence)
  • 12.
    12 July isthe start of the back-to-school shopping season for most parents.
  • 13.
    1% 100% 90% 80% 70% 60% 50% 40% 30% 20% 10% Source: ThinkNow Research Hispanic Omnibus Study – July 2014 38% When did you or will you Finish Your Back-to-School Shopping? 53% 8% 0% 34% 59% 7% 0% Hispanics Non-Hispanics 13 June 2014 July 2014 August 2014 September 2014 Û indicates significantly larger than (95% confidence)
  • 14.
    14 While mostof the shopping is done by August, a significant portion is finished by July.
  • 15.
    How many childrenthat have not yet graduated Source: ThinkNow Research Hispanic Omnibus Study – July 2014 high school will you be shopping for? 1.9 1.5 Hispanic Non-Hispanic Û indicates significantly larger than (95% confidence)
  • 16.
    As Hispanics havelarger households than non-Hispanics, they shop for more children on average. 16
  • 17.
    $339 $331 $400 $350 $300 $250 $200 $150 $100 $50 $0 Average Amount Spent Hispanics Non - Hispanics Source: ThinkNow Research Hispanic Omnibus Study – July 2014 How much do you think you will spend this year on back-to-school purchases? 17 Hispanics vs. Non-Hispanics By Acculturation Level Last Year (8/2013) $293 $453 $299 $246 $500 $450 $400 $350 $300 $250 $200 $150 $100 $50 $0 Less Acc Biculturals More Acc Û indicates significantly larger than (95% confidence)
  • 18.
    Hispanics will spendan average of $340 this back-to-school season which is higher than one year ago. The Less Acculturated segment will spend the most overall. 18
  • 19.
    Source: ThinkNow ResearchHispanic Omnibus Study – July 2014 Overall, do you think you will spend more or less on back-to-school shopping compared to what you spent last year? 19 19 2% 1% 20% 18% 30% 37% 48% 45% Hispanics Non-Hispanics Did not shop for back-to-school items last year / does not apply Will spend LESS About the same Will spend MORE Planning to Use Layaway Service Û indicates significantly larger than (95% confidence) 26% 26% Hispanics Non - Hispanics
  • 20.
    Nearly half ofHispanics and non- Hispanics say they will be spending more on back-to-school supplies compared to last year and about one-quarter will use layaway - the same as one year ago.
  • 21.
    Source: ThinkNow ResearchHispanic Omnibus Study – July 2014 For Your Back-to-School Shopping, What Type of Items will You be Shopping for? 90% 78% 75% 47% 45% 35% 87% 76% 76% 46% 30% 26% School supplies (notebooks, pencils, pens, paper, backpacks, etc.) Clothes (uniforms, school outfits, seasonal clothing, etc.) Shoes (sneakers) Electronics (computers, laptops, tablets, printers, calculators, etc.) Books (textbooks) Athletic equipment/sporting goods Hispanics Non-Hispanics 21 Û indicates significantly larger than (95% confidence)
  • 22.
    General school suppliesare the most common items purchased, followed by clothes. Hispanics are significantly more likely to buy textbooks for back-to-school compared to non-Hispanics. 22
  • 23.
    Source: ThinkNow ResearchHispanic Omnibus Study – July 2014 62% 45% 42% 39% 28% 25% 13% 11% 58% 39% 43% 44% 27% 28% 7% 5% Mass Merchants/ Supercenters Club Stores Office Suppliers Dollar Stores Online Sites/ Stores Drug Stores Sporting Goods Stores Goodwill/ Second- Hand Stores/ Garage Hispanics Non-Hispanics Type of Store Where These Items will be Purchased 23 School Supplies Books 32% 16% 28% 21% 14% 12% 11% 26% 12% 7% 16% 10% Online Sites/ Stores Mass Merchants/ Supercenters Office Suppliers Dollar Stores Goodwill/ Second-Hand Stores/ Garage Sales Electronics Stores Hispanics Non-Hispanics Û indicates significantly larger than (95% confidence) Note: Only top mentions shown
  • 24.
    Hispanics and non-Hispanicsare most likely to buy general school supplies at mass merchants such as Walmart and Target. 24
  • 25.
    Source: ThinkNow ResearchHispanic Omnibus Study – July 2014 53% 53% 49% 25% 23% 17% 13% 12% 46% 33% 50% 20% 16% 12% 13% 11% Apparel Stores Department Stores Mass Merchants/ Supercenters Online Sites/ Stores Goodwill/ Second- Hand Stores/ Garage Club Stores Sporting Goods Stores Dollar Stores Hispanics Non-Hispanics Type of Store Where These Items will be Purchased 25 Clothes Shoes 43% 38% 30% 28% 26% 14% 14% 39% 44% 21% 17% 17% 9% 9% Department Stores Mass Merchants/ Supercenters Apparel Stores Sporting Goods Stores Online Sites/ Stores Club Stores Goodwill/ Second- Hand Stores/ Garage Sales Hispanics Non-Hispanics Û indicates significantly larger than (95% confidence) Note: Only top mentions shown
  • 26.
    Apparel stores, Departmentsstores and Mass merchants are the most popular retailers for back-to-school clothes and shoes. 26
  • 27.
    Source: ThinkNow ResearchHispanic Omnibus Study – July 2014 35% 28% 22% 16% 15% 11% 32% 15% 20% 10% 15% 12% Electronics Stores Online Sites/ Stores Mass Merchants/ Supercenters Office Suppliers Club Stores Goodwill/ Second- Hand Stores/ Garage Sales Hispanics Non-Hispanics Type of Store Where These Items will be Purchased Note: Only top mentions shown 27 Electronics Athletic Equipment 30% 20% 19% 11% 11% 29% 25% 15% 9% 4% Sporting Goods Stores Mass Merchants/ Supercenters Online Sites/ Stores Apparel Stores Club Stores Hispanics Non-Hispanics Û indicates significantly larger than (95% confidence)
  • 28.
    Hispanics are significantlymore likely to shop for electronics online compared to non-Hispanics. 28
  • 29.
    Please enter thepercentage of your purchases you plan to make online vs. a physical store School Supplies Books Clothes Shoes Electronics Athletic Equipment 78% 82% 100% 90% 80% 70% 60% 50% 40% 30% 20% 10% Source: ThinkNow Research Hispanic Omnibus Study – July 2014 50% 74% 75% 84% 75% 85% 61% 75% 76% 79% 20% 18% 50% 26% 25% 16% 25% 15% 39% 25% 24% 21% 0% Û H NH H NH H NH H NH H NH H NH Store Online 29 H = Hispanic NH = Non-Hispanic Û Û indicates significantly larger than (95% confidence)
  • 30.
    Most back-to-school itemsare purchased in-person. For books and electronics, however, Hispanics are more likely to shop for these online compared to Non-Hispanics. 30
  • 31.
    Source: ThinkNow ResearchHispanic Omnibus Study – July 2014 How many trips to physical stores do you usually need to complete your back-to-school shopping? Avg. # of Store Visits 3.8 3.2 Hispanics Non - Hispanics Û indicates significantly larger than (95% confidence) 31
  • 32.
    Source: ThinkNow ResearchHispanic Omnibus Study – July 2014 How many online shopping sessions do you usually need to complete your back-to-school shopping? Avg. # of Online Sessions 2.6 2 Hispanics Non - Hispanics Û indicates significantly larger than (95% confidence) 32
  • 33.
    As Hispanics areshopping for more children, they tend to make more store visits and have more online sessions when buying back-to-school supplies. 33
  • 34.
  • 35.
    Metric Source: ThinkNowResearch Hispanic Omnibus Study – July 2014 Hispanics n=505 Non-Hispanics n=310 Metric Sample Profile Hispanics n=505 Non-Hispanics n=310 Male 51% 49% Born in the U.S. 72% 92% Female 49% 51% Moved here 28% 8% Average years living in U.S. 30 39 Age 18 to 34 47% 35% Household Income 35+ 53% 65% Less than $30,000 30% 23% Mean age 37 42 $30,000 to less than $50,000 25% 17% $50,000 to less than $70,000 12% 17% Census Region 70,000 to less than $100,000 16% 14% Northeast 15% 19% $100,000 or more 13% 25% Midwest 9% 24% Median income ($000) $53 $65 South 36% 37% West 40% 20% Own/Rent Own home 59% 67% Rent home 38% 31% 35
  • 36.
    Metric Source: ThinkNowResearch Hispanic Omnibus Study – July 2014 Hispanics n=505 Non- Hispanics n=310 Metric Sample Profile Hispanics n=505 Non- Hispanics n=310 Marital Status Educational Attainment Married 50% 46% Less than High School 5% 6% Single 34% 30% High school graduate 17% 17% Living with partner 9% 8% Some College, but no degree 24% 24% Separated/divorced 7% 8% Trade or technical school 4% 7% Widowed 2% 3% Graduated from 2-year College 10% 11% Graduated from 4-5 year College 33% 28% Average household size 3.2 2.8 Post Graduate Degree 7% 8% Presence of Children Employment Status No children <18 present 49% 56% Employed or self employed (net) 65% 56% Any children <18 present 51% 44% Full-time Homemaker 10% 14% Currently unemployed 11% 8% Ages of children^ n=258 n=135 Student, not employed 7% 5% Under age 6 38% 37% Unable to work/Disabled 4% 7% Ages 6 to 12 57% 44% Retired 3% 9% Ages 13 to 17 49% 38% ^ Among respondents with children 36
  • 37.
    Metric Source: ThinkNowResearch Hispanic Omnibus Study – July 2014 Hispanics n=505 Language Spoken at Home Spanish only 10% Spanish mostly 32% Spanish and English equally 25% English mostly 17% English only 16% Country of Origin Mexican/Mexican American 60% Puerto Rican 16% South American 11% Cuban 9% Central American 5% Dominican 4% Acculturation Low Acculturation 11% Medium Acculturation 63% High Acculturation 26% Sample Profile 37