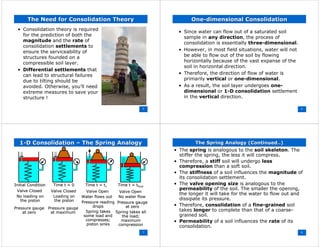
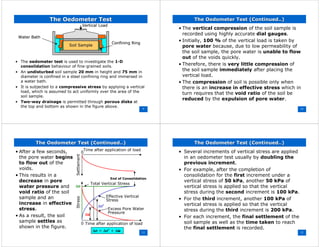
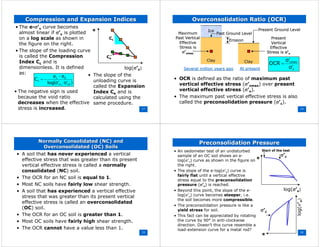
This document provides an overview of one-dimensional consolidation and oedometer tests. It discusses how consolidation leads to a reduction in soil volume through drainage of water from voids over time. An oedometer test subjects an undisturbed soil sample to incremental loads in a confined apparatus to measure consolidation settlement and determine coefficients of compressibility. Graphs of void ratio versus effective stress and their slopes yield information on soil compression and expansion behavior and overconsolidation ratio.
Geotechnical Engineering-II [Lec #3: Direct Shear Test)Muhammad Irfan
Class notes of Geotechnical Engineering course I used to teach at UET Lahore. Feel free to download the slide show.
Anyone looking to modify these files and use them for their own teaching purposes can contact me directly to get hold of editable version.
Class notes of Geotechnical Engineering course I used to teach at UET Lahore. Feel free to download the slide show.
Anyone looking to modify these files and use them for their own teaching purposes can contact me directly to get hold of editable version.
Polymer Modified Bitumen (PMB) for Road ConstructionJOMSON MATHACHAN
Bitumen is a by-product of fractional distillation of crude oil.
Current world consumption of bitumen is approximately 120 million tons per year.
In India, flexible pavements with bituminous surfacing are widely used.
Rapid development, exponential increase in traffic, and significant variations in daily and seasonal temperatures have shown some limitations in bitumen binder performance.
The presentation illustrates a technique for ground improvement, Grouting. In India, grouting is still not being used very much. In this presentation, I have demonstrated the basic types of grouting, goals of ground improvement and two case studies of grouting.
This presentation includes in how many ways plastic can be used in soil stabilization. It covers how a waste material can be used without any additional increase in cost.
Detailed content on shear strength of soils, principles of effective stresses, tests conducted to determine the shear strength of soils and its applications, dilatancy, thixotropy and sensitivity.
This presentation is all about consolidation of soil and it's importance in Civil Engineering, co-efficients of consolidation, methods of determining co-efficient of consolidation, Terzaghi's Spring Analogy, Terzaghi's Theory
Sheet1Moisture content analysis final resultsGroupValue of m3 (g)A.docxbjohn46
Sheet1Moisture content analysis final resultsGroupValue of m3 (g)A21.459B25 kPa34.35950 kPa18.771C19.282D17.816E23.651F26.148GTBCH28.664
LEEDS BECKETT UNIVERSITY
CIVIL ENGINEERING
GEOTECHNICAL ENGINEERING: APPLICATION & THEORY (BEng)
Laboratory Experiment:
Undrained triaxial compression test (without pore water pressure measurement) BS
1377: Part 7: 1990.
Object of Experiment:
To determine the undrained shear strength of a soil using the triaxial compression test.
Theory/Apparatus:
The apparatus consists of a cell, which is filled with water under pressure; the
specimen is loaded vertically, via a proving ring to measure load.
Triaxial Cell
The vertical load on the specimen is increased until failure occurs, the vertical strain
being recorded at the same time using a dial gauge. The test is repeated on different
specimens from the same soil, using different values of cell pressure.
254
Stresses on specimen in Triaxial Cell
Cell Pressure Deviator Stress =P/A 1=3+P/A
1 = major principal stress
3 = minor principal stress
Therefore, P/A = (1-3) =Deviator stress
The deviator stress is the load on the specimen, P, divided by the cross sectional area
of the specimen. However, as the sample is compressed during the test, the cross
sectional area will increase. Therefore, in calculating the deviator stress an allowance
for the change in area must be considered.
For the calculation of deviator stress, it is assumed that the volume of the specimen
remains constant and that the sample will deform as a cylinder, e.g.
100%
o
X
Strain
L
1 3
P
Deviator stress
A
where P = vertical load, which is measured by a proving ring (kN)
A = Area calculated using the following method;
( ) )o o o oVolume V A L AL A L X
255
1
o o
o
V A
or A or A
L X
Method:
1. Extrude the sample from the tube and trim to size - soil sample of 38mm
diameter and 76mm long.
2. Sleeve the sample with the rubber membrane.
3. Put the sample on the pedestal at the bottom of the cell and seal with the
rubber ring. Place the loading cap on top of the sample and seal with rubber
ring, before securing top drainage tube.
4. Mount the cell over the sample and fill as per the
Flooding Triaxial Cell checklist.
5. Set-up the test with the Clisp Studio assistant, and complete the
Pressurising Triaxial Cell checklist before running the test stages.
6. When test stages are complete, end the test via Clip Studio and complete the
Draining Triaxial Cell checklist.
Results and Calculations:
• Sketch the failure mode of each sample.
• Calculate the moisture content of the soil as per Appendix A.
• Calculate the results as follows:
(i) For each sample tested:
• Find the failure strain (either the final value or.
Lý thuyết về mô hình địa kỹ thuật cơ bảnKhuất Thanh
Ebook trình bày một số khái niệm chính về lý thuyết mô hình địa kỹ thuật và phương pháp phần tử hữu hạn trọng cơ học đất, thường được áp dụng trong các phần mềm Địa kỹ thuật như Plaxis
MỐI TƯƠNG QUAN GIỮA KHẢ NĂNG CHỊU LỰC CỦA ĐẤT (SOIL BEARING CAPACITY) VÀ MÔ Đ...Khuất Thanh
Các kỹ sư sử dụng ngày một nhiều các phần mềm để thiết kế móng bè như móng mềm để tiết kiệm bê tông. Thay vì dùng “Khả năng chịu tải của đất” (Soil bearing capacity), các phần mềm thường yêu cầu khai báo tính chất được gọi là “Mô đun phản lực nền” (Modulus of subgrade reaction). Tại sao tính chất này của đất là cần thiết? Có mối liên hệ nào giữa hai hệ số này? Có thể tính toán một hệ số này từ hệ số kia? Bài báo này sẽ giải thích ý nghĩa của các hệ số này và mối liên hệ giữa chúng.
6th International Conference on Machine Learning & Applications (CMLA 2024)ClaraZara1
6th International Conference on Machine Learning & Applications (CMLA 2024) will provide an excellent international forum for sharing knowledge and results in theory, methodology and applications of on Machine Learning & Applications.
NO1 Uk best vashikaran specialist in delhi vashikaran baba near me online vas...Amil Baba Dawood bangali
Contact with Dawood Bhai Just call on +92322-6382012 and we'll help you. We'll solve all your problems within 12 to 24 hours and with 101% guarantee and with astrology systematic. If you want to take any personal or professional advice then also you can call us on +92322-6382012 , ONLINE LOVE PROBLEM & Other all types of Daily Life Problem's.Then CALL or WHATSAPP us on +92322-6382012 and Get all these problems solutions here by Amil Baba DAWOOD BANGALI
#vashikaranspecialist #astrologer #palmistry #amliyaat #taweez #manpasandshadi #horoscope #spiritual #lovelife #lovespell #marriagespell#aamilbabainpakistan #amilbabainkarachi #powerfullblackmagicspell #kalajadumantarspecialist #realamilbaba #AmilbabainPakistan #astrologerincanada #astrologerindubai #lovespellsmaster #kalajaduspecialist #lovespellsthatwork #aamilbabainlahore#blackmagicformarriage #aamilbaba #kalajadu #kalailam #taweez #wazifaexpert #jadumantar #vashikaranspecialist #astrologer #palmistry #amliyaat #taweez #manpasandshadi #horoscope #spiritual #lovelife #lovespell #marriagespell#aamilbabainpakistan #amilbabainkarachi #powerfullblackmagicspell #kalajadumantarspecialist #realamilbaba #AmilbabainPakistan #astrologerincanada #astrologerindubai #lovespellsmaster #kalajaduspecialist #lovespellsthatwork #aamilbabainlahore #blackmagicforlove #blackmagicformarriage #aamilbaba #kalajadu #kalailam #taweez #wazifaexpert #jadumantar #vashikaranspecialist #astrologer #palmistry #amliyaat #taweez #manpasandshadi #horoscope #spiritual #lovelife #lovespell #marriagespell#aamilbabainpakistan #amilbabainkarachi #powerfullblackmagicspell #kalajadumantarspecialist #realamilbaba #AmilbabainPakistan #astrologerincanada #astrologerindubai #lovespellsmaster #kalajaduspecialist #lovespellsthatwork #aamilbabainlahore #Amilbabainuk #amilbabainspain #amilbabaindubai #Amilbabainnorway #amilbabainkrachi #amilbabainlahore #amilbabaingujranwalan #amilbabainislamabad
We have compiled the most important slides from each speaker's presentation. This year’s compilation, available for free, captures the key insights and contributions shared during the DfMAy 2024 conference.
Hierarchical Digital Twin of a Naval Power SystemKerry Sado
A hierarchical digital twin of a Naval DC power system has been developed and experimentally verified. Similar to other state-of-the-art digital twins, this technology creates a digital replica of the physical system executed in real-time or faster, which can modify hardware controls. However, its advantage stems from distributing computational efforts by utilizing a hierarchical structure composed of lower-level digital twin blocks and a higher-level system digital twin. Each digital twin block is associated with a physical subsystem of the hardware and communicates with a singular system digital twin, which creates a system-level response. By extracting information from each level of the hierarchy, power system controls of the hardware were reconfigured autonomously. This hierarchical digital twin development offers several advantages over other digital twins, particularly in the field of naval power systems. The hierarchical structure allows for greater computational efficiency and scalability while the ability to autonomously reconfigure hardware controls offers increased flexibility and responsiveness. The hierarchical decomposition and models utilized were well aligned with the physical twin, as indicated by the maximum deviations between the developed digital twin hierarchy and the hardware.
Forklift Classes Overview by Intella PartsIntella Parts
Discover the different forklift classes and their specific applications. Learn how to choose the right forklift for your needs to ensure safety, efficiency, and compliance in your operations.
For more technical information, visit our website https://intellaparts.com
Harnessing WebAssembly for Real-time Stateless Streaming PipelinesChristina Lin
Traditionally, dealing with real-time data pipelines has involved significant overhead, even for straightforward tasks like data transformation or masking. However, in this talk, we’ll venture into the dynamic realm of WebAssembly (WASM) and discover how it can revolutionize the creation of stateless streaming pipelines within a Kafka (Redpanda) broker. These pipelines are adept at managing low-latency, high-data-volume scenarios.
Using recycled concrete aggregates (RCA) for pavements is crucial to achieving sustainability. Implementing RCA for new pavement can minimize carbon footprint, conserve natural resources, reduce harmful emissions, and lower life cycle costs. Compared to natural aggregate (NA), RCA pavement has fewer comprehensive studies and sustainability assessments.
An Approach to Detecting Writing Styles Based on Clustering Techniquesambekarshweta25
An Approach to Detecting Writing Styles Based on Clustering Techniques
Authors:
-Devkinandan Jagtap
-Shweta Ambekar
-Harshit Singh
-Nakul Sharma (Assistant Professor)
Institution:
VIIT Pune, India
Abstract:
This paper proposes a system to differentiate between human-generated and AI-generated texts using stylometric analysis. The system analyzes text files and classifies writing styles by employing various clustering algorithms, such as k-means, k-means++, hierarchical, and DBSCAN. The effectiveness of these algorithms is measured using silhouette scores. The system successfully identifies distinct writing styles within documents, demonstrating its potential for plagiarism detection.
Introduction:
Stylometry, the study of linguistic and structural features in texts, is used for tasks like plagiarism detection, genre separation, and author verification. This paper leverages stylometric analysis to identify different writing styles and improve plagiarism detection methods.
Methodology:
The system includes data collection, preprocessing, feature extraction, dimensional reduction, machine learning models for clustering, and performance comparison using silhouette scores. Feature extraction focuses on lexical features, vocabulary richness, and readability scores. The study uses a small dataset of texts from various authors and employs algorithms like k-means, k-means++, hierarchical clustering, and DBSCAN for clustering.
Results:
Experiments show that the system effectively identifies writing styles, with silhouette scores indicating reasonable to strong clustering when k=2. As the number of clusters increases, the silhouette scores decrease, indicating a drop in accuracy. K-means and k-means++ perform similarly, while hierarchical clustering is less optimized.
Conclusion and Future Work:
The system works well for distinguishing writing styles with two clusters but becomes less accurate as the number of clusters increases. Future research could focus on adding more parameters and optimizing the methodology to improve accuracy with higher cluster values. This system can enhance existing plagiarism detection tools, especially in academic settings.
Cosmetic shop management system project report.pdfKamal Acharya
Buying new cosmetic products is difficult. It can even be scary for those who have sensitive skin and are prone to skin trouble. The information needed to alleviate this problem is on the back of each product, but it's thought to interpret those ingredient lists unless you have a background in chemistry.
Instead of buying and hoping for the best, we can use data science to help us predict which products may be good fits for us. It includes various function programs to do the above mentioned tasks.
Data file handling has been effectively used in the program.
The automated cosmetic shop management system should deal with the automation of general workflow and administration process of the shop. The main processes of the system focus on customer's request where the system is able to search the most appropriate products and deliver it to the customers. It should help the employees to quickly identify the list of cosmetic product that have reached the minimum quantity and also keep a track of expired date for each cosmetic product. It should help the employees to find the rack number in which the product is placed.It is also Faster and more efficient way.
Literature Review Basics and Understanding Reference Management.pptxDr Ramhari Poudyal
Three-day training on academic research focuses on analytical tools at United Technical College, supported by the University Grant Commission, Nepal. 24-26 May 2024
Understanding Inductive Bias in Machine LearningSUTEJAS
This presentation explores the concept of inductive bias in machine learning. It explains how algorithms come with built-in assumptions and preferences that guide the learning process. You'll learn about the different types of inductive bias and how they can impact the performance and generalizability of machine learning models.
The presentation also covers the positive and negative aspects of inductive bias, along with strategies for mitigating potential drawbacks. We'll explore examples of how bias manifests in algorithms like neural networks and decision trees.
By understanding inductive bias, you can gain valuable insights into how machine learning models work and make informed decisions when building and deploying them.
1. OneOne--dimensional Consolidation anddimensional Consolidation and
Oedometer TestOedometer Test
Lecture No. 12
October 24, 2002
2
Settlement of a Soil LayerSettlement of a Soil Layer
• The settlement is defined as the compression of a
soil layer due to the loading applied at or near its
top surface.
• The total settlement of a soil layer consists of three
parts:
– Immediate or Elastic Compression
– Compression due to Primary Consolidation
– Compression due to Secondary Consolidation
• The immediate or elastic compression can be
calculated using the elastic theory if the elastic
modulus of the soil layer is known.
• In this topic, we will learn the consolidation
theory that is used to estimate the compression
due to primary and secondary consolidation.
3
What is Consolidation?What is Consolidation?
• The process of consolidation is often confused with
the process of compaction.
• The difference between consolidation and
compaction can be appreciated using three-phase
diagrams as shown below:
AirAir
WaterWater
SolidsSolids
AirAir
WaterWater
SolidsSolids
Reduction in the
volume of the air
CompactionCompaction
WaterWater
SolidsSolids
ConsolidationConsolidation
WaterWater
SolidsSolids
Reduction in the
volume of the water
4
What is Consolidation? (Continued..)What is Consolidation? (Continued..)
• Compaction increases the density of an
unsaturated soil by reducing the volume of air in
the voids.
• Consolidation is a time-related process of
increasing the density of a saturated soil by
draining some of the water out of the voids.
• Consolidation is generally related to fine-grained
soils such as silts and clays.
• Coarse-grained soils (sands and gravels) also
undergo consolidation but at a much faster rate
due to their high permeability.
• Saturated clays consolidate at a much slower
rate due to their low permeability.
2. 5
The Need for Consolidation TheoryThe Need for Consolidation Theory
• Consolidation theory is required
for the prediction of both the
magnitude and the rate of
consolidation settlements to
ensure the serviceability of
structures founded on a
compressible soil layer.
• Differential settlements that
can lead to structural failures
due to tilting should be
avoided. Otherwise, you’ll need
extreme measures to save your
structure !
6
OneOne--dimensional Consolidationdimensional Consolidation
• Since water can flow out of a saturated soil
sample in any direction, the process of
consolidation is essentially three-dimensional.
• However, in most field situations, water will not
be able to flow out of the soil by flowing
horizontally because of the vast expanse of the
soil in horizontal direction.
• Therefore, the direction of flow of water is
primarily vertical or one-dimensional.
• As a result, the soil layer undergoes one-
dimensional or 1-D consolidation settlement
in the vertical direction.
7
11--D ConsolidationD Consolidation –– The Spring AnalogyThe Spring Analogy
Initial ConditionInitial Condition Time t = 0Time t = 0 Time t = tTime t = t11 Time t =Time t = ttfinalfinal
Valve ClosedValve Closed
Pressure gaugePressure gauge
at zeroat zero
No loading onNo loading on
the pistonthe piston
Pressure gaugePressure gauge
at maximumat maximum
Loading onLoading on
the pistonthe piston
Valve ClosedValve Closed Valve OpenValve Open
Water flows outWater flows out
Pressure readingPressure reading
dropsdrops
Spring takesSpring takes
some load andsome load and
compresses;compresses;
piston sinkspiston sinks
Valve OpenValve Open
No water flowNo water flow
Pressure gaugePressure gauge
at zeroat zero
Spring takes allSpring takes all
the load;the load;
maximummaximum
compressioncompression
8
The Spring Analogy (Continued..)The Spring Analogy (Continued..)
• The spring is analogous to the soil skeleton. The
stiffer the spring, the less it will compress.
• Therefore, a stiff soil will undergo less
compression than a soft soil.
• The stiffness of a soil influences the magnitude of
its consolidation settlement.
• The valve opening size is analogous to the
permeability of the soil. The smaller the opening,
the longer it will take for the water to flow out and
dissipate its pressure.
• Therefore, consolidation of a fine-grained soil
takes longer to complete than that of a coarse-
grained soil.
• Permeability of a soil influences the rate of its
consolidation.
3. 9
The Oedometer TestThe Oedometer Test
• The oedometer test is used to investigate the 1-D
consolidation behaviour of fine-grained soils.
• An undisturbed soil sample 20 mm in height and 75 mm in
diameter is confined in a steel confining ring and immersed in
a water bath.
• It is subjected to a compressive stress by applying a vertical
load, which is assumed to act uniformly over the area of the
soil sample.
• Two-way drainage is permitted through porous disks at
the top and bottom as shown in the figure above.
Soil SampleSoil Sample
Vertical LoadVertical Load
Confining RingConfining Ring
Water BathWater Bath
10
The Oedometer Test (Continued..)The Oedometer Test (Continued..)
• The vertical compression of the soil sample is
recorded using highly accurate dial gauges.
• Initially, 100 % of the vertical load is taken by
pore water because, due to low permeability of
the soil sample, the pore water is unable to flow
out of the voids quickly.
• Therefore, there is very little compression of
the soil sample immediately after placing the
vertical load.
• The compression of soil is possible only when
there is an increase in effective stress which in
turn requires that the void ratio of the soil be
reduced by the expulsion of pore water.
11
The Oedometer Test (Continued..)The Oedometer Test (Continued..)
• After a few seconds,
the pore water begins
to flow out of the
voids.
• This results in a
decrease in pore
water pressure and
void ratio of the soil
sample and an
increase in effective
stress.
• As a result, the soil
sample settles as
shown in the figure.
Time after application of load
Settlement
0
0 Time after application of load
Stress
Total Vertical Stress
Effective Vertical
Stress
Excess Pore Water
Pressure
End of Consolidation
∆u
∆σ’
∆σ
∆σ == ∆σ’ ++ ∆u 12
The Oedometer Test (Continued..)The Oedometer Test (Continued..)
• Several increments of vertical stress are applied
in an oedometer test usually by doubling the
previous increment.
• For example, after the completion of
consolidation for the first increment under a
vertical stress of 50 kPa, another 50 kPa of
vertical stress is applied so that the vertical
stress during the second increment is 100 kPa.
• For the third increment, another 100 kPa of
vertical stress is applied so that the vertical
stress during the third increment is 200 kPa.
• For each increment, the final settlement of the
soil sample as well as the time taken to reach
the final settlement is recorded.
4. 13
The Oedometer Test (Continued..)The Oedometer Test (Continued..)
• The end points from a
number of loading and
unloading increments
of an oedometer test
may be plotted as a
conventional stress-
strain curve as shown
in the figure on the
right.
Vertical Effective Stress (Vertical Effective Stress (kPakPa))
50 kPa
100
200
400
350
225
100
VerticalStrain(%)VerticalStrain(%)
• The increment of vertical strain ∆εv for each loading
increment is given by:
0ultv h∆s∆ε =
where ∆sult is the final settlement for the loading
increment (i.e. the change in sample height) and h0
is the initial sample height. 14
The Oedometer Test (Continued..)The Oedometer Test (Continued..)
• Since the settlement of
the soil is only due to
change in void ratio,
the vertical strain ∆εv
can be expressed in
terms of the void ratio
of the soil sample at
different stages of the
test.
WaterWater
SolidsSolids
WaterWater
SolidsSolids
h0
∆h
1+eo
∆e
00
v
e1
∆e
h
∆h
∆ε
+
==
• In the above equation, ∆e is the change in void ratio
due to the loading increment and e0 is the void ratio
of the soil sample before the application of the
loading increment.
15
The Oedometer Test (Continued..)The Oedometer Test (Continued..)
• Since the void ratio of
the soil sample at
different stages of an
oedometer test can be
estimated using the
equation on Page 14, it
is customary to plot the
results in terms of
vertical effective stress
σ’v and void ratio e as
shown in the figure on
the right.
σ’v (kPa)
e
• The nature of the graph
is not affected by the
change in the vertical
axis.
16
The Coefficient of Volume CompressibilityThe Coefficient of Volume Compressibility
• The coefficient of volume
compressibility mv is
defined as the ratio of
volumetric strain over
change in effective stress:
σ’v (kPa)
e
∆∆ee
∆σ∆σ’’vv
( ) v0v
v
v
σ∆e1
∆e
σ∆
∆ε
m
′+
=
′
=
1.21.2
0.80.8
100100 200200
• The units for mv are the inverse of pressure, i.e.
m2/kN and its value depends on the stress range
over which it is calculated.
• For the second loading increment shown in the
figure above:
( )
( )( )
/kNm0.00182
1002001.21
0.8-1.2
m 2
v =
−+
=
5. 17
Compression and Expansion IndicesCompression and Expansion Indices
• The e-σ’v curve becomes
almost linear if σ’v is plotted
on a log scale as shown in
the figure on the right.
• The slope of the loading curve
is called the Compression
Index Cc and is
dimensionless. It is defined
as:
log(σ’v)
e
CCcc
CCee
( )v0v1
01
c
σσlog
ee
C
′′
−
−=
• The negative sign is used
because the void ratio
decreases when the effective
stress is increased.
• The slope of the
unloading curve is
called the Expansion
Index Ce and is
calculated using the
same procedure.
18
OverconsolidationOverconsolidation Ratio (OCR)Ratio (OCR)
• OCR is defined as the ratio of maximum past
vertical effective stress (σ’vmax) over present
vertical effective stress (σ’v).
• The maximum past vertical effective stress is also
called the preconsolidation pressure (σ’c).
IceIce
Past Ground LevelPast Ground Level
Present Ground LevelPresent Ground Level
ErosionErosion
ClayClay ClayClay
PresentPresent
VerticalVertical
EffectiveEffective
Stress isStress is σσ’’vv
MaximumMaximum
Past VerticalPast Vertical
EffectiveEffective
Stress isStress is
σσ’’vmaxvmax
Several million years agoSeveral million years ago At presentAt present v
vmax
σ
σ
OCR
′
′
=
19
Normally Consolidated (NC) andNormally Consolidated (NC) and
Overconsolidated (OC) SoilsOverconsolidated (OC) Soils
• A soil that has never experienced a vertical
effective stress that was greater than its present
vertical effective stress is called a normally
consolidated (NC) soil.
• The OCR for an NC soil is equal to 1.
• Most NC soils have fairly low shear strength.
• A soil that has experienced a vertical effective
stress that was greater than its present vertical
effective stress is called an overconsolidated
(OC) soil.
• The OCR for an OC soil is greater than 1.
• Most OC soils have fairly high shear strength.
• The OCR cannot have a value less than 1.
20
PreconsolidationPreconsolidation PressurePressure
• An oedometer test of an undisturbed
sample of an OC soil shows an e-
log(σ’v) curve as shown in the figure on
the right.
• The slope of the e-log(σ’v) curve is
fairly flat until a vertical effective
stress equal to the preconsolidation
pressure (σ’c) is reached.
• Beyond this point, the slope of the e-
log(σ’v) curve becomes steeper, i.e.
the soil becomes more compressible.
• The preconsolidation pressure is like a
yield stress for soil.
• This fact can be appreciated by rotating
the curve by 90° in anti-clockwise
direction. Doesn’t this curve resemble a
load-extension curve for a metal rod?
log(σ’v)
e
Start of the test
σ’c
log(σ’v)
e
σ’c