Download to read offline

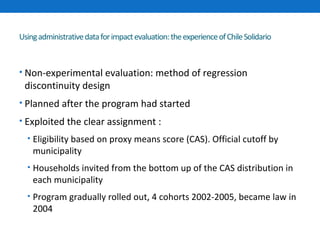
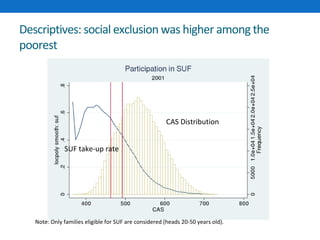
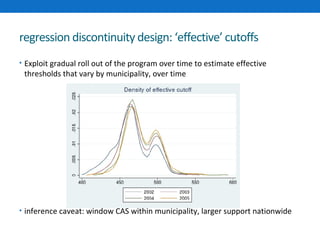
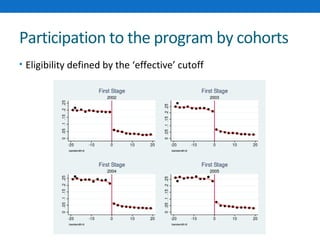
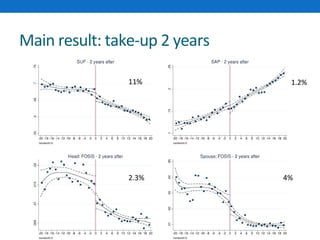
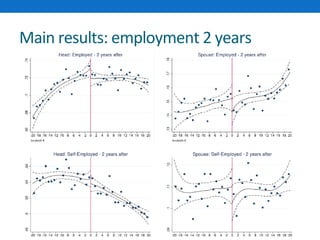
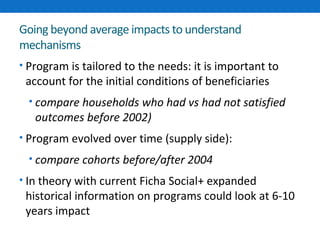
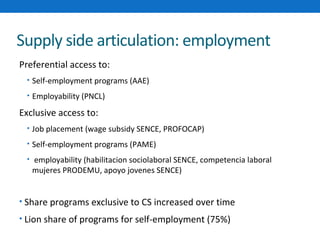
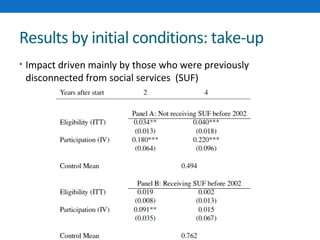
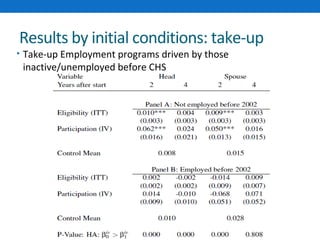

1. The document discusses using administrative data from social programs for program evaluations. It provides examples from Chile Solidario, a conditional cash transfer program in Chile. 2. Regression discontinuity designs were used to evaluate Chile Solidario's impacts on outcomes like take-up of social services, employment, and poverty. Impacts generally persisted over time but depended on initial conditions and access to complementary social services. 3. The quality of social workers implementing Chile Solidario was also found to impact participation and employment outcomes, highlighting the importance of implementation quality.


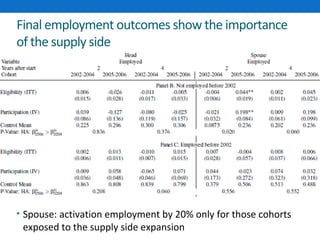
![Popple5 c7[2]](https://cdn.slidesharecdn.com/ss_thumbnails/popple5c72-120614155836-phpapp02-thumbnail.jpg?width=640&height=640&fit=bounds)


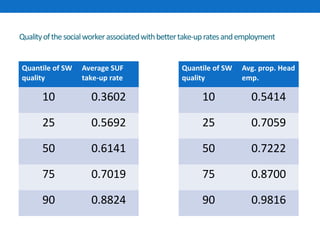
![제 23회 보아즈(BOAZ) 빅데이터 컨퍼런스 - [MBOAX] : ABSA를 활용한 소비자 반응 분석 기반 운영 효율화 대시보드 설계](https://cdn.slidesharecdn.com/ss_thumbnails/3-1boaz23rdconferencemboax-260203102709-9d519923-thumbnail.jpg?width=640&height=640&fit=bounds)


