http://spr.ly/Finance_PM - Explore how three key attributes of "Big Data" – volume, velocity, and variety – have a profound impact on financial planning. Explore how technology developments are converging to create the Big Data rush and can assist with planning and performance management (Beyond Budgeting, 2013).
Navigating the Digital Economy InfographicSAP Analytics
The digital economy paves innovative ways for corporations on a global scale to improve the traditional business world. By providing easier B2B collaboration, communication, search and strategy planning, the digital economy will change the way we do business together.
More Personalized Banking Through Big Data and AnalyticsSAP Analytics
http://spr.ly/AA_banking - Commonwealth Bank of Australia (CBA) knows a lot about its customers. That is partly because it has a huge footprint in the country—it processes nine million transactions per day, handles 40 percent of the card transactions in Australia and maintains 12 million account profiles. With new data sources and tools, Commonwealth Bank of Australia is providing more personalized service to customers and building loyalty within the community.
-Bloomberg Businessweek Research
The importance of Data is growing every day. How is Data helping your business? The majority of companies fail to utilize their Data to the fullest, are you one of them?
Open Innovation - Winter 2014 - Socrata, Inc.Socrata
As innovators around the world push the open data movement forward, Socrata features their stories, successes, advice, and ideas in our quarterly magazine, “Open Innovation.”
The Winter 2014 issue of Open Innovation is out. This special year-in-review edition contains stories about some of the biggest open data achievements in 2013, as well as expert insights into how open data can grow and where it may go in 2014.
What Does 2018 Have In Store For The Big Data IndustryPromptCloud
Since data is growing in size along with its variety of applications and business use cases, the coming years are definitely going to be eventful in the big data space. Here are some of the trends that we are likely to see in big data during 2018.
Web Scraping reveals top tech trends and company’s media mentions in 2017PromptCloud
To understand the tech landscape and its coverage in 2017, we deployed our in-house web crawler to extract the article titles from two popular outlets and performed text mining on the dataset to uncover the top buzzwords, companies and products.
Infographic | The Growing Need for Fast, Secure TelehealthInsight
Could telehealth be the way patients are triaged in the future? Let’s explore the current landscape, the benefits of telehealth and what’s needed for it to gain widespread traction across the industry.
Insights Success is a platform that focuses distinctively on emerging as well as leading IT companies, their confrontational style of doing business and way of delivering effective and collaborative solutions to strengthen market share.Our magazine talks about leaders and orators from the world of technology, which includes CEO’s, CIO’s, VP’s, Managers and other professionals who had set a benchmark in the revolution of IT industry.
The Identification of the ROI of Big Data is Pending on the Democratization of the Business Insights Coming from Advanced and Predictive Analytics of that Information
The Future of Marketing - What will Marketing look like in 2021?Tom De Baere
What will marketing look like in 2021?
“Human society will change more the coming 20 years… than the last 300 years”
We now live in a world of exponential technological change.
2017 is the TURNING POINT of this Exponential Change.
Change appeared to go slow, but now everything will now begin to change,
all at the same time.
Algorithms will impact 1 billion human jobs in 2020
Everything is abundantly available. Everything goes to the cloud. Money. Books. Governments. Cities. Content becomes essentially free.
With everything being abundantly available, people change from owning ‘stuff’, to experiencing ‘stuff’. People want experiences.
Image recognition by computers is becoming better than humans.
Computers recognize voices, not just speech, already today.
You can ask anything, using smart ”agents”
By 2019 websites and apps become less important. In 2019, 20% of all brands will start abandoning their mobile apps, in favor of progressive and instant apps
What is REALLY happening here?
The interface is dissapearing
WHEN is this going to happen ?
Years from now, not decades
So the big question is…. What will marketing look like in 2021?
Everything will be about technology
We’ll move from products to total experiences
From brands to platforms
Nike+ is opening their fitness data to
3rd party developers.
Gillette lets men try on virtual beards and connects them with 3rd party products & services.
General Electric opens sensor data of their products to 3rd party suppliers.
And finally, what will your marketing JOB look like in 2021?
Marketing organization haven’t changed that much in the last 40 years. That is about to change. DRASTICALLY.
Everything that can be digitized and automated, will be replaced by Artificial Intelligence.
The reverse is also true… Everything that cannot be digitized and automated, will become
EXTREMELY VALUABLE
Top 5 marketing skills needed in 2021
Such as critical thinking and creativity.
And fluid teams
Strategic thinkers become critical to success
The era of the right brain has arrived
Creativity in content, data, technology & strategy becomes crucial
How can you
PREPARE
for 2021 ?
Get in touch
www.invisiblepuppy.com
Thinking Small: Bringing the Power of Big Data to the MassesFlutterbyBarb
Thinking Small: Bringing the Power of Big Data to the Masses via Adobe with the results of improved access to insights, better user experiences, and greater productivity in the enterprise.
Dark Data Revelation and its Potential BenefitsPromptCloud
This presentation covers benefits, use cases, practical examples, potential issues and the approach that needs to be taken when it comes to harnessing the power of dark data (a largely untapped strategic play in the big data realm).
Notes from the Observation Deck // A Data Revolution gngeorge
Notes from the Observation Deck will provide you with an examined look at the interesting phenomena and trends taking place around us today. We present them to you with the hope of sparking broader conversations, debates and ideas. Please use this as a resource for knowledge, inspiration and enjoyment.
Disruption is the talk of the town - breakthrough technologies are, well, breaking through everywhere and everyday. What can firms do to mitigate the risk of being disrupted? By disruption! It's no easy task to 'eat oneself' and often there will be serious barriers (culture, technology etc.) for doing so. As we are moving fast from industrial production and economies of scale, economies of experience and service design become the critical assets: The customer experience! The customer experience must seek to integrate the digital with the physical. Your customers already swaps seamlessly between the two, so should you! With mobile as more than just another channel, customer experience must also focus on creating 'mobile moments' (of truth) where customer needs are foreseen and fulfilled across the omnichannel. Key is to provide a platform on which users can interact and co-create. Providing the winning platform will position you as the gatekeeper, 'owning' the customer (as the saying goes) and safe guard against new entrants and disruption. Enable collaboration to take this digital transformation the last steps.
Big Data is the lastest cashcow. Data Analytics has now a crucial role for industries. This article describes as to what is Big Data and Analytics and how a Chartered Accountant will be able to provide value in this field.
The objective of this module is to provide an overview of what the future impacts of big data are likely to be.
Upon completion of this module you will:
Gain valuable insight into the predictions for the future of Big Data
Be better placed to recognise some of the trends that are emerging
Acquire an overview of the possible opportunities your business can have with Big Data
Understand some of the start up challenges you might have with Big Data
The objective of this module is to take a look into what big data can bring you in the future.
Upon completion of this module you will:
- See what are the predictions for the future of Big Data
- Take a look at some trends that are emerging
- Get an overview of possible opportunities your company can have with Big Data
- Face some of the start up challenges you might have with Big Data
Duration of the module: approximately 1 – 2 hours
The term ‘data’ here may refer to facts or figures from both traditional and digital sources – it could be online interactions on social media platforms, or even product transaction information at a retail store.
Magenta advisory: Data Driven Decision Making –Is Your Organization Ready Fo...BearingPoint Finland
It’s nice to have loads of data. Nevertheless, many managers start to sweat when it comes to genuinely fact-based decision making. This study reveals the keys to leveraging big data successfully.
Alternative Data is everywhere. We MUST start using them as a competitive edge over the competitors who are all looking to only their traditional data sources
Data Analytics has become a powerful tool to drive corporates and businesses. check out this 6 Reasons to Use Data Analytics. Visit: https://www.raybiztech.com/blog/data-analytics/6-reasons-to-use-data-analytics
Es bien sabido el hecho de que la tecnología de la información está cambiando.
Es necesario conocer las 5 tendencias claves que afectan la hoy por hoy:
1) Visualización
2) Big Data
3) "La Nube"
4) Social
5) Móvil
BIG DATA is having an enormous impact on the profile of workforces around the world. If you've ever seen the technology and experienced the impact it has on the pace of innovation in a business then the predictations made by McKinsey Global Institute will come as no surprise ( and just in case you've been on holiday for around two years, McKinsey is suggesting that by 2018 the US will face a shortfall of close to 200,000 analysts and 1.5 million managers with the right skills. In this presentation I outline the impact of BIG DATA on workforce design. I hope you find it informative and fun to read. Ian.
#askSAP Analytics Innovations Community Call – Bridging the Information GapSAP Analytics
Imagine your business taking advantage of intelligent decision making with all aspects of your business, in real-time and effortlessly, consistent and reliable day-by-day. Now, consider doing this without the need to acquire, setup or maintain any additional hardware.
In our second #askSAP Community Call of the year, we will take it up a notch. This time around we’ll bring together experts you haven’t heard before to bring this vision to life. See in action how one holistic data management framework can enable confident decision making, which includes:
Simplifying access to your data by providing live real-time access to all data sources in a distributed landscape
Providing a single point of access for security and anonymization, while reducing data duplication
Giving you intelligent data that you can rely on by taking advantage of advanced analytics tools to deliver intelligent solutions
Reducing TCO by minimizing management costs and enabling self-service for business users
In addition, Puget Sound Energy, an SAP customer in the Washington State public sector utility, will share how they’re reimagining industry processes for increased employee engagement and organizational success. Learn how they combine the power of SAP SuccessFactors solutions and Labor Relations Software by Sodales, an application extension built on SAP Cloud Platform, to enhance engagement with the unionized workforce. This successful HR transformation is expected to reduce operational expenses and positively impact organizational integrity.
Optimize Business Intelligence Efforts With Embedded, Application-Driven Anal...SAP Analytics
Want to discover, procure, and provision business intelligence data more effectively? Forrester Consulting has a suggestion: embedded, application-driven analytics.
#askSAP Analytics Innovations Community Call: SAP Analytics 2019 Strategy and...SAP Analytics
Whether it’s growing a loyal customer base, pressure from innovative competitors, or retaining top talent, there is no shortage of strategic decisions to make by businesses today. SAP is tackling these challenges head-on by delivering the Intelligent Enterprise, and SAP Analytics is the glue that connects all the pieces together – from data right through to intelligence. Whether through new cloud technologies, existing on-premise investments, or every possible hybrid combination, SAP Analytics enables businesses to make faster, more confident decisions. In this webinar you will learn about what's ahead in 2019 for SAP Analytics. Visit www.sap.com/asksap to view the recording.
#AskSAP Analytics Innovations Community Call: SAP Analytics Fall 2018 Innovat...SAP Analytics
Analytics are the window into an Intelligent Enterprise and the landscapes are always changing, evolving, and improving. We’ve gone from ‘governed BI’ to ‘modern and agile BI with data discovery’, to the acceptance of cloud analytics and now emergent ‘smart BI’ using AI and machine learning to provide natural language interfaces. Innovation is moving both technology and the benefits it can offer organizations rapidly forward - on premise, in the cloud, and hybrid.
Discover how we’re bringing analytics together, making analytics easier, and delivering modern innovation in the cloud. Visit www.sap.com/asksap
#askSAP Analytics Innovations Community Call: Become an Intelligent Enterpris...SAP Analytics
New digital technologies allow companies to make core business processes more intelligent. Companies can automate business processes and augment employee's capabilities to let them do more than they could do before with more focus on strategic tasks based on real-time and forward-looking insights. This shift is accelerating in every industry and compelling every organization to transform into an intelligent enterprise to nimbly adapt to new market realities. SAP S/4HANA is the digital core platform to become such an intelligent enterprise. This digital transformation is driving the need for more analytics and a big opportunity which occurs through this transformation is to give all employees, partners and customers, immediate and forward-looking insights into what is going on and what is going to happen next.
#askSAP Analytics Innovations Community Call: SAP 2018 strategy and Roadmap f...SAP Analytics
Today companies need modern analytics capabilities that work together to analyze data wherever it resides for enterprises of all sizes and across every industry. To help them better understand that data and to help simplify and transform their business there are different technology options available - on premise, cloud, and hybrid. Hear SAP product experts share SAP’s roadmap and vision for business intelligence and data discovery covering these technology options
#asksap Analytics Innovations Community Call: SAP BW/4HANA - the Big Data War...SAP Analytics
Learn how SAP BW/4HANA delivers big data warehouse solutions that meet your current and future business analytics needs in a rapidly changing data landscape and increase your organization’s success in the next generation of business.
This presentation by Timo Elliott given at the 2017 SAP Insider event in Amsterdam provides an overview of SAP Leonardo, a "digital innovation system."
#askSAP Analytics Innovations Community Call: Delivering the Intelligent Ente...SAP Analytics
www.sap.com/asksap - Digitization is turning every company into a software-driven organization that intelligently connects people, things, and businesses together. At the center of digitization is massive data that can be harnessed into unprecedented insights.
Learn more about SAP’s Machine Learning strategy, and portfolio of machine learning driven applications and intelligent services.
Data & Analytics: The Competitive Edge for Small and Midsize BusinessesSAP Analytics
To further explore how small and medium businesses are using analytics for decision making, download the IDC paper, “Analytics for SMBs: Sharpen Operations, Capitalize on Business Opportunities,” sponsored by SAP: http://bit.ly/2qQkWf6.
Data Analytics Help Drive Digital Transformation InfographicSAP Analytics
Digital transformation has become a board-level initiative at many companies. A key part of this investment is being focused on data and analytics.
For more on how data and analytics is being used in digital transformation, download the IDC paper, “The Value of Data & Analytics in Digital Transformation”, sponsored by SAP. Download here: http://bit.ly/2siS5QY
#askSAP: Journey to the Cloud: SAP Strategy and Roadmap for Cloud and Hybrid ...SAP Analytics
www.sap.com/businessobjects-cloud. The momentum of customers moving to the SAP BusinessObjects Cloud is rapidly accelerating – and so are the innovations being introduced by SAP. New features and functionality for cloud and on premise with SAP BusinessObjects Enterprise offer hybrid use cases that organizations can take advantage of as they embark on their journey to the cloud. View the webinar reply at http://webinars.sap.com/asksap-webinar-series/en/home#section_3.
Unify Line of Business Data with SAP Digital BoardroomSAP Analytics
In this sample use case, you can see the power and potential of unifying your business data using SAP Digital Boardroom to gain meaningful insight. Learn more at http://www.sap.com/digital-boardroom
With SAP Digital Boardroom, you’re able to:
• Connect to Cloud data
• Leverage SAP business networks such as Hybris, Fieldglass, Ariba, and SuccessFactors
• Make faster decisions on live data
• Gain actionable insights
• Collaborate seamlessly in real-time
#asksap Analytics Innovations Community Call - Take Action in 2017 with Innov...SAP Analytics
Learn more about the highly anticipated 2017 release of SAP BusinessObjects Lumira 2.0, the expanded modeling and scalable machine learning capabilities of SAP BusinessObjects Predictive Analytics 3.1, and the extended availability of SAP BusinessObjects Roambi.
Companies using SAP BusinessObjects Analytics solutions have achieved significant improvements and savings. For a deeper look, read the October 2016 Forrester Consulting study, “The Total Economic Impact™ of SAP BusinessObjects Analytics: Cost Savings and Business Benefits,” commissioned by SAP.
For more, please visit: http://bit.ly/2g00ntG
#askSAP EPM Innovations Community Call: How Planning Can Ignite Digital Trans...SAP Analytics
SAP.com/EPM - With various planning solutions available at SAP including SAP BusinessObjects Planning and Consolidation, version for SAP NetWeaver and SAP BusinessObjects Cloud for planning, get a better understanding on how using one or both of these tools can help drive Digital Transformation in the Enterprise.
Learn what the latest releases of these SAP solutions offer and how they can work together to bring further insights to the Finance department.
#askSAP Analytics Innovations Community Call: Reimagine Analytics for the Dig...SAP Analytics
http://sap.com/predictive - New digital technologies allow companies to reimagine business models, rise to disruptive market entrants and squeeze more productivity from less resources. Companies embracing digital transformation by investing in advanced analytics are winning. They create more revenue, greater market valuations, and growing profitability.
SAP BusinessObjects Predictive Analytics is a game changer in the predictive space by helping you create, deploy, and maintain thousands of predictive models that anticipate future outcomes and guide better, more profitable decision-making across your digital enterprise.
#askSAP Analytics Innovations Community Call: Innovation in Core BI Solutions...SAP Analytics
Where is SAP BusinessObjects BI headed, and how will your organization benefit?
See how SAP is delivering on its commitment to innovate its business intelligence (BI) applications. With SAP BusinessObjects BI 4.2 now available, now is a perfect time to explore what this new release has to offer and hear about announcements made at SAPPHIRE NOW 2016.
#askSAP GRC Innovations Community Call: Cybersecurity Risk and GovernanceSAP Analytics
How is your organization tackling ever increasing cybersecurity threats? Do you have the proper structure and methods in place to effectively mitigate this constantly evolving risk?
Get a sneak preview on how SAP is helping companies embrace the age of digital transformation while rethinking their security strategy, especially as it relates to protecting business applications and improving overarching risk and governance programs.
#askSAP EPM Innovations Community Call: Transform Finance into Instant InsightSAP Analytics
http://bit.ly/askSAP_TransformFinance - What will instant insight bring to the finance picture? Faster and more insightful budgeting and forecasting. The ability to analyze changes to actuals vs. budgets – with no delays. A common financial platform for budgets, forecasts and actuals. And the list goes on…
You won’t want to miss this #askSAP session to get a sneak preview on how SAP is helping the finance sector embrace the digital age with SAP Business Planning and Consolidation, optimized for S/4HANA Finance.
Sudheer Mechineni, Head of Application Frameworks, Standard Chartered Bank
Discover how Standard Chartered Bank harnessed the power of Neo4j to transform complex data access challenges into a dynamic, scalable graph database solution. This keynote will cover their journey from initial adoption to deploying a fully automated, enterprise-grade causal cluster, highlighting key strategies for modelling organisational changes and ensuring robust disaster recovery. Learn how these innovations have not only enhanced Standard Chartered Bank’s data infrastructure but also positioned them as pioneers in the banking sector’s adoption of graph technology.
GraphRAG is All You need? LLM & Knowledge GraphGuy Korland
Guy Korland, CEO and Co-founder of FalkorDB, will review two articles on the integration of language models with knowledge graphs.
1. Unifying Large Language Models and Knowledge Graphs: A Roadmap.
https://arxiv.org/abs/2306.08302
2. Microsoft Research's GraphRAG paper and a review paper on various uses of knowledge graphs:
https://www.microsoft.com/en-us/research/blog/graphrag-unlocking-llm-discovery-on-narrative-private-data/
Observability Concepts EVERY Developer Should Know -- DeveloperWeek Europe.pdfPaige Cruz
Monitoring and observability aren’t traditionally found in software curriculums and many of us cobble this knowledge together from whatever vendor or ecosystem we were first introduced to and whatever is a part of your current company’s observability stack.
While the dev and ops silo continues to crumble….many organizations still relegate monitoring & observability as the purview of ops, infra and SRE teams. This is a mistake - achieving a highly observable system requires collaboration up and down the stack.
I, a former op, would like to extend an invitation to all application developers to join the observability party will share these foundational concepts to build on:
Unlocking Productivity: Leveraging the Potential of Copilot in Microsoft 365, a presentation by Christoforos Vlachos, Senior Solutions Manager – Modern Workplace, Uni Systems
Elevating Tactical DDD Patterns Through Object CalisthenicsDorra BARTAGUIZ
After immersing yourself in the blue book and its red counterpart, attending DDD-focused conferences, and applying tactical patterns, you're left with a crucial question: How do I ensure my design is effective? Tactical patterns within Domain-Driven Design (DDD) serve as guiding principles for creating clear and manageable domain models. However, achieving success with these patterns requires additional guidance. Interestingly, we've observed that a set of constraints initially designed for training purposes remarkably aligns with effective pattern implementation, offering a more ‘mechanical’ approach. Let's explore together how Object Calisthenics can elevate the design of your tactical DDD patterns, offering concrete help for those venturing into DDD for the first time!
DevOps and Testing slides at DASA ConnectKari Kakkonen
My and Rik Marselis slides at 30.5.2024 DASA Connect conference. We discuss about what is testing, then what is agile testing and finally what is Testing in DevOps. Finally we had lovely workshop with the participants trying to find out different ways to think about quality and testing in different parts of the DevOps infinity loop.
Climate Impact of Software Testing at Nordic Testing DaysKari Kakkonen
My slides at Nordic Testing Days 6.6.2024
Climate impact / sustainability of software testing discussed on the talk. ICT and testing must carry their part of global responsibility to help with the climat warming. We can minimize the carbon footprint but we can also have a carbon handprint, a positive impact on the climate. Quality characteristics can be added with sustainability, and then measured continuously. Test environments can be used less, and in smaller scale and on demand. Test techniques can be used in optimizing or minimizing number of tests. Test automation can be used to speed up testing.
PHP Frameworks: I want to break free (IPC Berlin 2024)Ralf Eggert
In this presentation, we examine the challenges and limitations of relying too heavily on PHP frameworks in web development. We discuss the history of PHP and its frameworks to understand how this dependence has evolved. The focus will be on providing concrete tips and strategies to reduce reliance on these frameworks, based on real-world examples and practical considerations. The goal is to equip developers with the skills and knowledge to create more flexible and future-proof web applications. We'll explore the importance of maintaining autonomy in a rapidly changing tech landscape and how to make informed decisions in PHP development.
This talk is aimed at encouraging a more independent approach to using PHP frameworks, moving towards a more flexible and future-proof approach to PHP development.
GridMate - End to end testing is a critical piece to ensure quality and avoid...ThomasParaiso2
End to end testing is a critical piece to ensure quality and avoid regressions. In this session, we share our journey building an E2E testing pipeline for GridMate components (LWC and Aura) using Cypress, JSForce, FakerJS…
GraphSummit Singapore | The Future of Agility: Supercharging Digital Transfor...Neo4j
Leonard Jayamohan, Partner & Generative AI Lead, Deloitte
This keynote will reveal how Deloitte leverages Neo4j’s graph power for groundbreaking digital twin solutions, achieving a staggering 100x performance boost. Discover the essential role knowledge graphs play in successful generative AI implementations. Plus, get an exclusive look at an innovative Neo4j + Generative AI solution Deloitte is developing in-house.
Encryption in Microsoft 365 - ExpertsLive Netherlands 2024Albert Hoitingh
In this session I delve into the encryption technology used in Microsoft 365 and Microsoft Purview. Including the concepts of Customer Key and Double Key Encryption.
Alt. GDG Cloud Southlake #33: Boule & Rebala: Effective AppSec in SDLC using ...James Anderson
Effective Application Security in Software Delivery lifecycle using Deployment Firewall and DBOM
The modern software delivery process (or the CI/CD process) includes many tools, distributed teams, open-source code, and cloud platforms. Constant focus on speed to release software to market, along with the traditional slow and manual security checks has caused gaps in continuous security as an important piece in the software supply chain. Today organizations feel more susceptible to external and internal cyber threats due to the vast attack surface in their applications supply chain and the lack of end-to-end governance and risk management.
The software team must secure its software delivery process to avoid vulnerability and security breaches. This needs to be achieved with existing tool chains and without extensive rework of the delivery processes. This talk will present strategies and techniques for providing visibility into the true risk of the existing vulnerabilities, preventing the introduction of security issues in the software, resolving vulnerabilities in production environments quickly, and capturing the deployment bill of materials (DBOM).
Speakers:
Bob Boule
Robert Boule is a technology enthusiast with PASSION for technology and making things work along with a knack for helping others understand how things work. He comes with around 20 years of solution engineering experience in application security, software continuous delivery, and SaaS platforms. He is known for his dynamic presentations in CI/CD and application security integrated in software delivery lifecycle.
Gopinath Rebala
Gopinath Rebala is the CTO of OpsMx, where he has overall responsibility for the machine learning and data processing architectures for Secure Software Delivery. Gopi also has a strong connection with our customers, leading design and architecture for strategic implementations. Gopi is a frequent speaker and well-known leader in continuous delivery and integrating security into software delivery.
Removing Uninteresting Bytes in Software FuzzingAftab Hussain
Imagine a world where software fuzzing, the process of mutating bytes in test seeds to uncover hidden and erroneous program behaviors, becomes faster and more effective. A lot depends on the initial seeds, which can significantly dictate the trajectory of a fuzzing campaign, particularly in terms of how long it takes to uncover interesting behaviour in your code. We introduce DIAR, a technique designed to speedup fuzzing campaigns by pinpointing and eliminating those uninteresting bytes in the seeds. Picture this: instead of wasting valuable resources on meaningless mutations in large, bloated seeds, DIAR removes the unnecessary bytes, streamlining the entire process.
In this work, we equipped AFL, a popular fuzzer, with DIAR and examined two critical Linux libraries -- Libxml's xmllint, a tool for parsing xml documents, and Binutil's readelf, an essential debugging and security analysis command-line tool used to display detailed information about ELF (Executable and Linkable Format). Our preliminary results show that AFL+DIAR does not only discover new paths more quickly but also achieves higher coverage overall. This work thus showcases how starting with lean and optimized seeds can lead to faster, more comprehensive fuzzing campaigns -- and DIAR helps you find such seeds.
- These are slides of the talk given at IEEE International Conference on Software Testing Verification and Validation Workshop, ICSTW 2022.
1. By Steve Player,
Program Director,
Beyond Budgeting Round
Table, North America
Copyright 2012.
Beyond Budgeting Round
Table, North America.
All rights reserved.
Page 1
Convergence Creating Big Data
The Three “V”s of Big Data
What do they mean to Financial Planners?
Big Data is currently garnering a tremendous amount of attention.1
When compared to the vast
quantities of data in the recent past, thought leaders often point to three key attributes—volume,
velocity, and variety.2 The analysis of these three key attributes can be extended into understand-
ing what Big Data means to the financial planning and analysis function. This article identifies the
technology developments converging to create the Big Data rush and examines how the financial
planning function is impacted by volume, velocity, and variety of data. It seeks to help financial
planners leverage these Big Data differences into better performance management and more effec-
tive planning.
There are several distinct technology developments that have converged to create the
Big Data storm. Following are the most important factors:
1 The Internet opens the path for collaboration and knowledge
sharing. This means virtually anyone can be enabled to partici-
pate.
2 Mobile devices have uncoupled both input sources and re-
porting locations opening them to virtually anywhere that can
be reached by a tower or a satellite. This means participation
can come from virtually anyone, anywhere, anytime.
3 Sensor technology has automated data collection while dramat-
ically lowering device costs. This means cost-effective tracking is
within reach of more and more organizations.
4 Cloud computing reduces the upfront costs of technology while
opening access to millions. This means that users are freed from con-
straints in their Information Technology departments—freed to quickly deploy
business applications without the IT manpower required for typical on premise
applications. It also frees time in that these applications are configurable rather than
customizable, which further reduces the IT requirement. The IT department also
enjoys this freedom as the time freed up means they can focus on other strategic
projects.
5 Digitized business has become the norm creating an ocean of data as a normal
by-product of their operation. This means a wealth of business data that merely
needs to be accessed.
6 Social media has rapidly spread to provide millions of data points, constantly
flowing by, that just need to be tapped into and analyzed. This means a wealth of
additional data that is consumer generated and low cost to access.
7 In-memory storage costs have continued to follow Moore’s Law of increasing
storage capacity at lower costs. This means that all the data being generated has a
better chance of being available to be used in “real-time” via RAM storage.
Big
Data
In-memory
computing
In-memory
storage
Social
media
Digitized
business
Cloud
computing
Sensor
technology
Mobile
devices
Internet
2. By Steve Player,
Program Director,
Beyond Budgeting Round
Table, North America
Copyright 2012.
Beyond Budgeting Round
Table, North America.
All rights reserved.
Page 2
When speaking about planning, budgeting, and forecasting, I often note that financial planners
send out instructions that approach the annual budgeting exercise as if they are beginning with a
clean sheet of paper. This might work if your organization is a brand new start up; however, most
companies will find more useful plans by assuming their organization is like a ship that is sailing out
on the water.
Using this sailing analogy, you should view your ship as an accumulated set of capabilities with a
related cost structure. It has been formed based on thousands of decisions you made in the past—
decisions about:
●● What products and services you should pro-
vide.
●● What customers you will serve.
●● What people you have hired.
●● What processes you are running.
●● Where you have chosen to locate your
facilities.
●● What equipment you have.
●● And thousands of additional past decisions.
In planning you can choose to change any of those
things. In reality it typically takes a project or initiative
and the related planning and implementation time to
make that change occur. And that change must happen
while your ship keeps sailing.
In financial planning it is important to realize that the
small pond or lake we may have thought we were
sailing on has turned into a huge sea of available data.
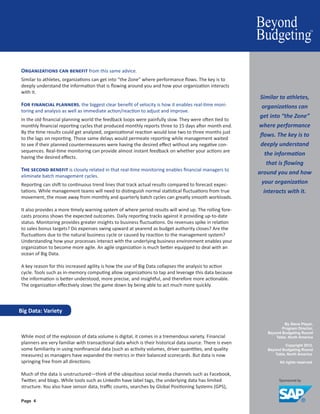
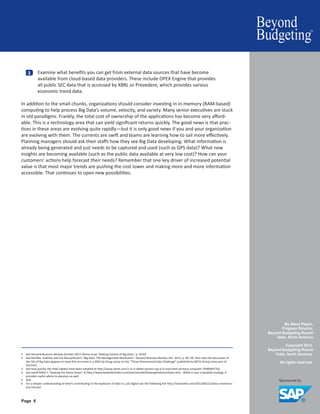
And the oceans of data created by Big Data volume have made the surface a lot rougher and poten-
tially dangerous. [See Figure 1]
Just as a sailor would ask when facing rough seas, a financial planner in the sea of Big Data must ask
“What do we need to know? What of this information is relevant to our decision making?”
This first question on the volume of Big Data options is one of current priority.
●● Is there information that helps to better understand our customers? For example, retailers
are analyzing customer buying patterns and their response to specific types of promotions.
Planners use this knowledge to better forecast sales.
Big Data: Volume
IDC Forecast Growth for Big Data
$
Billion
2010 2015
3.2
16.9
40% Compound
Annual Growth Rate
Source: Worldwide Big Data Technology and Services 2012-2015
Forecast released by International Data Corporation (IDC)
Figure 1
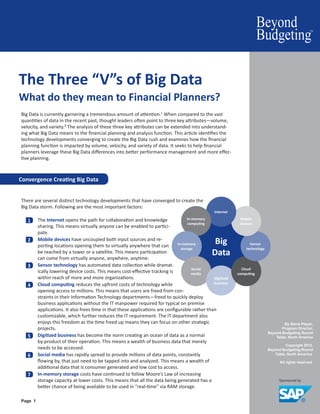
8 In-memory computing brings the processing power to allow analysts to convert
data into insights. This means that there is a powerful way to bring all these devel-
opments together to produce insights that lead to greater value.
While each of these developments is individually powerful, it is the interaction between them that
creates the current Big Data storm. For financial planners, the right focus can turn the storm into a
gold rush.
3. By Steve Player,
Program Director,
Beyond Budgeting Round
Table, North America
Copyright 2012.
Beyond Budgeting Round
Table, North America.
All rights reserved.
Page 3
●● Is there information that helps us to understand our operations? For example, utilities are
accessing smart meter data to understand customer usage patterns to optimize capacity
and avoid expensive capital additions.
The second question on Big Data volume is one of risk mitigation.
Is there information that helps us better understand our competitors? Just as data volume helps
you evaluate your capabilities and cost structure, it can also be used to evaluate competitors’ ca-
pabilities and cost structure. In places where you identify that they have an advantage, you can use
the information to catch up. Likewise, you can exploit the places where you have an advantage.
The third question on Big Data volume is one of future effectiveness.
What can we do to better position our organization? This question requires mining Big Data to help
validate your strategic plan and your ability to achieve your objectives. In addition to your own
performance and that of competitors, you also need to overlay the environmental forces. Even
though you seem to be on bigger water facing more competition, your organization still has goals
and objectives. You just have much greater information to help understand your situation and more
ways in which you can respond.
Big Data: VELOCITY
The massive expansion in data volume is being fed by expanding data velocity. Improvements in
mobile phones began to hint of potential changes. The pace accelerated as the phones became
smarter. Their capability began an explosion in data velocity with Tweets, Facebook posts, and the
desire to always be in touch—all being done from your smartphone. Then the iPad opened the
flood gates by capturing the imagination of consumers everywhere it was available. Consumers
raced to buy it and then put it to use. It made it easy to capture and easy to share everything—
photos, videos, jokes, product and service recommendations, maps and directions, your thoughts,
hopes, and dreams—in essence your life. Social media became more mobile and the technology
forces noted above began to feed on each other. Data velocity increased geometrically.
The iPad also began to impact business as consumers began to want the same experience at work
that they found at home. While past IT efforts faced huge resistance to change, the current explo-
sion is fueled by the consumerization of IT.3 For many IT professionals this is moving too fast. Some-
times they have become the resisters of change. That may be justified as concerns over security and
privacy need to be thoughtfully considered and addressed. But by now it is clear that this velocity is
accelerating. The key to success is identifying how to take advantage of it.
Those struggling with accelerating data velocity can benefit from looking at sports analogies. When
players move up in levels, such as from high school to college or college to the professional ranks,
coaches often advise that the player work to slow the game down.4 What they are referring to is
how an athlete’s perception of time is altered by his preparation for the contest being entered. As
sports coach Geoff Miller explains,
“In simple terms, the game speeds up because our perception of time is altered by
how we concentrate and by how much information we make automatic. If you can
understand how to control the way you focus your attention and automate the im-
portant physical skills and mental cues you’ll need …, you can slow the game down
and improve your performance under pressure.”5
Is there information
that helps us to
understand our
operations?
Is there information
that helps us to
better understand
our customers?
4. By Steve Player,
Program Director,
Beyond Budgeting Round
Table, North America
Copyright 2012.
Beyond Budgeting Round
Table, North America.
All rights reserved.
Page 4
Big Data: Variety
Organizations can benefit from this same advice.
Similar to athletes, organizations can get into “the Zone” where performance flows. The key is to
deeply understand the information that is flowing around you and how your organization interacts
with it.
For financial planners, the biggest clear benefit of velocity is how it enables real-time moni-
toring and analysis as well as immediate action/reaction to adjust and improve.
In the old financial planning world the feedback loops were painfully slow. They were often tied to
monthly financial reporting cycles that produced monthly reports three to 15 days after month end.
By the time results could get analyzed, organizational reaction would lose two to three months just
to the lags on reporting. Those same delays would permeate reporting while management waited
to see if their planned countermeasures were having the desired effect without any negative con-
sequences. Real-time monitoring can provide almost instant feedback on whether your actions are
having the desired effects.
The second benefit is closely related in that real-time monitoring enables financial managers to
eliminate batch management cycles.
Reporting can shift to continuous trend lines that track actual results compared to forecast expec-
tations. While management teams will need to distinguish normal statistical fluctuations from true
movement, the move away from monthly and quarterly batch cycles can greatly smooth workloads.
It also provides a more timely warning system of where period results will wind up. The rolling fore-
casts process shows the expected outcomes. Daily reporting tracks against it providing up-to-date
status. Monitoring provides greater insights to business fluctuations. Do revenues spike in relation
to sales bonus targets? Do expenses swing upward at yearend as budget authority closes? Are the
fluctuations due to the natural business cycle or caused by reaction to the management system?
Understanding how your processes interact with the underlying business environment enables your
organization to become more agile. An agile organization is much better equipped to deal with an
ocean of Big Data.
A key reason for this increased agility is how the use of Big Data collapses the analysis to action
cycle. Tools such as in-memory computing allow organizations to tap and leverage this data because
the information is better understood, more precise, and insightful, and therefore more actionable.
The organization effectively slows the game down by being able to act much more quickly.
While most of the explosion of data volume is digital, it comes in a tremendous variety. Financial
planners are very familiar with transactional data which is their historical data source. There is even
some familiarity in using nonfinancial data (such as activity volumes, driver quantities, and quality
measures) as managers have expanded the metrics in their balanced scorecards. But data is now
springing free from all directions.
Much of the data is unstructured—think of the ubiquitous social media channels such as Facebook,
Twitter, and blogs. While tools such as LinkedIn have label tags, the underlying data has limited
structure. You also have sensor data, traffic counts, searches by Global Positioning Systems (GPS),
Similar to athletes,
organizations can
get into “the Zone”
where performance
flows. The key is to
deeply understand
the information
that is flowing
around you and how
your organization
interacts with it.
5. By Steve Player,
Program Director,
Beyond Budgeting Round
Table, North America
Copyright 2012.
Beyond Budgeting Round
Table, North America.
All rights reserved.
Page 5
When initially considering how to apply Big Data, financial planners may feel overwhelmed. This is
as natural as the first time you take a sailboat out into open water. You can overcome this by start-
ing slowly. Take your planning areas and break it down into smaller chunks. Successfully completing
small chunks can build confidence to take on larger tasks. Three smaller chunks you can use for
quick start ideas include:
1 Take an existing area such as a revenue line item and build the logic diagram back-
ward. Remember you are trying to build all the way back to where you first touch
potential customers. List all the touch points and find where Big Data can provide
useful insights.
2 Evaluate how Big Data impacts your management framework. Begin with a diagram
of your current process. Annotate the places where Big Data is already assisting and
where it could help in the future. This can be used to develop your process improve-
ment road map. (If you have never diagrammed your management framework,
begin the process with one of the general management models available such as the
APQC’s global process classification scheme or the U.S. Malcolm Baldrige National
Quality Award criteria.)
and even mobile GPS data. It would be virtually impossible to
produce an exhaustive list because new sources are constantly
being developed. The challenge is to use this ocean of data
without being lost at sea—and it’s a sea of complexity bred by
the variety of data.
When examining this data I am often reminded of the old style radio dials that allowed tuning by
turning them left or right. When you got one positioned just right, the signal would get translated
into clear words or sounds. If you had it wrong, the only noise you heard was static. As we move
about today, we are surrounded by a spectrum that carries information. But the only way we can
hear it is if we are properly tuned in. Likewise, there is a variety of Big Data streaming around our
organization to which many of us are oblivious. There are tremendous opportunities for those who
harvest the insights this information provides.
Planners are already using predictive logic diagrams. These management tools provide visual exam-
ples of the change of activities that lead to desired actions. Forecasters work with sales managers to
forecast expected sales by examining the current status and movement being tracked in an organi-
zation’s sales funnel. The sales funnel serves as a predictive logic diagram showing the relationship
between different levels of sales interest. Inquiries and targets are pursued to be converted into
leads. Leads are tracked and converted into proposal opportunities, which are tracked through sales
completion. The size of jobs and results being experienced provide knowledge that can be used in
predicting future outcomes. The lag time through the sales cycle predicts the future outcomes from
the current pipeline.
These predictive logic diagrams become more useful when they extend further up into the leading
activities that foreshadow future outcomes. New tools such as sentiment analysis help extend these
efforts to provide faster customer feedback and longer lead times for reactions. They are the new
fields that planners are beginning to learn how to harvest.
Action Items for Financial Planners
New sources of data are constantly being developed
Sensor data
Traffic counts
GPS data
Blogs
Mobile GPS data
6. By Steve Player,
Program Director,
Beyond Budgeting Round
Table, North America
Copyright 2012.
Beyond Budgeting Round
Table, North America.
All rights reserved.
Page 6
3 Examine what benefits you can get from external data sources that have become
available from cloud-based data providers. These include OPEX Engine that provides
all public SEC data that is accessed by XBRL or Prevedere, which provides various
economic trend data.
In addition to the small chunks, organizations should consider investing in in-memory (RAM-based)
computing to help process Big Data’s volume, velocity, and variety. Many senior executives are stuck
in old paradigms. Frankly, the total cost of ownership of the applications has become very afford-
able. This is a technology area that can yield significant returns quickly. The good news is that prac-
tices in these areas are evolving quite rapidly—but it is only good news if you and your organization
are evolving with them. The currents are swift and teams are learning how to sail more effectively.
Planning managers should ask their staffs how they see Big Data developing. What information is
already being generated and just needs to be captured and used (such as GPS data)? What new
insights are becoming available (such as the public data available at very low cost)? How can your
customers’ actions help forecast their needs? Remember that one key driver of increased potential
value is that most major trends are pushing the cost lower and making more and more information
accessible. That continues to open new possibilities.
1 See Harvard Business Review October 2012 theme issue “Getting Control of Big Data,” p. 59-83
2 See McAfee, Andrew and Erik Beynjolfsson’s “Big Data: The Management Revolution”. Harvard Business Review, Oct. 2012, p. 60- 68. Also note the discussion of
the 3Vs of Big Data appears to have first occurred in a 2001 by Doug Laney on the “Three Dimensional Data Challenge” published by META Group (now part of
Gartner).
3 See how quickly the iPad/ tablets have been adopted at http://www.zdnet.com/1-in-4-tablet-owners-say-it-is-now-their-primary-computer-7000004770/
4 See Geoff Miller’s “Slowing the Game Down” at http://www.beabetterhitter.com/text/mental/SlowingtheGameDown.htm . While it uses a baseball analogy, it
provides useful advice to planners as well.
5 Ibid.
6 For a deeper understanding of what’s contributing to the explosion of data vs. just digital see the following link http://mashable.com/2012/06/22/data-created-ev-
ery-minute/