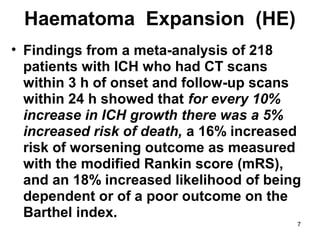
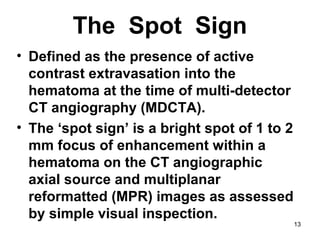
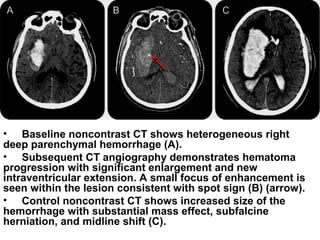
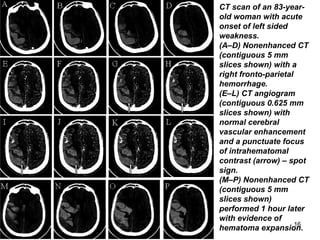
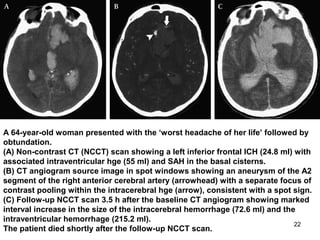
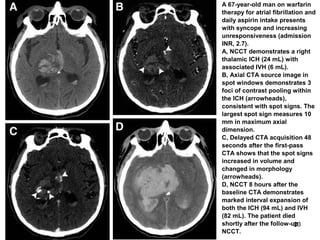
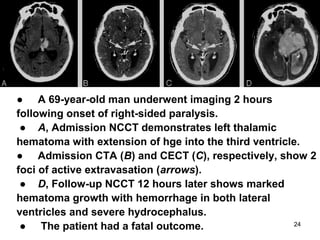
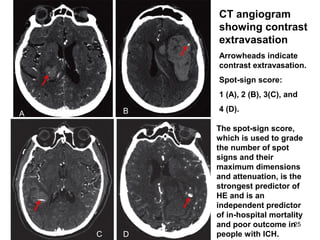
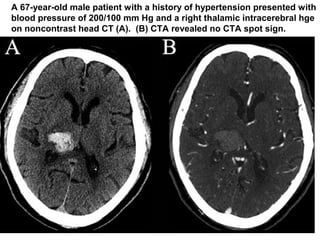
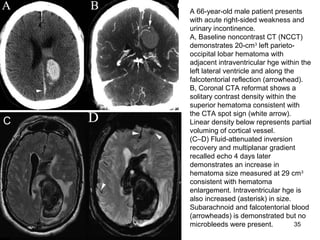
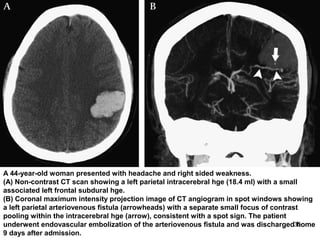
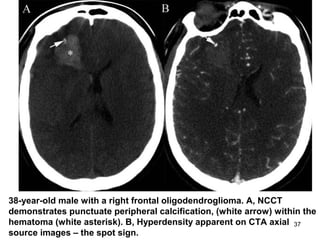
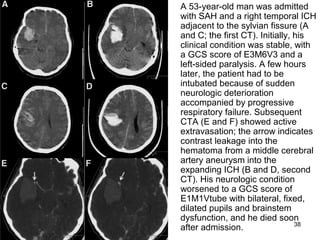
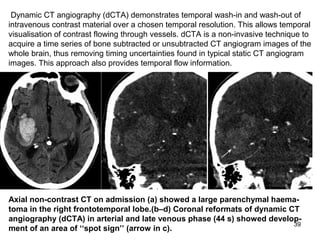
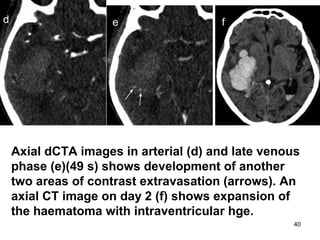
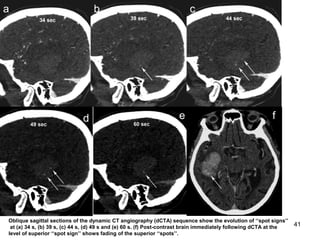
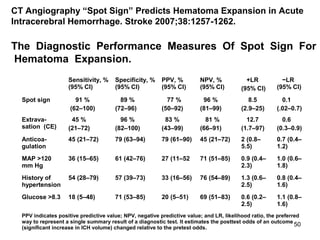
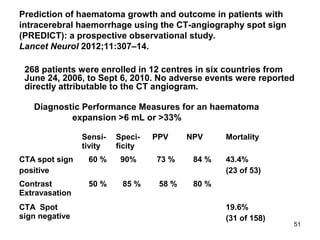
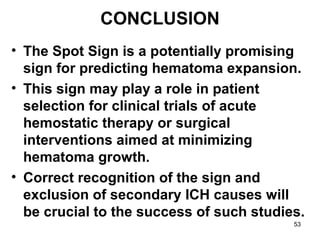
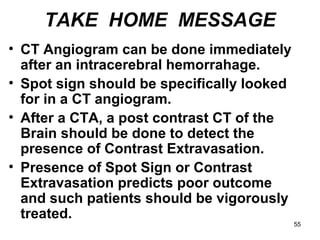
1
2
THE SPOT SIGN
DR. QUAMRUDDIN AHMAD
DEPARTMENT OF NEUROLOGY
RAJSHAHI MEDICAL COLLEGE
3
Spontaneous or Primary
Intracerebral Haemorrhage
• Accounting for 10 – 30% of first -
ever strokes.
• The 30 day mortality for ICH
has been reported to be 30 –
55%, with
• Half the deaths occurring in the
acute phase, especially in the
first 48 h.
4
COMPLICATIONS OF INTRA
CEREBRAL HAEMORRHAGE
1. Haematoma Expansion (HE),
2. Perihaematomal Oedema (PHE),
3. Intraventricular Extension of
Haemorrhage (IVH) with Hydrocephalus,
4. Seizures and Epilepsy,
5. Venous Thromboembolic Events (VTE),
6. Fever and Infections,
7. Hyperglycaemia, and
8. Increased Blood Pressure (BP).
5
Haematoma
Expansion (HE)
• Defined as an increase in volume of 33 – 50% or
an absolute change in haematoma volume of
12.5 – 20 mL (on repeat CT),
• Early HE occurs in 18–38% of patients scanned
within 3 h of ICH onset, and more than 70%
develop at least some extent of HE within 24 h of
symptom onset, even in the absence of known
coagulopathy, suggesting an active bleeding
process in the hyperacute phase of ICH.
COMPLICATIONS OF ICH
1. Haematoma Expansion (HE),
2. Perihaematomal Oedema (PHE),
3. Intraventricular Extension of
Hge (IVH) with Hydrocephalus,
4. Seizures and Epilepsy,
5. Venous Thromboembolic Events (VTE),
6. Fever and Infections,
7. Hyperglycaemia,
8. Increased Blood Pressure (BP),
6
Haematoma Expansion (HE)
(contd.)
• In warfarin-associated ICH, 27–54%
of patients develop early HE and a
delayed expansion because of
protracted bleeding,
• It is associated with up to 70%
increase in mortality.
• HE is an independent predictor of
poor outcome and increased
mortality.
7
Haematoma Expansion (HE)
• Findings from a meta-analysis of 218
patients with ICH who had CT scans
within 3 h of onset and follow-up scans
within 24 h showed that for every 10%
increase in ICH growth there was a 5%
increased risk of death, a 16% increased
risk of worsening outcome as measured
with the modified Rankin score (mRS),
and an 18% increased likelihood of being
dependent or of a poor outcome on the
Barthel index.
8
• Hyperacute
expansion of
haematoma in a
patient with
intracerebral hge on
serial CT scans.
Small haematoma
detected in the basal
ganglia and
thalamus (A).
Expansion of
haematoma after
151 min (B).
Continued
progression of
haematoma after
another 82 min (C).
Stabilisation of
haematoma after
another 76 min (D).
A B
C D
9
• Progression of haema-
toma and perihaema-
tomal oedema in a
patient with ICH on
serial CT scans. First
scan (E) was acquired
before the ICH.
Perihaematoma oedema
is high-lighted in green
to facilitate recognition
of progression of
oedema. At 4 h after
symptom onset there is
a small haematoma in
the basal ganglia (F).
Expansion of haema-
toma with extension
into the lateral ventricle
and new mass effect
and midline shift at 14 h
(G). Worsening
hydrocephalus and
early perihaematomal
oedema at 28 h (H).
Continued mass-effect
with prominent
perihaematomal
oedema at 73 h (I).
Resolving haematoma
with more prominent
perihaematomal
oedema at 7 days (J).
E F G
H I
J
10
Haematoma Expansion (HE)
Management
Interventions to restrict HE include:
* haemostatic therapy,
* cautious lowering of high BP,
* quick reversal of prior
anticoagulation, and
* surgical evacuation.
11
HOW TO
PREDICT
HAEMATOMA
EXPANSION ?
12
THETHE
SPOTSPOT
SIGNSIGN
13
The Spot Sign
• Defined as the presence of active
contrast extravasation into the
hematoma at the time of multi-detector
CT angiography (MDCTA).
• The ‘spot sign’ is a bright spot of 1 to 2
mm focus of enhancement within a
hematoma on the CT angiographic
axial source and multiplanar
reformatted (MPR) images as assessed
by simple visual inspection.
14
The Spot Sign
It is an indicator of active
hemorrhage and has been
associated with an
increased risk of significant
hematoma expansion and
mortality in patients with
ICH.
• Baseline noncontrast CT shows heterogeneous right
deep parenchymal hemorrhage (A).
• Subsequent CT angiography demonstrates hematoma
progression with significant enlargement and new
intraventricular extension. A small focus of enhancement is
seen within the lesion consistent with spot sign (B) (arrow).
• Control noncontrast CT shows increased size of the
hemorrhage with substantial mass effect, subfalcine
herniation, and midline shift (C).
16
CT scan of an 83-year-
old woman with acute
onset of left sided
weakness.
(A–D) Nonenhanced CT
(contiguous 5 mm
slices shown) with a
right fronto-parietal
hemorrhage.
(E–L) CT angiogram
(contiguous 0.625 mm
slices shown) with
normal cerebral
vascular enhancement
and a punctuate focus
of intrahematomal
contrast (arrow) – spot
sign.
(M–P) Nonenhanced CT
(contiguous 5 mm
slices shown)
performed 1 hour later
with evidence of
hematoma expansion.
17
MDCTA –
Multidetector CT Angiography
• MDCTA is rapidly becoming the favored
diagnostic examination in the initial
evaluation of patients presenting to the
emergency department with ICH, due to
its:
– widespread availability,
– rapidity of acquisition,
– lower cost, and
– favorable risk profile compared with
conventional catheter angiography,
18
MDCTA –
Multidetector CT Angiography
• MDCTA is highly accurate for
the detection of underlying
vascular lesions in patients
with ICH, with reported
sensitivities ranging from 89%
to 96% and specificities of 92%
to 100%.
19
MULTI - DETECTOR
CT ANGIOGRAPHY (MDCTA)
• MDCTA is performed by scanning from the
base of the C1 vertebral body to the vertex
using an axial technique, 0.5 pitch, 1.25-mm
collimation, 350 maximal mA, 120 kVp, 22-cm
field of view, and 65 to 85 mL of iodinated
contrast material administered by power
injector at 4 to 5 mL per second into an
antecubital vein with either a fixed 25-second
delay between the onset of contrast injection
and the start of scanning, or Smart-Prep, a
semiautomatic contrast bolus triggering
technique.
20
MULTI - DETECTOR
CT ANGIOGRAPHY (MDCTA)
• Subsequently, the 1.25-mm axial
CTA source images is reviewed in
“spot windows” (width 200, level
110) to determine the presence of
active contrast extravasation, the
spot sign, according to the
following strict radiological
criteria:
21
The Spot Sign Score in Primary Intracerebral Hemorrhage Identifies
Patients at Highest Risk of In-Hospital Mortality and Poor Outcome
Among Survivors. Stroke 2010;41:54-60.
• Spot Sign Criteria
–1 focus of contrast pooling within
the ICH,
–Attenuation 120 Hounsfield units,
–Discontinuous from normal or
abnormal vasculature adjacent to
the ICH,
–Any size and morphology.
22
A 64-year-old woman presented with the ‘worst headache of her life’ followed by
obtundation.
(A) Non-contrast CT (NCCT) scan showing a left inferior frontal ICH (24.8 ml) with
associated intraventricular hge (55 ml) and SAH in the basal cisterns.
(B) CT angiogram source image in spot windows showing an aneurysm of the A2
segment of the right anterior cerebral artery (arrowhead) with a separate focus of
contrast pooling within the intracerebral hge (arrow), consistent with a spot sign.
(C) Follow-up NCCT scan 3.5 h after the baseline CT angiogram showing marked
interval increase in the size of the intracerebral hemorrhage (72.6 ml) and the
intraventricular hemorrhage (215.2 ml).
The patient died shortly after the follow-up NCCT scan.
23
A 67-year-old man on warfarin
therapy for atrial fibrillation and
daily aspirin intake presents
with syncope and increasing
unresponsiveness (admission
INR, 2.7).
A, NCCT demonstrates a right
thalamic ICH (24 mL) with
associated IVH (6 mL).
B, Axial CTA source image in
spot windows demonstrates 3
foci of contrast pooling within
the ICH (arrowheads),
consistent with spot signs. The
largest spot sign measures 10
mm in maximum axial
dimension.
C, Delayed CTA acquisition 48
seconds after the first-pass
CTA shows that the spot signs
increased in volume and
changed in morphology
(arrowheads).
D, NCCT 8 hours after the
baseline CTA demonstrates
marked interval expansion of
both the ICH (94 mL) and IVH
(82 mL). The patient died
shortly after the follow-up
NCCT.
24
● A 69-year-old man underwent imaging 2 hours
following onset of right-sided paralysis.
● A, Admission NCCT demonstrates left thalamic
hematoma with extension of hge into the third ventricle.
● Admission CTA (B) and CECT (C), respectively, show 2
foci of active extravasation (arrows).
● D, Follow-up NCCT 12 hours later shows marked
hematoma growth with hemorrhage in both lateral
ventricles and severe hydrocephalus.
● The patient had a fatal outcome.
25
A B
C D
CT angiogram
showing contrast
extravasation
Arrowheads indicate
contrast extravasation.
Spot-sign score:
1 (A), 2 (B), 3(C), and
4 (D).
The spot-sign score,
which is used to grade
the number of spot
signs and their
maximum dimensions
and attenuation, is the
strongest predictor of
HE and is an
independent predictor
of in-hospital mortality
and poor outcome in
people with ICH.
26
Calculation of the
Spot Sign Score
• Spot Sign Characteristic* Points No. of spot signs
1– 2 1
3 2
• Maximum axial dimension
1– 4 mm 0
5 mm 1
• Maximum attenuation
120–179 HU 0
180 HU 1
* The spot sign characterization is performed in the first CTA
acquisition in which a spot sign is identified. For CTAs with more
than 1 spot sign, the maximum dimension in a single axial CTA
source image and maximum attenuation of the largest spot sign
is determined. The spot sign score is obtained by adding the total
No. of points for the CTA.
HU indicates Hounsfield unit; CTA, CT angiogram.
27
• Patient with spot sign,
demonstrating extravasation
and hematoma expansion.
CT slice selection has been
optimized for hematoma
configuration, not for head
position.
• A, Unenhanced CT
demonstrates left posterior
putaminal and internal
capsule hematoma with mild
surrounding edema. An old
parieto-occipital infarct is
seen posterior to this.
• B, A small focus of
enhancement is seen
peripherally on CTA source
images, consistent with the
spot sign (black arrow).
• C, Postcontrast CT
demonstrates enlargement
of the spot sign, consistent
with extravasation (white
arrow).
• D, Unenhanced CT image 1
day after presentation
reveals hematoma
enlargement and
intraventricular hemorrhage.
28
● An 85-year-old woman underwent imaging 1 hour following onset of
left-sided weakness.
● A, Admission NCCT demonstrates hemorrhage in the right superior
frontal gyrus.
● B, Admission CTA conspicuously reveals a focal area of high
attenuation (arrow) within the hematoma consistent with active
extravasation (spot sign).
● C, Admission CECT shows a slightly heterogeneous right frontal
hematoma with several areas of higher attenuation, frequently seen with
acute hemorrhage, which were not interpreted by the reviewer as discrete
foci of contrast extravasation (as a reminder, the reviewer evaluated CTA
and CECT images separately from each other). This patient survived.
29
An 82-year-old man
underwent imaging 0.5
hours following onset
of right-sided
weakness.
Admission NCCT (A)
and CTA (B)
demonstrate hge in the
left midbrain without
active extravasation on
CTA.
C, Admission CECT,
however, reveals focal
high attenuation
(arrow) in the left tectal
plate, consistent with
active extravasation.
D, Follow-up NCCT 17
hours later shows
hematoma expansion
into the left thalamus
and lateral ventricle
with marked
hydrocephalus. The
patient had a fatal
outcome.
30
41-year-old female with a
micro AVM.
A, NCCT demonstrates
centrum semiovale hematoma
(white asterisk).
B, A punctate focus of
enhancement (white arrow)
representing a pseudo-
aneurysm (white arrow) on
CTA axial source images
mimics a CTA spot sign.
C, A vessel is clearly seen
extending from the lateral
ventricular surface to the
hematoma periphery and
communicates with the focal
spot of enhancement on
coronal MPR image (black
arrow).
D, AP Oblique conventional
angiographic image demons-
trates a micro AVM with pseu-
doaneurysm (black arrow) fed
by branches of the anterior
cerebral artery and draining to
the lateral ventricular vein.
* Discontinuous from normal or abnormal
vasculature adjacent to the ICH
31
55-year-old male with moya moya. An enhancing focus is seen
in the inferior Basal Ganglia/Nucleus accumbens consistent with
a pseudoaneurysm (white arrow) arising from a lenticulostriate
artery (white arrowhead) on (A) CTA source, (B) coronal MPR,
and (C) saggital MPR images. The lenticulostriate vessel lies
peripheral to the hematoma only contacting it at the site of
pseudoaneurysm. Intraventricular hemorrhage and
hydrocephalus incidentally noted.
(Discontinuous from normal or abnormal vasculature adjacent to the ICH)
32
A 53-year-old female patient presenting at 140 minutes. Baseline noncontrast CT (NCCT; A) demonstrates
a right basal ganglia hge with mass effect on the right lateral ventricle and subfalcine herniation.
Intraventricular hge (IVH) is seen within the bilateral occipital horns, right frontal horn, and third and
fourth (not shown) ventricles (Graeb score 6).
B, Coronal CTA reformats demonstrate a peripheral region of contrast extravasation inferiorly within the
hematoma consistent with the CTA spot sign (arrow).`
33
Graeb Score
Intraventricular Hematoma
Components
• Each lateral ventricle
– 1 = trace of blood
– 2 = less than 50% filled
– 3 = more than 50% filled
– 4 = completely filled and expanded
• 3th and 4th ventricles
– 0 = no blood
– 1 = blood present, size normal
– 2 = filled with blood and expanded
Calculation
• Graeb score = right ventricular score + left ventricular
score + 3rd ventricular score + 4th ventricular score.
Hwang BY, Bruce SS, Appelboom G, Piazza MA, Carpenter AM, Gigante PR, et al. Evaluation of
intraventricular hemorrhage assessment methods for predicting outcome following intracerebral
hemorrhage. J Neurosurg 2012; 116:185-192.
34
A 67-year-old male patient with a history of hypertension presented with
blood pressure of 200/100 mm Hg and a right thalamic intracerebral hge
on noncontrast head CT (A). (B) CTA revealed no CTA spot sign.
35
A 66-year-old male patient presents
with acute right-sided weakness and
urinary incontinence.
A, Baseline noncontrast CT (NCCT)
demonstrates 20-cm3
left parieto-
occipital lobar hematoma with
adjacent intraventricular hge within the
left lateral ventricle and along the
falcotentorial reflection (arrowhead).
B, Coronal CTA reformat shows a
solitary contrast density within the
superior hematoma consistent with
the CTA spot sign (white arrow).
Linear density below represents partial
voluming of cortical vessel.
(C–D) Fluid-attenuated inversion
recovery and multiplanar gradient
recalled echo 4 days later
demonstrates an increase in
hematoma size measured at 29 cm3
consistent with hematoma
enlargement. Intraventricular hge is
also increased (asterisk) in size.
Subarachnoid and falcotentorial blood
(arrowheads) is demonstrated but no
microbleeds were present.
C
36
A 44-year-old woman presented with headache and right sided weakness.
(A) Non-contrast CT scan showing a left parietal intracerebral hge (18.4 ml) with a small
associated left frontal subdural hge.
(B) Coronal maximum intensity projection image of CT angiogram in spot windows showing
a left parietal arteriovenous fistula (arrowheads) with a separate small focus of contrast
pooling within the intracerebral hge (arrow), consistent with a spot sign. The patient
underwent endovascular embolization of the arteriovenous fistula and was discharged home
9 days after admission.
37
38-year-old male with a right frontal oligodendroglioma. A, NCCT
demonstrates punctuate peripheral calcification, (white arrow) within the
hematoma (white asterisk). B, Hyperdensity apparent on CTA axial
source images – the spot sign.
38
A 53-year-old man was admitted
with SAH and a right temporal ICH
adjacent to the sylvian fissure (A
and C; the first CT). Initially, his
clinical condition was stable, with
a GCS score of E3M6V3 and a
left-sided paralysis. A few hours
later, the patient had to be
intubated because of sudden
neurologic deterioration
accompanied by progressive
respiratory failure. Subsequent
CTA (E and F) showed active
extravasation; the arrow indicates
contrast leakage into the
hematoma from a middle cerebral
artery aneurysm into the
expanding ICH (B and D, second
CT). His neurologic condition
worsened to a GCS score of
E1M1Vtube with bilateral, fixed,
dilated pupils and brainstem
dysfunction, and he died soon
after admission.
39
Axial non-contrast CT on admission (a) showed a large parenchymal haema-
toma in the right frontotemporal lobe.(b–d) Coronal reformats of dynamic CT
angiography (dCTA) in arterial and late venous phase (44 s) showed develop-
ment of an area of ‘‘spot sign’’ (arrow in c).
a b C
Dynamic CT angiography (dCTA) demonstrates temporal wash-in and wash-out of
intravenous contrast material over a chosen temporal resolution. This allows temporal
visualisation of contrast flowing through vessels. dCTA is a non-invasive technique to
acquire a time series of bone subtracted or unsubtracted CT angiogram images of the
whole brain, thus removing timing uncertainties found in typical static CT angiogram
images. This approach also provides temporal flow information.
40
Axial dCTA images in arterial (d) and late venous
phase (e)(49 s) shows development of another
two areas of contrast extravasation (arrows). An
axial CT image on day 2 (f) shows expansion of
the haematoma with intraventricular hge.
d e f
41
Oblique sagittal sections of the dynamic CT angiography (dCTA) sequence show the evolution of ‘‘spot signs’’
at (a) 34 s, (b) 39 s, (c) 44 s, (d) 49 s and (e) 60 s. (f) Post-contrast brain immediately following dCTA at the
level of superior ‘‘spot sign’’ shows fading of the superior ‘‘spots’’.
a b c
d e f
42
The Spot Sign Score in Primary Intracerebral Hge
Identifies Patients at Highest Risk of In-Hospital
Mortality and Poor Outcome Among Survivors.
Stroke 2010;41:54-60.
• Spot signs were identified in 133 of 573 CTAs
(23.2%), 11 of which were delayed spot signs (8.3%).
• The presence of any spot sign increased the risk of
in-hospital mortality (55.6%, OR 4.0, 95% CI 2.6 to
5.9, P<0.0001) and poor outcome among survivors at
3-month follow-up (50.8%, OR 2.5, 95% CI 1.4 to 4.3,
P<0.0014). The spot sign score successfully
predicted an escalating risk of both outcome
measures.
• In multivariate analysis, the spot sign score was an
independent predictor of in-hospital mortality (OR
1.5, 95% CI 1.2 to 1.9, P<0.0002) and poor outcome
among survivors at 3-month follow-up (OR 1.6, 95%
CI 1.1 to 2.1, P<0.0065).
43
Systematic Characterization of the Computed
Tomography Angiography Spot Sign in Primary ICH
Identifies Patients at Highest Risk for Hematoma
Expansion: The Spot Sign Score. Stroke 2009;40:2994-3000.
• Spot signs were identified in 71 of 367 CT angiograms (19%), 6 of
which were delayed spot signs (8%). The presence of any spot sign
increased the risk of significant hematoma expansion (69%, OR=92,
P<0.0001).
• Among the spot sign characteristics examined, the presence of ≥3
spot signs, a maximum axial dimension ≥5 mm, and maximum
attenuation ≥180 Hounsfield units were independent predictors of
significant hematoma expansion, and these were subsequently
used to construct the spot sign score.
• In multivariate analysis, the spot sign score was the strongest
predictor of significant hematoma expansion, independent of time
from ictus to CT angiogram evaluation.
• Conclusion— The spot sign score predicts significant hematoma
expansion in primary intracerebral hemorrhage. If validated in other
data sets, it could be used to select patients for early hemostatic
therapy.
44
The Spot Sign in Intracerebral Hemorrhage: The
Importance of Looking for Contrast Extravasation.
Cerebrovasc Dis 2010;29:217-220.
• 28 patients of spontaneous ICH who presented within 4 hours were
studied with CTA.
• 11/27 (40.7%) had a positive spot sign and 13/22 (59.1%) had CE.
• Contrast extravasation (CE) is seen on routine head CT following
CTA as pooling of contrast within the hematoma.
• Both the spot sign and CE were associated with ICH growth (p <
0.001) and poor outcome (p < 0.001).
• Conclusions: In ICH patients, the presence of the spot sign or CE is
highly correlated with early ICH growth. CE is a more sensitive
predictor of ICH growth with a better negative predictive value than
the spot sign; CE is more consistently identified even by experienced
clinicians. Post contrast CT should be done routinely after CTA in
patients presenting with ICH within 4 h.
• Patients who are CE-positive may be candidates for hemostatic
therapies or early surgical intervention.
45
CT angiography spot sign predicts in-hospital
mortality in patients with secondary
intracerebral hemorrhage.
J NeuroIntervent Surg doi:10.1136/neurintsurg-2011-010061.
• Spot signs were identified in 31 of 215 patients with SICH (14.4%),
four of which were delayed spot signs (12.9%). Spot signs were
most common in patients with arteriovenous fistulas (42%),
Moyamoya (40%), elevated admission blood glucose (23%) and
large intraventricular hemorrhage volumes (29%).
• Spot signs were most predictive of in-hospital mortality in patients
with aneurysms of the anterior cerebral artery (100%) and anterior
communicating artery (75%).
• In univariate analysis, the presence of a spot sign significantly
increased the risk of in-hospital mortality in patients with SICH
(38.7%, OR 2.2, 95% CI 1.0 to 4.9, p=0.0497). However, in
multivariate logistic regression analysis the admission Glasgow
Coma Scale was the only independent predictor of in-hospital
mortality in patients with SICH (OR 2.8, 95% CI 1.6 to 5.1, p=0.0004).
46
Contrast Extravasation on CT Predicts Mortality in Primary
Intracerebral Hemorrhage. Am J Neuroradiol 2008;29:520–25.
56 patients of Primary ICH were studied.
• Of these, spot sign was seen in 17.9% (10/56) of patients
on initial CTA and contrast extravasation in 23.2%
(13/56) of patients on initial CECT following CTA.
Univariate analysis showed that increased mortality was
associated with
– the presence of extravasation on CT,
– large initial hematoma size (30 mL),
– the presence of “swirl sign” on NCCT,
– the Glasgow Coma Scale and ICH scores, and
– international normalized ratio.
• On multivariate analysis, only contrast extravasation on
CT (P =.017) independently predicted mortality.
• Contrast extravasation on CT (P =.001) was also an
independent predictor of hematoma growth on
multivariate analysis.
47
Contrast Extravasation on Computed Tomography
Angiography Predicts Clinical Outcome in Primary ICH
A Prospective Study of 139 Cases.
Stroke 2011;42:3441-3446.
A total of 139 patients with primary intracerebral hge were analyzed. Contrast
extravasation occurred in 30 (21.6%) patients. The presence of contrast
extravasation was associated with
– increased hematoma expansion (P<0.0001),
– in-hospital mortality (P=0.008),
– prolonged hospital stay (P=0.006),
– poor outcome on discharge (P=0.025),
– increased 3-month mortality (P=0.009), and
– poor clinical outcome (P<0.0001).
In multivariate analysis, contrast extravasation was a promising independent
predictor for 90-day poor clinical outcome followed by the presence of
intraventricular hge and initial hematoma volume.
Conclusions—The presence of contrast extravasation on multidetector CT
angiography in patients with hyperacute-stage intracerebral hemorrhage is
an independent and strong factor associated with poor outcome. Any
patient with intracerebral hemorrhage with such sign on multidetector CT
angiography should be monitored intensely and treated accordingly.
48
Postcontrast CT Extravasation Is Associated With
Hematoma Expansion in CTA Spot Negative Patients.
Stroke. 2009; 40: 1672-1676.
• A retrospective study of 61 patients presenting within 6 hours of primary
ICH onset imaged with CT angiography (CTA) and (Post Contrast CT)
PCCT. Presence of CTA spot sign and PCL (Post contrast leakage) were
documented. PCL was defined as the presence of contrast extravasation
on the PCCT study at a location remote from the CTA spot sign if
present.
• PCL was present in 11/61 patients (18%), occurring in 5 without a spot
sign (45%). Spot negative PCL patients demonstrated larger absolute
(P=0.02) and percentage hematoma growth (P=0.02) compared to those
without PCL. The mean volume and percent increase was 6.7 mL and
26%, respectively. Inclusion of PCL together with CTA spot sign as risk
factor for hematoma expansion increased sensitivity from 0.78 (95% CI;
0.52 to 0.94) to 0.94 (95% CI; 0.72 to 1.00) and NPV from 0.90 (95% CI; 0.76
to 0.97) to 0.97 (95% CI; 0.85 to 1.00).
• Conclusion— Inclusion of PCCT in the investigation of ICH patients
allows detection of PCL which, together with the CTA spot sign,
increases sensitivity and negative predictive value for predicting
hematoma expansion. This finding should be validated in larger studies.
49
Early Rate of Contrast Extravasation in
Patients with Intracerebral Hemorrhage.
AJNR 2011;32:1879-1884.
• CT was performed at admission and at 24
hours for 16 patients with ICH with/without
contrast extravasation seen on CTA and
post–contrast-enhanced CT (PCCT).
• Hematoma volume increased from 34.1 ± 41.0
mL to 40.2 ± 46.1 mL in extravasation-
positive patients and decreased from 19.8 ±
31.8 mL to 17.4 ± 27.3 mL in extravasation-
negative patients.
50
CT Angiography “Spot Sign” Predicts Hematoma Expansion in Acute
Intracerebral Hemorrhage. Stroke 2007;38:1257-1262.
The Diagnostic Performance Measures Of Spot Sign For
Hematoma Expansion.
Sensitivity, %
(95% CI)
Specificity, %
(95% CI)
PPV, %
(95% CI)
NPV, %
(95% CI)
+LR
(95% CI)
−LR
(95% CI)
Spot sign 91 %
(62–100)
89 %
(72–96)
77 %
(50–92)
96 %
(81–99)
8.5
(2.9–25)
0.1
(.02–0.7)
Extrava-
sation (CE)
45 %
(21–72)
96 %
(82–100)
83 %
(43–99)
81 %
(66–91)
12.7
(1.7–97)
0.6
(0.3–0.9)
Anticoa-
gulation
45 (21–72) 79 (63–94) 79 (61–90) 45 (21–72) 2 (0.8–
5.5)
0.7 (0.4–
1.2)
MAP >120
mm Hg
36 (15–65) 61 (42–76) 27 (11–52 71 (51–85) 0.9 (0.4–
2.3)
1.0 (0.6–
1.8)
History of
hypertension
54 (28–79) 57 (39–73) 33 (16–56) 76 (54–89) 1.3 (0.6–
2.5)
0.8 (0.4–
1.6)
Glucose >8.3 18 (5–48) 71 (53–85) 20 (5–51) 69 (51–83) 0.6 (0.2–
2.5)
1.1 (0.8–
1.6)
PPV indicates positive predictive value; NPV, negative predictive value; and LR, likelihood ratio, the preferred
way to represent a single summary result of a diagnostic test. It estimates the posttest odds of an outcome
(significant increase in ICH volume) changed relative to the pretest odds.
51
Prediction of haematoma growth and outcome in patients with
intracerebral haemorrhage using the CT-angiography spot sign
(PREDICT): a prospective observational study.
Lancet Neurol 2012;11:307–14.
Sensi-
tivity
Speci-
ficity
PPV NPV Mortality
CTA spot sign
positive
60 % 90% 73 % 84 % 43.4%
(23 of 53)
Contrast
Extravasation
50 % 85 % 58 % 80 %
CTA Spot
sign negative
19.6%
(31 of 158)
268 patients were enrolled in 12 centres in six countries from
June 24, 2006, to Sept 6, 2010. No adverse events were reported
directly attributable to the CT angiogram.
Diagnostic Performance Measures for an haematoma
expansion >6 mL or >33%
52
Accuracy of the Spot Sign for the Prediction of In-Hospital
Mortality and Poor Outcome Among Survivors in Primary ICH
Accuracy In-Hospital Poor Outcome*
Parameter______Mortality (95% CI) (95% CI) ______
Sensitivity 41% (34–49) 23 % (17–32)
Specificity 85 % (81–88) 89 % (85–92)
PPV 56 % (47–64) 51 % (38–64)
NPV 76 % (72–80) 70 % (65–75)
Positive LR 2.7 (2.0–3.7) 2.2 (1.4–3.4)
Negative LR 0.69 (0.61–0.78) 0.86 (0.78–0.95)
Accuracy 71 % 67 %
Prevalence 31 % 33 %
For sensitivity, specificity, PPV, NPV, accuracy, and prevalence, the numbers in the
table represent percentages. The numbers in parenthesis represent the 95% CI.
*Defined as a modified Rankin Scale of 4 at 3-month follow-up among the 393
survivors. ICH indicates intracerebral hemorrhage; CI, confidence interval; PPV,
positive predictive value; NPV, negative predictive value; LR, likelihood ratio.
53
CONCLUSION
• The Spot Sign is a potentially promising
sign for predicting hematoma expansion.
• This sign may play a role in patient
selection for clinical trials of acute
hemostatic therapy or surgical
interventions aimed at minimizing
hematoma growth.
• Correct recognition of the sign and
exclusion of secondary ICH causes will
be crucial to the success of such studies.
CONCLUSION
• Clinicians should be aware of the Spot
Sign mimics, classified as either
vascular or nonvascular. Nonvascular
causes are easily distinguished with
NCCT but may be misinterpreted as
contrast density in its absence.
• The presence of a vessel extending
from brain or ventricular surface into a
hematoma strongly suggests the
presence of underlying vascular
malformation. 54
55
TAKE HOME MESSAGE
• CT Angiogram can be done immediately
after an intracerebral hemorrahage.
• Spot sign should be specifically looked
for in a CT angiogram.
• After a CTA, a post contrast CT of the
Brain should be done to detect the
presence of Contrast Extravasation.
• Presence of Spot Sign or Contrast
Extravasation predicts poor outcome
and such patients should be vigorously
treated.
THANK
YOU
56
57
REFERENCES
1. The Spot Sign in Intracerebral Hemorrhage: The Importance of
Looking for Contrast Extravasation. Cerebrovasc Dis 2010;29:217-220.
2. The Spot Sign Score in Primary Intracerebral Hemorrhage Identifies
Patients at Highest Risk of In-Hospital Mortality and Poor Outcome
Among Survivors. Stroke 2010;41:54-60.
3. Contrast Extravasation on CT Predicts Mortality in Primary
Intracerebral Hemorrhage. Am J Neuroradiol 2008;29:520–25.
4. CT Angiography “Spot Sign” Predicts Hematoma Expansion in Acute
Intracerebral Hemorrhage. Stroke 2007;38:1257-1262.
5. Systematic Characterization of the Computed Tomography
Angiography Spot Sign in Primary ICH Identifies Patients at Highest
Risk for Hematoma Expansion: The Spot Sign Score. Stroke
2009;40:2994-3000.
6. CT angiography spot sign predicts in-hospital mortality in patients
with secondary intracerebral hemorrhage. J NeuroIntervent Surg
doi:10.1136/neurintsurg-2011-010061.
7. Contrast Extravasation on Computed Tomography Angiography
Predicts Clinical Outcome in Primary ICH: A Prospective Study of 139
Cases. Stroke 2011;42:3441-3446.
58
REFERENCES
8. Early Rate of Contrast Extravasation in Patients with Intracerebral
Hemorrhage. AJNR 2011;32:1879-1884.
9. Intracerebral haemorrhage. Lancet 2009;373:1632-644.
10. Diagnostic Accuracy and Yield of Multidetector CT Angiography in the
Evaluation of Spontaneous Intraparenchymal Cerebral Hemorrhage.
Am J Neuroradiol 2009;30:1213–221.
11. Early Rate of Contrast Extravasation in Patients with Intracerebral
Hemorrhage. AJNR 2011 32: 1879-1884.
12. Options to Restrict Hematoma Expansion After Spontaneous
Intracerebral Hemorrhage. Stroke 2010;41:402-409.
13. Spot sign and live-imaged dramatic intracerebral hematoma
expansion. Neurology 2010;75;834.
14. Postcontrast CT Extravasation Is Associated With Hematoma
Expansion in CTA Spot Negative Patients. Stroke 2009; 40: 1672-1676.
15. Vascular and Nonvascular Mimics of the CT Angiography ''Spot Sign''
in Patients With Secondary Intracerebral Hemorrhage. Stroke 2008,
39:1177-1183.
16. Dynamic nature of the CT angiographic ‘‘spot sign’’. The British
Journal of Radiology 2010;83:e216–e219.
59
REFERENCES
17. Diagnostic cerebral angiography in spontaneous intracranial
haemorrhage: a guide for developing countries.
Asian J Surg 2005;28(1):1-6.
18. Radiological Investigation of Spontaneous Intracerebral
Hemorrhage: Systematic Review and Trinational Survey.
Stroke 2010; 41: 685-690.
19. The risk of recurrent stroke after intracerebral haemorrhage.
J Neurol Neurosurg Psychiatry 2007;78:836–840.
20. Natural History of Perihematomal Edema After Intracerebral
Hemorrhage Measured by Serial Magnetic Resonance Imaging.
Stroke 2011;42:73-80.
21. Guidelines for the Management of Spontaneous Intracerebral
Hemorrhage : A Guideline for Healthcare Professionals From the
American Heart Association/American Stroke Association. Stroke
2010, 41:2108-2129.
22. Prediction of haematoma growth and outcome in patients with
intracerebral haemorrhage using the CT-angiography spot sign
(PREDICT): a prospective observational study.
Lancet Neurol 2012;11:307–14.
60
Definitions of Classes and Levels of Evidence Used in
AHA Stroke Council Recommendations
Class I Conditions for which there is evidence for and/or general agreement that the
procedure or treatment is useful and effective
Class II Conditions for which there is conflicting evidence and/or a divergence of opinion
about the usefulness/efficacy of a procedure or Treatment
Class IIa: the weight of evidence or opinion is in favor of the procedure or treatment
Class IIb: usefulness/efficacy is less well established by evidence or opinion
Class III Conditions for which there is evidence and/or general agreement that the procedure
or treatment is not useful/effective and in some cases may be harmful
Therapeutic recommendations: Level of Evidence
Level of
Evidence A
Data derived from multiple randomized clinical trials
Evidence B Data derived from a single randomized trial or nonrandomized studies
Evidence C Consensus opinion of experts
Diagnostic / prognostic recommendations: Level of Evidence
Level of
Evidence A
Data derived from multiple prospective cohort studies using a reference standard
applied by a masked evaluator
Level of
Evidence B
Data derived from a single grade A study or 1 case-control studies or studies using a
reference standard applied by an unmasked Evaluator
Evidence C Consensus opinion of experts
61
Diagnostic Accuracy and Yield of Multidetector CT
Angiography in the Evaluation of Spontaneous
Intraparenchymal Cerebral Hemorrhage. Am J
Neuroradiol 2009;30:1213–221.`
• A study of 623 patients with ICH examined with
MDCTA identified clinical and NCCT
characteristics that independently predicted an
increased incidence of a vascular lesion as the
ICH etiology:
– age younger than 46 years (47%),
– neither known hypertension nor impaired coagulation
at presentation (33%),
– lobar (20%) or infratentorial (16%) ICH location, and
– female sex (18%).
62
Prediction of haematoma growth and outcome in patients with
intracerebral haemorrhage using the CT-angiography spot sign
(PREDICT): a prospective observational study.
Lancet Neurol 2012;11:307–14.
• 268 patients were enrolled in 12 centres in six countries from June
24, 2006, to Sept 6, 2010. No adverse events were reported directly
attributable to the CT angiogram.
• For an haematoma expansion >6 mL or >33%, the PPV for the CTA
spot sign was 73%, and the NPV was 84%, with 63% sensitivity and
90% specificity. For haematoma expansion, contrast extravasation
assessed by site investigator had a PPV of 58%, NPV of 80%, 50%
sensitivity, and 85% specificity.
• Mortality at 3 months was 43.4% (23 of 53) in the CTA spot-sign
positive group versus 19.6% (31 of 158) in the CTA spot-sign
negative group (age-adjusted hazard ratio, HR 2.4, 95% CI 1.4–4.0;
p=0.002). The association between CTA spot-sign positive group
and mortality remained significant in a sensitivity analysis whether
patients lost to follow-up were assigned a mRS of 0 or 6. Kaplan-
Meier analysis revealed an early difference in mortality between
CTA spot-sign positive and CTA spot-sign negative groups, which
was sustained during the follow-up period (p=0.0006).

The spot sign

  • 1.
  • 2.
    2 THE SPOT SIGN DR.QUAMRUDDIN AHMAD DEPARTMENT OF NEUROLOGY RAJSHAHI MEDICAL COLLEGE
  • 3.
    3 Spontaneous or Primary IntracerebralHaemorrhage • Accounting for 10 – 30% of first - ever strokes. • The 30 day mortality for ICH has been reported to be 30 – 55%, with • Half the deaths occurring in the acute phase, especially in the first 48 h.
  • 4.
    4 COMPLICATIONS OF INTRA CEREBRALHAEMORRHAGE 1. Haematoma Expansion (HE), 2. Perihaematomal Oedema (PHE), 3. Intraventricular Extension of Haemorrhage (IVH) with Hydrocephalus, 4. Seizures and Epilepsy, 5. Venous Thromboembolic Events (VTE), 6. Fever and Infections, 7. Hyperglycaemia, and 8. Increased Blood Pressure (BP).
  • 5.
    5 Haematoma Expansion (HE) • Definedas an increase in volume of 33 – 50% or an absolute change in haematoma volume of 12.5 – 20 mL (on repeat CT), • Early HE occurs in 18–38% of patients scanned within 3 h of ICH onset, and more than 70% develop at least some extent of HE within 24 h of symptom onset, even in the absence of known coagulopathy, suggesting an active bleeding process in the hyperacute phase of ICH. COMPLICATIONS OF ICH 1. Haematoma Expansion (HE), 2. Perihaematomal Oedema (PHE), 3. Intraventricular Extension of Hge (IVH) with Hydrocephalus, 4. Seizures and Epilepsy, 5. Venous Thromboembolic Events (VTE), 6. Fever and Infections, 7. Hyperglycaemia, 8. Increased Blood Pressure (BP),
  • 6.
    6 Haematoma Expansion (HE) (contd.) •In warfarin-associated ICH, 27–54% of patients develop early HE and a delayed expansion because of protracted bleeding, • It is associated with up to 70% increase in mortality. • HE is an independent predictor of poor outcome and increased mortality.
  • 7.
    7 Haematoma Expansion (HE) •Findings from a meta-analysis of 218 patients with ICH who had CT scans within 3 h of onset and follow-up scans within 24 h showed that for every 10% increase in ICH growth there was a 5% increased risk of death, a 16% increased risk of worsening outcome as measured with the modified Rankin score (mRS), and an 18% increased likelihood of being dependent or of a poor outcome on the Barthel index.
  • 8.
    8 • Hyperacute expansion of haematomain a patient with intracerebral hge on serial CT scans. Small haematoma detected in the basal ganglia and thalamus (A). Expansion of haematoma after 151 min (B). Continued progression of haematoma after another 82 min (C). Stabilisation of haematoma after another 76 min (D). A B C D
  • 9.
    9 • Progression ofhaema- toma and perihaema- tomal oedema in a patient with ICH on serial CT scans. First scan (E) was acquired before the ICH. Perihaematoma oedema is high-lighted in green to facilitate recognition of progression of oedema. At 4 h after symptom onset there is a small haematoma in the basal ganglia (F). Expansion of haema- toma with extension into the lateral ventricle and new mass effect and midline shift at 14 h (G). Worsening hydrocephalus and early perihaematomal oedema at 28 h (H). Continued mass-effect with prominent perihaematomal oedema at 73 h (I). Resolving haematoma with more prominent perihaematomal oedema at 7 days (J). E F G H I J
  • 10.
    10 Haematoma Expansion (HE) Management Interventionsto restrict HE include: * haemostatic therapy, * cautious lowering of high BP, * quick reversal of prior anticoagulation, and * surgical evacuation.
  • 11.
  • 12.
  • 13.
    13 The Spot Sign •Defined as the presence of active contrast extravasation into the hematoma at the time of multi-detector CT angiography (MDCTA). • The ‘spot sign’ is a bright spot of 1 to 2 mm focus of enhancement within a hematoma on the CT angiographic axial source and multiplanar reformatted (MPR) images as assessed by simple visual inspection.
  • 14.
    14 The Spot Sign Itis an indicator of active hemorrhage and has been associated with an increased risk of significant hematoma expansion and mortality in patients with ICH.
  • 15.
    • Baseline noncontrastCT shows heterogeneous right deep parenchymal hemorrhage (A). • Subsequent CT angiography demonstrates hematoma progression with significant enlargement and new intraventricular extension. A small focus of enhancement is seen within the lesion consistent with spot sign (B) (arrow). • Control noncontrast CT shows increased size of the hemorrhage with substantial mass effect, subfalcine herniation, and midline shift (C).
  • 16.
    16 CT scan ofan 83-year- old woman with acute onset of left sided weakness. (A–D) Nonenhanced CT (contiguous 5 mm slices shown) with a right fronto-parietal hemorrhage. (E–L) CT angiogram (contiguous 0.625 mm slices shown) with normal cerebral vascular enhancement and a punctuate focus of intrahematomal contrast (arrow) – spot sign. (M–P) Nonenhanced CT (contiguous 5 mm slices shown) performed 1 hour later with evidence of hematoma expansion.
  • 17.
    17 MDCTA – Multidetector CTAngiography • MDCTA is rapidly becoming the favored diagnostic examination in the initial evaluation of patients presenting to the emergency department with ICH, due to its: – widespread availability, – rapidity of acquisition, – lower cost, and – favorable risk profile compared with conventional catheter angiography,
  • 18.
    18 MDCTA – Multidetector CTAngiography • MDCTA is highly accurate for the detection of underlying vascular lesions in patients with ICH, with reported sensitivities ranging from 89% to 96% and specificities of 92% to 100%.
  • 19.
    19 MULTI - DETECTOR CTANGIOGRAPHY (MDCTA) • MDCTA is performed by scanning from the base of the C1 vertebral body to the vertex using an axial technique, 0.5 pitch, 1.25-mm collimation, 350 maximal mA, 120 kVp, 22-cm field of view, and 65 to 85 mL of iodinated contrast material administered by power injector at 4 to 5 mL per second into an antecubital vein with either a fixed 25-second delay between the onset of contrast injection and the start of scanning, or Smart-Prep, a semiautomatic contrast bolus triggering technique.
  • 20.
    20 MULTI - DETECTOR CTANGIOGRAPHY (MDCTA) • Subsequently, the 1.25-mm axial CTA source images is reviewed in “spot windows” (width 200, level 110) to determine the presence of active contrast extravasation, the spot sign, according to the following strict radiological criteria:
  • 21.
    21 The Spot SignScore in Primary Intracerebral Hemorrhage Identifies Patients at Highest Risk of In-Hospital Mortality and Poor Outcome Among Survivors. Stroke 2010;41:54-60. • Spot Sign Criteria –1 focus of contrast pooling within the ICH, –Attenuation 120 Hounsfield units, –Discontinuous from normal or abnormal vasculature adjacent to the ICH, –Any size and morphology.
  • 22.
    22 A 64-year-old womanpresented with the ‘worst headache of her life’ followed by obtundation. (A) Non-contrast CT (NCCT) scan showing a left inferior frontal ICH (24.8 ml) with associated intraventricular hge (55 ml) and SAH in the basal cisterns. (B) CT angiogram source image in spot windows showing an aneurysm of the A2 segment of the right anterior cerebral artery (arrowhead) with a separate focus of contrast pooling within the intracerebral hge (arrow), consistent with a spot sign. (C) Follow-up NCCT scan 3.5 h after the baseline CT angiogram showing marked interval increase in the size of the intracerebral hemorrhage (72.6 ml) and the intraventricular hemorrhage (215.2 ml). The patient died shortly after the follow-up NCCT scan.
  • 23.
    23 A 67-year-old manon warfarin therapy for atrial fibrillation and daily aspirin intake presents with syncope and increasing unresponsiveness (admission INR, 2.7). A, NCCT demonstrates a right thalamic ICH (24 mL) with associated IVH (6 mL). B, Axial CTA source image in spot windows demonstrates 3 foci of contrast pooling within the ICH (arrowheads), consistent with spot signs. The largest spot sign measures 10 mm in maximum axial dimension. C, Delayed CTA acquisition 48 seconds after the first-pass CTA shows that the spot signs increased in volume and changed in morphology (arrowheads). D, NCCT 8 hours after the baseline CTA demonstrates marked interval expansion of both the ICH (94 mL) and IVH (82 mL). The patient died shortly after the follow-up NCCT.
  • 24.
    24 ● A 69-year-oldman underwent imaging 2 hours following onset of right-sided paralysis. ● A, Admission NCCT demonstrates left thalamic hematoma with extension of hge into the third ventricle. ● Admission CTA (B) and CECT (C), respectively, show 2 foci of active extravasation (arrows). ● D, Follow-up NCCT 12 hours later shows marked hematoma growth with hemorrhage in both lateral ventricles and severe hydrocephalus. ● The patient had a fatal outcome.
  • 25.
    25 A B C D CTangiogram showing contrast extravasation Arrowheads indicate contrast extravasation. Spot-sign score: 1 (A), 2 (B), 3(C), and 4 (D). The spot-sign score, which is used to grade the number of spot signs and their maximum dimensions and attenuation, is the strongest predictor of HE and is an independent predictor of in-hospital mortality and poor outcome in people with ICH.
  • 26.
    26 Calculation of the SpotSign Score • Spot Sign Characteristic* Points No. of spot signs 1– 2 1 3 2 • Maximum axial dimension 1– 4 mm 0 5 mm 1 • Maximum attenuation 120–179 HU 0 180 HU 1 * The spot sign characterization is performed in the first CTA acquisition in which a spot sign is identified. For CTAs with more than 1 spot sign, the maximum dimension in a single axial CTA source image and maximum attenuation of the largest spot sign is determined. The spot sign score is obtained by adding the total No. of points for the CTA. HU indicates Hounsfield unit; CTA, CT angiogram.
  • 27.
    27 • Patient withspot sign, demonstrating extravasation and hematoma expansion. CT slice selection has been optimized for hematoma configuration, not for head position. • A, Unenhanced CT demonstrates left posterior putaminal and internal capsule hematoma with mild surrounding edema. An old parieto-occipital infarct is seen posterior to this. • B, A small focus of enhancement is seen peripherally on CTA source images, consistent with the spot sign (black arrow). • C, Postcontrast CT demonstrates enlargement of the spot sign, consistent with extravasation (white arrow). • D, Unenhanced CT image 1 day after presentation reveals hematoma enlargement and intraventricular hemorrhage.
  • 28.
    28 ● An 85-year-oldwoman underwent imaging 1 hour following onset of left-sided weakness. ● A, Admission NCCT demonstrates hemorrhage in the right superior frontal gyrus. ● B, Admission CTA conspicuously reveals a focal area of high attenuation (arrow) within the hematoma consistent with active extravasation (spot sign). ● C, Admission CECT shows a slightly heterogeneous right frontal hematoma with several areas of higher attenuation, frequently seen with acute hemorrhage, which were not interpreted by the reviewer as discrete foci of contrast extravasation (as a reminder, the reviewer evaluated CTA and CECT images separately from each other). This patient survived.
  • 29.
    29 An 82-year-old man underwentimaging 0.5 hours following onset of right-sided weakness. Admission NCCT (A) and CTA (B) demonstrate hge in the left midbrain without active extravasation on CTA. C, Admission CECT, however, reveals focal high attenuation (arrow) in the left tectal plate, consistent with active extravasation. D, Follow-up NCCT 17 hours later shows hematoma expansion into the left thalamus and lateral ventricle with marked hydrocephalus. The patient had a fatal outcome.
  • 30.
    30 41-year-old female witha micro AVM. A, NCCT demonstrates centrum semiovale hematoma (white asterisk). B, A punctate focus of enhancement (white arrow) representing a pseudo- aneurysm (white arrow) on CTA axial source images mimics a CTA spot sign. C, A vessel is clearly seen extending from the lateral ventricular surface to the hematoma periphery and communicates with the focal spot of enhancement on coronal MPR image (black arrow). D, AP Oblique conventional angiographic image demons- trates a micro AVM with pseu- doaneurysm (black arrow) fed by branches of the anterior cerebral artery and draining to the lateral ventricular vein. * Discontinuous from normal or abnormal vasculature adjacent to the ICH
  • 31.
    31 55-year-old male withmoya moya. An enhancing focus is seen in the inferior Basal Ganglia/Nucleus accumbens consistent with a pseudoaneurysm (white arrow) arising from a lenticulostriate artery (white arrowhead) on (A) CTA source, (B) coronal MPR, and (C) saggital MPR images. The lenticulostriate vessel lies peripheral to the hematoma only contacting it at the site of pseudoaneurysm. Intraventricular hemorrhage and hydrocephalus incidentally noted. (Discontinuous from normal or abnormal vasculature adjacent to the ICH)
  • 32.
    32 A 53-year-old femalepatient presenting at 140 minutes. Baseline noncontrast CT (NCCT; A) demonstrates a right basal ganglia hge with mass effect on the right lateral ventricle and subfalcine herniation. Intraventricular hge (IVH) is seen within the bilateral occipital horns, right frontal horn, and third and fourth (not shown) ventricles (Graeb score 6). B, Coronal CTA reformats demonstrate a peripheral region of contrast extravasation inferiorly within the hematoma consistent with the CTA spot sign (arrow).`
  • 33.
    33 Graeb Score Intraventricular Hematoma Components •Each lateral ventricle – 1 = trace of blood – 2 = less than 50% filled – 3 = more than 50% filled – 4 = completely filled and expanded • 3th and 4th ventricles – 0 = no blood – 1 = blood present, size normal – 2 = filled with blood and expanded Calculation • Graeb score = right ventricular score + left ventricular score + 3rd ventricular score + 4th ventricular score. Hwang BY, Bruce SS, Appelboom G, Piazza MA, Carpenter AM, Gigante PR, et al. Evaluation of intraventricular hemorrhage assessment methods for predicting outcome following intracerebral hemorrhage. J Neurosurg 2012; 116:185-192.
  • 34.
    34 A 67-year-old malepatient with a history of hypertension presented with blood pressure of 200/100 mm Hg and a right thalamic intracerebral hge on noncontrast head CT (A). (B) CTA revealed no CTA spot sign.
  • 35.
    35 A 66-year-old malepatient presents with acute right-sided weakness and urinary incontinence. A, Baseline noncontrast CT (NCCT) demonstrates 20-cm3 left parieto- occipital lobar hematoma with adjacent intraventricular hge within the left lateral ventricle and along the falcotentorial reflection (arrowhead). B, Coronal CTA reformat shows a solitary contrast density within the superior hematoma consistent with the CTA spot sign (white arrow). Linear density below represents partial voluming of cortical vessel. (C–D) Fluid-attenuated inversion recovery and multiplanar gradient recalled echo 4 days later demonstrates an increase in hematoma size measured at 29 cm3 consistent with hematoma enlargement. Intraventricular hge is also increased (asterisk) in size. Subarachnoid and falcotentorial blood (arrowheads) is demonstrated but no microbleeds were present. C
  • 36.
    36 A 44-year-old womanpresented with headache and right sided weakness. (A) Non-contrast CT scan showing a left parietal intracerebral hge (18.4 ml) with a small associated left frontal subdural hge. (B) Coronal maximum intensity projection image of CT angiogram in spot windows showing a left parietal arteriovenous fistula (arrowheads) with a separate small focus of contrast pooling within the intracerebral hge (arrow), consistent with a spot sign. The patient underwent endovascular embolization of the arteriovenous fistula and was discharged home 9 days after admission.
  • 37.
    37 38-year-old male witha right frontal oligodendroglioma. A, NCCT demonstrates punctuate peripheral calcification, (white arrow) within the hematoma (white asterisk). B, Hyperdensity apparent on CTA axial source images – the spot sign.
  • 38.
    38 A 53-year-old manwas admitted with SAH and a right temporal ICH adjacent to the sylvian fissure (A and C; the first CT). Initially, his clinical condition was stable, with a GCS score of E3M6V3 and a left-sided paralysis. A few hours later, the patient had to be intubated because of sudden neurologic deterioration accompanied by progressive respiratory failure. Subsequent CTA (E and F) showed active extravasation; the arrow indicates contrast leakage into the hematoma from a middle cerebral artery aneurysm into the expanding ICH (B and D, second CT). His neurologic condition worsened to a GCS score of E1M1Vtube with bilateral, fixed, dilated pupils and brainstem dysfunction, and he died soon after admission.
  • 39.
    39 Axial non-contrast CTon admission (a) showed a large parenchymal haema- toma in the right frontotemporal lobe.(b–d) Coronal reformats of dynamic CT angiography (dCTA) in arterial and late venous phase (44 s) showed develop- ment of an area of ‘‘spot sign’’ (arrow in c). a b C Dynamic CT angiography (dCTA) demonstrates temporal wash-in and wash-out of intravenous contrast material over a chosen temporal resolution. This allows temporal visualisation of contrast flowing through vessels. dCTA is a non-invasive technique to acquire a time series of bone subtracted or unsubtracted CT angiogram images of the whole brain, thus removing timing uncertainties found in typical static CT angiogram images. This approach also provides temporal flow information.
  • 40.
    40 Axial dCTA imagesin arterial (d) and late venous phase (e)(49 s) shows development of another two areas of contrast extravasation (arrows). An axial CT image on day 2 (f) shows expansion of the haematoma with intraventricular hge. d e f
  • 41.
    41 Oblique sagittal sectionsof the dynamic CT angiography (dCTA) sequence show the evolution of ‘‘spot signs’’ at (a) 34 s, (b) 39 s, (c) 44 s, (d) 49 s and (e) 60 s. (f) Post-contrast brain immediately following dCTA at the level of superior ‘‘spot sign’’ shows fading of the superior ‘‘spots’’. a b c d e f
  • 42.
    42 The Spot SignScore in Primary Intracerebral Hge Identifies Patients at Highest Risk of In-Hospital Mortality and Poor Outcome Among Survivors. Stroke 2010;41:54-60. • Spot signs were identified in 133 of 573 CTAs (23.2%), 11 of which were delayed spot signs (8.3%). • The presence of any spot sign increased the risk of in-hospital mortality (55.6%, OR 4.0, 95% CI 2.6 to 5.9, P<0.0001) and poor outcome among survivors at 3-month follow-up (50.8%, OR 2.5, 95% CI 1.4 to 4.3, P<0.0014). The spot sign score successfully predicted an escalating risk of both outcome measures. • In multivariate analysis, the spot sign score was an independent predictor of in-hospital mortality (OR 1.5, 95% CI 1.2 to 1.9, P<0.0002) and poor outcome among survivors at 3-month follow-up (OR 1.6, 95% CI 1.1 to 2.1, P<0.0065).
  • 43.
    43 Systematic Characterization ofthe Computed Tomography Angiography Spot Sign in Primary ICH Identifies Patients at Highest Risk for Hematoma Expansion: The Spot Sign Score. Stroke 2009;40:2994-3000. • Spot signs were identified in 71 of 367 CT angiograms (19%), 6 of which were delayed spot signs (8%). The presence of any spot sign increased the risk of significant hematoma expansion (69%, OR=92, P<0.0001). • Among the spot sign characteristics examined, the presence of ≥3 spot signs, a maximum axial dimension ≥5 mm, and maximum attenuation ≥180 Hounsfield units were independent predictors of significant hematoma expansion, and these were subsequently used to construct the spot sign score. • In multivariate analysis, the spot sign score was the strongest predictor of significant hematoma expansion, independent of time from ictus to CT angiogram evaluation. • Conclusion— The spot sign score predicts significant hematoma expansion in primary intracerebral hemorrhage. If validated in other data sets, it could be used to select patients for early hemostatic therapy.
  • 44.
    44 The Spot Signin Intracerebral Hemorrhage: The Importance of Looking for Contrast Extravasation. Cerebrovasc Dis 2010;29:217-220. • 28 patients of spontaneous ICH who presented within 4 hours were studied with CTA. • 11/27 (40.7%) had a positive spot sign and 13/22 (59.1%) had CE. • Contrast extravasation (CE) is seen on routine head CT following CTA as pooling of contrast within the hematoma. • Both the spot sign and CE were associated with ICH growth (p < 0.001) and poor outcome (p < 0.001). • Conclusions: In ICH patients, the presence of the spot sign or CE is highly correlated with early ICH growth. CE is a more sensitive predictor of ICH growth with a better negative predictive value than the spot sign; CE is more consistently identified even by experienced clinicians. Post contrast CT should be done routinely after CTA in patients presenting with ICH within 4 h. • Patients who are CE-positive may be candidates for hemostatic therapies or early surgical intervention.
  • 45.
    45 CT angiography spotsign predicts in-hospital mortality in patients with secondary intracerebral hemorrhage. J NeuroIntervent Surg doi:10.1136/neurintsurg-2011-010061. • Spot signs were identified in 31 of 215 patients with SICH (14.4%), four of which were delayed spot signs (12.9%). Spot signs were most common in patients with arteriovenous fistulas (42%), Moyamoya (40%), elevated admission blood glucose (23%) and large intraventricular hemorrhage volumes (29%). • Spot signs were most predictive of in-hospital mortality in patients with aneurysms of the anterior cerebral artery (100%) and anterior communicating artery (75%). • In univariate analysis, the presence of a spot sign significantly increased the risk of in-hospital mortality in patients with SICH (38.7%, OR 2.2, 95% CI 1.0 to 4.9, p=0.0497). However, in multivariate logistic regression analysis the admission Glasgow Coma Scale was the only independent predictor of in-hospital mortality in patients with SICH (OR 2.8, 95% CI 1.6 to 5.1, p=0.0004).
  • 46.
    46 Contrast Extravasation onCT Predicts Mortality in Primary Intracerebral Hemorrhage. Am J Neuroradiol 2008;29:520–25. 56 patients of Primary ICH were studied. • Of these, spot sign was seen in 17.9% (10/56) of patients on initial CTA and contrast extravasation in 23.2% (13/56) of patients on initial CECT following CTA. Univariate analysis showed that increased mortality was associated with – the presence of extravasation on CT, – large initial hematoma size (30 mL), – the presence of “swirl sign” on NCCT, – the Glasgow Coma Scale and ICH scores, and – international normalized ratio. • On multivariate analysis, only contrast extravasation on CT (P =.017) independently predicted mortality. • Contrast extravasation on CT (P =.001) was also an independent predictor of hematoma growth on multivariate analysis.
  • 47.
    47 Contrast Extravasation onComputed Tomography Angiography Predicts Clinical Outcome in Primary ICH A Prospective Study of 139 Cases. Stroke 2011;42:3441-3446. A total of 139 patients with primary intracerebral hge were analyzed. Contrast extravasation occurred in 30 (21.6%) patients. The presence of contrast extravasation was associated with – increased hematoma expansion (P<0.0001), – in-hospital mortality (P=0.008), – prolonged hospital stay (P=0.006), – poor outcome on discharge (P=0.025), – increased 3-month mortality (P=0.009), and – poor clinical outcome (P<0.0001). In multivariate analysis, contrast extravasation was a promising independent predictor for 90-day poor clinical outcome followed by the presence of intraventricular hge and initial hematoma volume. Conclusions—The presence of contrast extravasation on multidetector CT angiography in patients with hyperacute-stage intracerebral hemorrhage is an independent and strong factor associated with poor outcome. Any patient with intracerebral hemorrhage with such sign on multidetector CT angiography should be monitored intensely and treated accordingly.
  • 48.
    48 Postcontrast CT ExtravasationIs Associated With Hematoma Expansion in CTA Spot Negative Patients. Stroke. 2009; 40: 1672-1676. • A retrospective study of 61 patients presenting within 6 hours of primary ICH onset imaged with CT angiography (CTA) and (Post Contrast CT) PCCT. Presence of CTA spot sign and PCL (Post contrast leakage) were documented. PCL was defined as the presence of contrast extravasation on the PCCT study at a location remote from the CTA spot sign if present. • PCL was present in 11/61 patients (18%), occurring in 5 without a spot sign (45%). Spot negative PCL patients demonstrated larger absolute (P=0.02) and percentage hematoma growth (P=0.02) compared to those without PCL. The mean volume and percent increase was 6.7 mL and 26%, respectively. Inclusion of PCL together with CTA spot sign as risk factor for hematoma expansion increased sensitivity from 0.78 (95% CI; 0.52 to 0.94) to 0.94 (95% CI; 0.72 to 1.00) and NPV from 0.90 (95% CI; 0.76 to 0.97) to 0.97 (95% CI; 0.85 to 1.00). • Conclusion— Inclusion of PCCT in the investigation of ICH patients allows detection of PCL which, together with the CTA spot sign, increases sensitivity and negative predictive value for predicting hematoma expansion. This finding should be validated in larger studies.
  • 49.
    49 Early Rate ofContrast Extravasation in Patients with Intracerebral Hemorrhage. AJNR 2011;32:1879-1884. • CT was performed at admission and at 24 hours for 16 patients with ICH with/without contrast extravasation seen on CTA and post–contrast-enhanced CT (PCCT). • Hematoma volume increased from 34.1 ± 41.0 mL to 40.2 ± 46.1 mL in extravasation- positive patients and decreased from 19.8 ± 31.8 mL to 17.4 ± 27.3 mL in extravasation- negative patients.
  • 50.
    50 CT Angiography “SpotSign” Predicts Hematoma Expansion in Acute Intracerebral Hemorrhage. Stroke 2007;38:1257-1262. The Diagnostic Performance Measures Of Spot Sign For Hematoma Expansion. Sensitivity, % (95% CI) Specificity, % (95% CI) PPV, % (95% CI) NPV, % (95% CI) +LR (95% CI) −LR (95% CI) Spot sign 91 % (62–100) 89 % (72–96) 77 % (50–92) 96 % (81–99) 8.5 (2.9–25) 0.1 (.02–0.7) Extrava- sation (CE) 45 % (21–72) 96 % (82–100) 83 % (43–99) 81 % (66–91) 12.7 (1.7–97) 0.6 (0.3–0.9) Anticoa- gulation 45 (21–72) 79 (63–94) 79 (61–90) 45 (21–72) 2 (0.8– 5.5) 0.7 (0.4– 1.2) MAP >120 mm Hg 36 (15–65) 61 (42–76) 27 (11–52 71 (51–85) 0.9 (0.4– 2.3) 1.0 (0.6– 1.8) History of hypertension 54 (28–79) 57 (39–73) 33 (16–56) 76 (54–89) 1.3 (0.6– 2.5) 0.8 (0.4– 1.6) Glucose >8.3 18 (5–48) 71 (53–85) 20 (5–51) 69 (51–83) 0.6 (0.2– 2.5) 1.1 (0.8– 1.6) PPV indicates positive predictive value; NPV, negative predictive value; and LR, likelihood ratio, the preferred way to represent a single summary result of a diagnostic test. It estimates the posttest odds of an outcome (significant increase in ICH volume) changed relative to the pretest odds.
  • 51.
    51 Prediction of haematomagrowth and outcome in patients with intracerebral haemorrhage using the CT-angiography spot sign (PREDICT): a prospective observational study. Lancet Neurol 2012;11:307–14. Sensi- tivity Speci- ficity PPV NPV Mortality CTA spot sign positive 60 % 90% 73 % 84 % 43.4% (23 of 53) Contrast Extravasation 50 % 85 % 58 % 80 % CTA Spot sign negative 19.6% (31 of 158) 268 patients were enrolled in 12 centres in six countries from June 24, 2006, to Sept 6, 2010. No adverse events were reported directly attributable to the CT angiogram. Diagnostic Performance Measures for an haematoma expansion >6 mL or >33%
  • 52.
    52 Accuracy of theSpot Sign for the Prediction of In-Hospital Mortality and Poor Outcome Among Survivors in Primary ICH Accuracy In-Hospital Poor Outcome* Parameter______Mortality (95% CI) (95% CI) ______ Sensitivity 41% (34–49) 23 % (17–32) Specificity 85 % (81–88) 89 % (85–92) PPV 56 % (47–64) 51 % (38–64) NPV 76 % (72–80) 70 % (65–75) Positive LR 2.7 (2.0–3.7) 2.2 (1.4–3.4) Negative LR 0.69 (0.61–0.78) 0.86 (0.78–0.95) Accuracy 71 % 67 % Prevalence 31 % 33 % For sensitivity, specificity, PPV, NPV, accuracy, and prevalence, the numbers in the table represent percentages. The numbers in parenthesis represent the 95% CI. *Defined as a modified Rankin Scale of 4 at 3-month follow-up among the 393 survivors. ICH indicates intracerebral hemorrhage; CI, confidence interval; PPV, positive predictive value; NPV, negative predictive value; LR, likelihood ratio.
  • 53.
    53 CONCLUSION • The SpotSign is a potentially promising sign for predicting hematoma expansion. • This sign may play a role in patient selection for clinical trials of acute hemostatic therapy or surgical interventions aimed at minimizing hematoma growth. • Correct recognition of the sign and exclusion of secondary ICH causes will be crucial to the success of such studies.
  • 54.
    CONCLUSION • Clinicians shouldbe aware of the Spot Sign mimics, classified as either vascular or nonvascular. Nonvascular causes are easily distinguished with NCCT but may be misinterpreted as contrast density in its absence. • The presence of a vessel extending from brain or ventricular surface into a hematoma strongly suggests the presence of underlying vascular malformation. 54
  • 55.
    55 TAKE HOME MESSAGE •CT Angiogram can be done immediately after an intracerebral hemorrahage. • Spot sign should be specifically looked for in a CT angiogram. • After a CTA, a post contrast CT of the Brain should be done to detect the presence of Contrast Extravasation. • Presence of Spot Sign or Contrast Extravasation predicts poor outcome and such patients should be vigorously treated.
  • 56.
  • 57.
    57 REFERENCES 1. The SpotSign in Intracerebral Hemorrhage: The Importance of Looking for Contrast Extravasation. Cerebrovasc Dis 2010;29:217-220. 2. The Spot Sign Score in Primary Intracerebral Hemorrhage Identifies Patients at Highest Risk of In-Hospital Mortality and Poor Outcome Among Survivors. Stroke 2010;41:54-60. 3. Contrast Extravasation on CT Predicts Mortality in Primary Intracerebral Hemorrhage. Am J Neuroradiol 2008;29:520–25. 4. CT Angiography “Spot Sign” Predicts Hematoma Expansion in Acute Intracerebral Hemorrhage. Stroke 2007;38:1257-1262. 5. Systematic Characterization of the Computed Tomography Angiography Spot Sign in Primary ICH Identifies Patients at Highest Risk for Hematoma Expansion: The Spot Sign Score. Stroke 2009;40:2994-3000. 6. CT angiography spot sign predicts in-hospital mortality in patients with secondary intracerebral hemorrhage. J NeuroIntervent Surg doi:10.1136/neurintsurg-2011-010061. 7. Contrast Extravasation on Computed Tomography Angiography Predicts Clinical Outcome in Primary ICH: A Prospective Study of 139 Cases. Stroke 2011;42:3441-3446.
  • 58.
    58 REFERENCES 8. Early Rateof Contrast Extravasation in Patients with Intracerebral Hemorrhage. AJNR 2011;32:1879-1884. 9. Intracerebral haemorrhage. Lancet 2009;373:1632-644. 10. Diagnostic Accuracy and Yield of Multidetector CT Angiography in the Evaluation of Spontaneous Intraparenchymal Cerebral Hemorrhage. Am J Neuroradiol 2009;30:1213–221. 11. Early Rate of Contrast Extravasation in Patients with Intracerebral Hemorrhage. AJNR 2011 32: 1879-1884. 12. Options to Restrict Hematoma Expansion After Spontaneous Intracerebral Hemorrhage. Stroke 2010;41:402-409. 13. Spot sign and live-imaged dramatic intracerebral hematoma expansion. Neurology 2010;75;834. 14. Postcontrast CT Extravasation Is Associated With Hematoma Expansion in CTA Spot Negative Patients. Stroke 2009; 40: 1672-1676. 15. Vascular and Nonvascular Mimics of the CT Angiography ''Spot Sign'' in Patients With Secondary Intracerebral Hemorrhage. Stroke 2008, 39:1177-1183. 16. Dynamic nature of the CT angiographic ‘‘spot sign’’. The British Journal of Radiology 2010;83:e216–e219.
  • 59.
    59 REFERENCES 17. Diagnostic cerebralangiography in spontaneous intracranial haemorrhage: a guide for developing countries. Asian J Surg 2005;28(1):1-6. 18. Radiological Investigation of Spontaneous Intracerebral Hemorrhage: Systematic Review and Trinational Survey. Stroke 2010; 41: 685-690. 19. The risk of recurrent stroke after intracerebral haemorrhage. J Neurol Neurosurg Psychiatry 2007;78:836–840. 20. Natural History of Perihematomal Edema After Intracerebral Hemorrhage Measured by Serial Magnetic Resonance Imaging. Stroke 2011;42:73-80. 21. Guidelines for the Management of Spontaneous Intracerebral Hemorrhage : A Guideline for Healthcare Professionals From the American Heart Association/American Stroke Association. Stroke 2010, 41:2108-2129. 22. Prediction of haematoma growth and outcome in patients with intracerebral haemorrhage using the CT-angiography spot sign (PREDICT): a prospective observational study. Lancet Neurol 2012;11:307–14.
  • 60.
    60 Definitions of Classesand Levels of Evidence Used in AHA Stroke Council Recommendations Class I Conditions for which there is evidence for and/or general agreement that the procedure or treatment is useful and effective Class II Conditions for which there is conflicting evidence and/or a divergence of opinion about the usefulness/efficacy of a procedure or Treatment Class IIa: the weight of evidence or opinion is in favor of the procedure or treatment Class IIb: usefulness/efficacy is less well established by evidence or opinion Class III Conditions for which there is evidence and/or general agreement that the procedure or treatment is not useful/effective and in some cases may be harmful Therapeutic recommendations: Level of Evidence Level of Evidence A Data derived from multiple randomized clinical trials Evidence B Data derived from a single randomized trial or nonrandomized studies Evidence C Consensus opinion of experts Diagnostic / prognostic recommendations: Level of Evidence Level of Evidence A Data derived from multiple prospective cohort studies using a reference standard applied by a masked evaluator Level of Evidence B Data derived from a single grade A study or 1 case-control studies or studies using a reference standard applied by an unmasked Evaluator Evidence C Consensus opinion of experts
  • 61.
    61 Diagnostic Accuracy andYield of Multidetector CT Angiography in the Evaluation of Spontaneous Intraparenchymal Cerebral Hemorrhage. Am J Neuroradiol 2009;30:1213–221.` • A study of 623 patients with ICH examined with MDCTA identified clinical and NCCT characteristics that independently predicted an increased incidence of a vascular lesion as the ICH etiology: – age younger than 46 years (47%), – neither known hypertension nor impaired coagulation at presentation (33%), – lobar (20%) or infratentorial (16%) ICH location, and – female sex (18%).
  • 62.
    62 Prediction of haematomagrowth and outcome in patients with intracerebral haemorrhage using the CT-angiography spot sign (PREDICT): a prospective observational study. Lancet Neurol 2012;11:307–14. • 268 patients were enrolled in 12 centres in six countries from June 24, 2006, to Sept 6, 2010. No adverse events were reported directly attributable to the CT angiogram. • For an haematoma expansion >6 mL or >33%, the PPV for the CTA spot sign was 73%, and the NPV was 84%, with 63% sensitivity and 90% specificity. For haematoma expansion, contrast extravasation assessed by site investigator had a PPV of 58%, NPV of 80%, 50% sensitivity, and 85% specificity. • Mortality at 3 months was 43.4% (23 of 53) in the CTA spot-sign positive group versus 19.6% (31 of 158) in the CTA spot-sign negative group (age-adjusted hazard ratio, HR 2.4, 95% CI 1.4–4.0; p=0.002). The association between CTA spot-sign positive group and mortality remained significant in a sensitivity analysis whether patients lost to follow-up were assigned a mRS of 0 or 6. Kaplan- Meier analysis revealed an early difference in mortality between CTA spot-sign positive and CTA spot-sign negative groups, which was sustained during the follow-up period (p=0.0006).