Download as PDF, PPTX


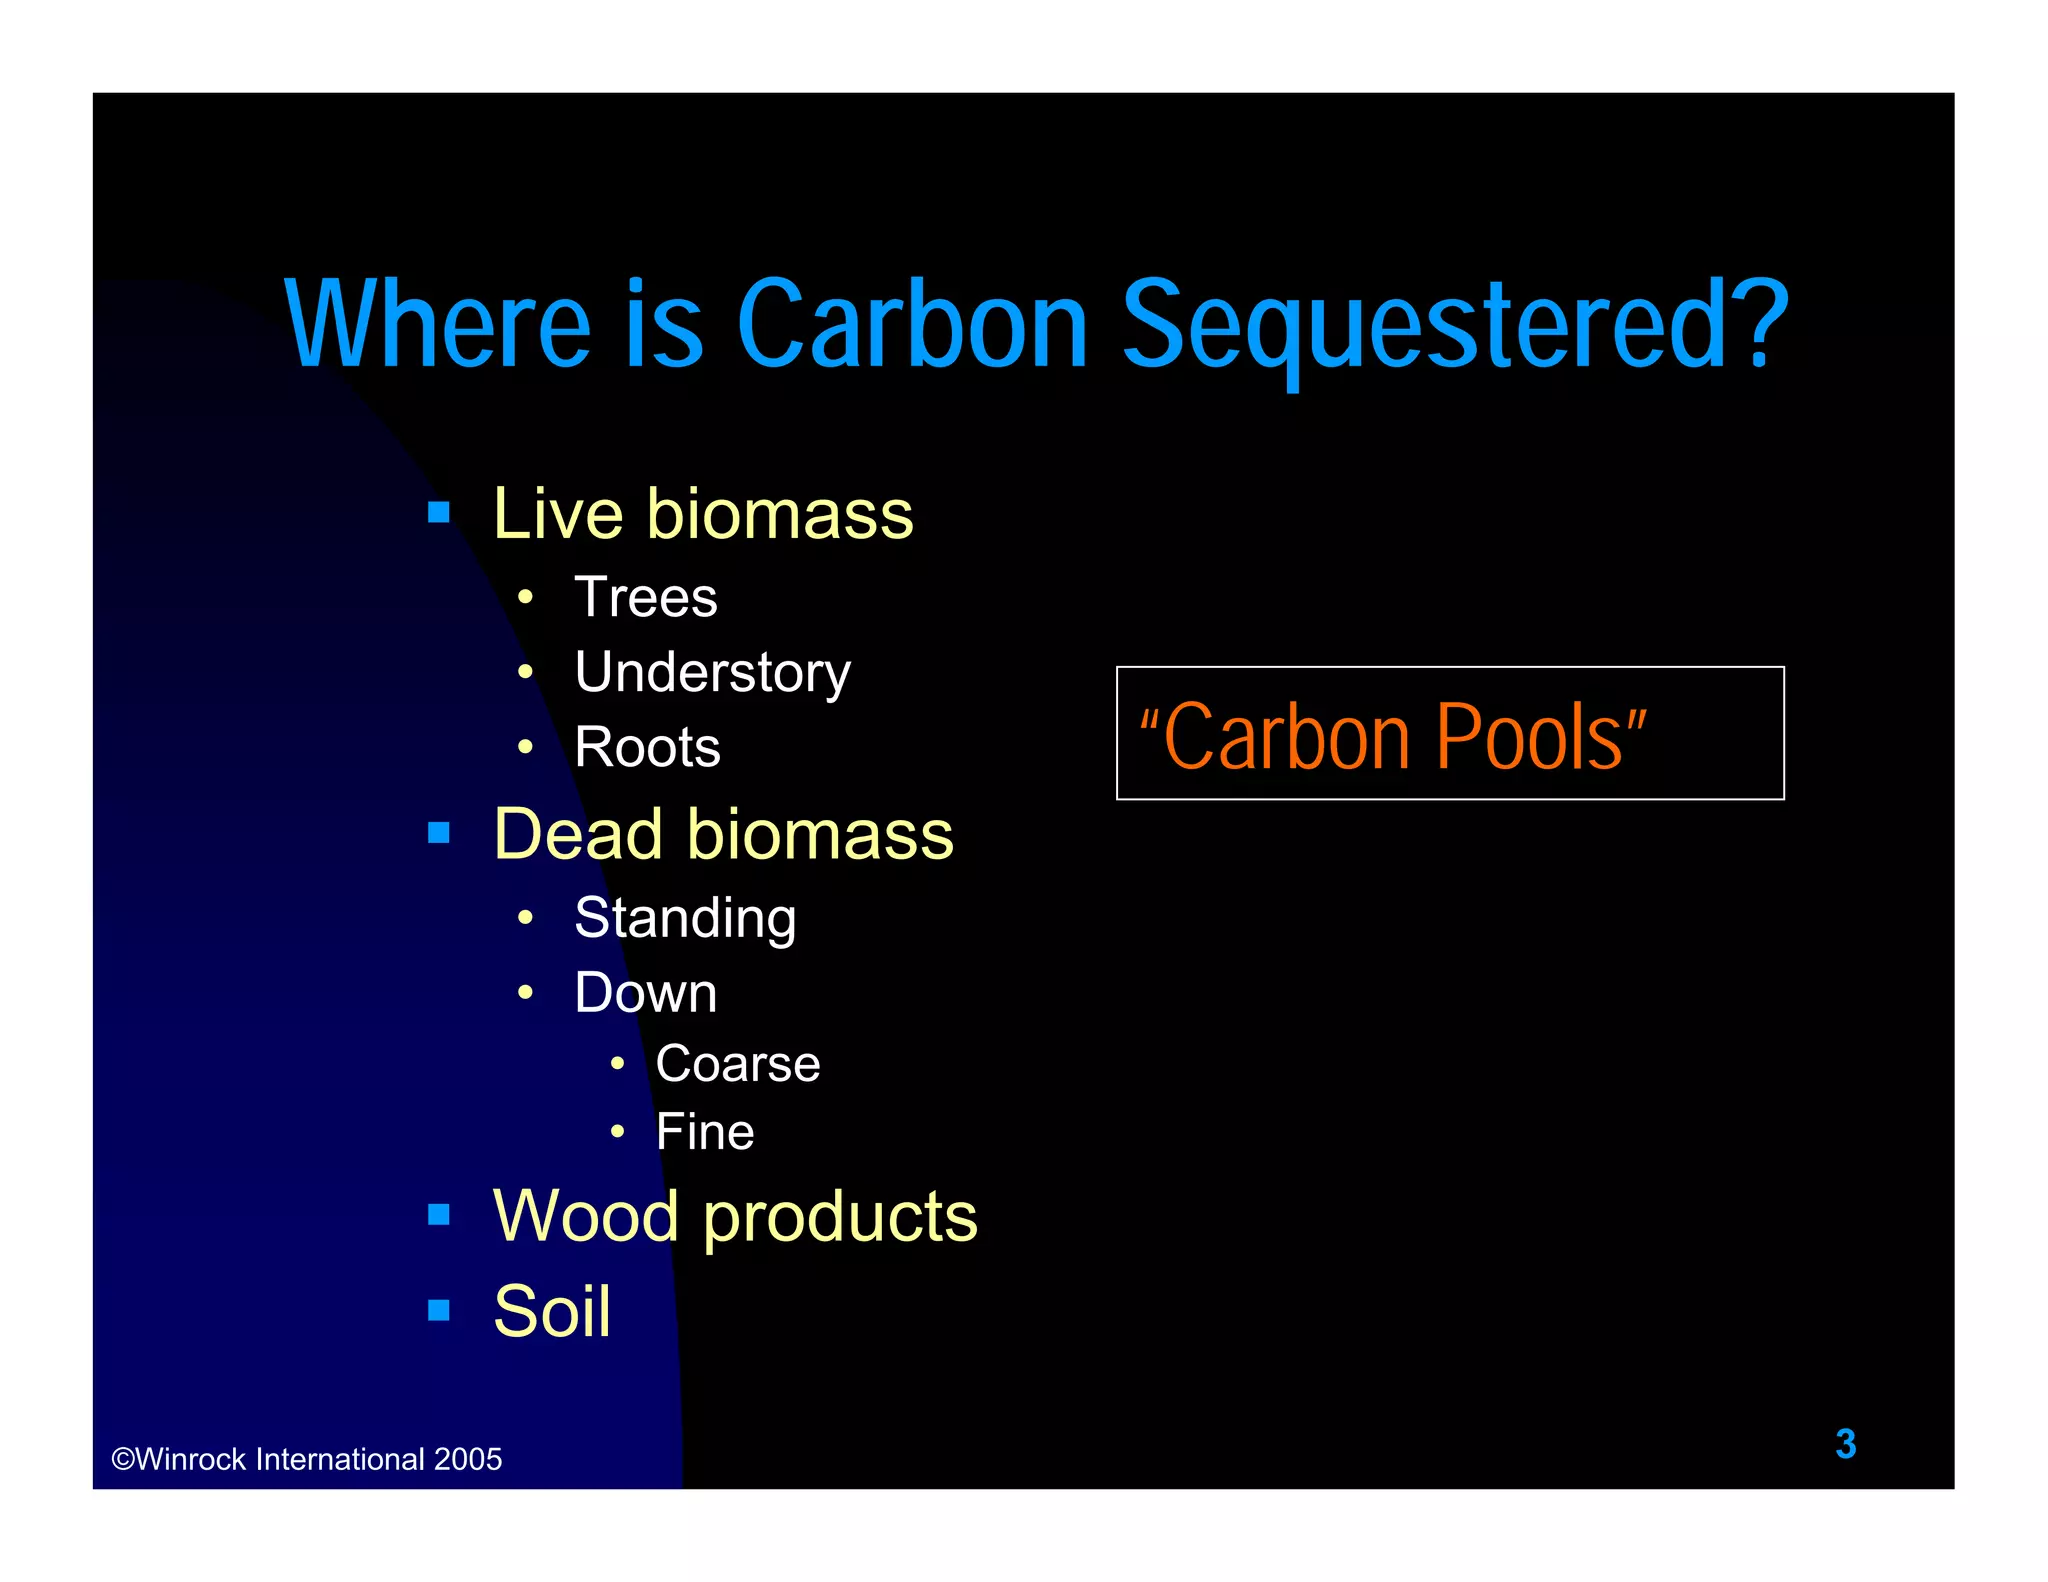


1) Terrestrial carbon sequestration involves photosynthesis fixing more carbon than is released by respiration, storing excess carbon in biomass and soils over time. 2) Carbon is sequestered in live biomass like trees and roots, dead biomass like coarse and fine litter, wood products, and soil organic matter. 3) Afforestation projects that convert agricultural or grazing land to forests can sequester 1-5 tons of carbon per hectare per year on average by planting fast-growing tree species.


