This document summarizes Alissa Barber Torres' presentation on the use of visual communication in urban planning. It introduces the field of urban planning and discusses how planners must represent communities and futures visually. It describes Torres' research on a regional visioning project in Central Florida that used scenario-based maps to depict preferred futures. Torres' interviews found planners interpreted the scenarios differently. The document concludes by discussing opportunities for technical communicators to work with planners and the public on developing shared understandings of regional visions through visuals, narratives, and other means.
This document discusses environmental cognition and cognitive mapping. It begins by defining environmental cognition as the process of acquiring, storing, organizing, and recalling information about locations, distances, and arrangements in spaces. It then defines cognitive mapping as the process by which individuals acquire, code, store, and recall information about the relative locations and attributes of phenomena in their everyday spatial environment. The document goes on to discuss cognitive maps as mental constructs of environments that integrate parts into a whole. It notes several factors that influence cognitive map formation, including age, personality, experience, and familiarity with an area. Finally, the document discusses Kevin Lynch's theory of the image of the city and his five elements of urban legibility: paths, edges, districts
The Digital Image of the City
Digital & Computational Studies
Bowdoin College
September 8, 2014
Professor Gieseking
Lecture Slides "An Introduction to The Digital Image of the City"
The document summarizes Kevin Lynch's book "The Image of the City" which explores how people mentally perceive and navigate urban environments. It discusses Lynch's concepts of imageability, legibility, and the five elements that comprise a city's mental image for people - paths, edges, districts, nodes, and landmarks. It provides examples of Lynch's analysis of the mental images of Boston, Jersey City, and Los Angeles.
This document provides information on different types of mapping, including cognitive mapping, behavioural mapping, and activity mapping. It discusses cognitive mapping as the process of encoding, storing, and manipulating experienced spatial information. Behavioural mapping is described as an objective method to observe and link human behavior to built environment attributes. Activity mapping involves recording the patterns and types of activities that people engage in within a space on a map. The document provides details on how to approach and represent each type of mapping to understand human spatial behavior and perceptions.
Urban design aims to understand urban form and the core values that support creating places with sustainable opportunities. It seeks to maximize choices for empowerment through the layers that make up urban form, including landform, public spaces, plots, and buildings. Good urban form is permeable with integrated networks and active interfaces between places to support vitality.
Kevyn introduced a concept of planning that was the base for understanding and visualising The Planning Aspects; important for the budding planners.
The presentation initiates the same understanding and invokes a means for better understanding of 'Planning'.
The concept of knowledge-based urban development has first come to the urban planning and development agenda during the very last years of the 20th century as a promising paradigm to support the transformation process of cities into knowledge cities and their societies into knowledge societies
Kevin Lynch was an urban planner, scholar, and writer known for his work on the perception of urban form. He found that people mentally construct images of cities using five main elements: pathways, districts, edges, landmarks, and nodes. Pathways are routes of movement like streets or walkways. Districts are recognizable areas of a city. Edges are linear elements like walls or shorelines that are not pathways. Landmarks are external reference points like buildings or signs. Nodes are strategic locations like junctions or focal points that people travel to or from. Lynch applied this framework to analyze the legibility and imageability of cities like Boston and Jersey City. His work influenced urban planning and design.
What is the best way for Geographers to find meaning and reach conclusions?: Theoretical Geography, Spatial-Mathematical Approach, Logical Positivism v Behaviouralism. Prepared for an IB Diploma Theory of Knowledge class
Urban design (the functional dimension of designing an urban area)UzmaAbid5
Movement is fundamental to how urban places function. It relates to encouraging people to stop and spend time in public spaces, which generates life and activity. There are two types of movement - vehicular and pedestrian. Pedestrian movement is important as it allows for optional activities beyond basic travel. Space syntax theory explores how urban grid configuration and connectivity relates to pedestrian movement and densities. Well-connected places encourage more pedestrian movement and support a variety of land uses.
A presentation on the philosophy of Site Responsive Design delivered to planners and members at Winchester City Council as part of their urban design training.
Urban design considerations aim to provide guidance for designers to create buildings and public spaces that are easy to navigate, stimulate public activity, and support various uses. Key factors include spatial patterns, street networks, how space is used, and balancing consistency with variety in the urban environment. The goal of urban design is to create places that can be enjoyed by diverse people now and in the future.
The perceptual dimensions and urban designKU Leuven
This document discusses the perceptual dimensions of urban design. It begins by defining environmental perception and how people perceive and experience the built environment. It then explores key concepts like place identity, sense of place, and placelessness. Lynch's five elements of environmental images - paths, edges, districts, nodes, and landmarks - are examined. The document also covers place differentiation, place theming, place marketing, and invented places. Environmental meaning and symbolism are discussed as well.
This document discusses digital spatial history and mapping. It covers how maps are socially constructed and reflect tensions between objectivity and subjectivity. It also discusses how digital technologies have democratized mapping by allowing anyone to create and annotate maps. Different types of digital maps are described, including georectified maps that show changes over time by layering historical maps, thematic maps that visualize data statistics, bubble maps, chloropleth maps, aggregation maps, animated maps, and interactive maps. Examples of each type are provided.
Kevin Lynch studied the mental maps and images that people form of cities. He identified 5 key elements that shape a person's mental image: pathways, edges, districts, nodes, and landmarks. Pathways are streets and paths that direct movement; edges are linear boundaries like walls; districts are recognizable sections of a city; nodes are strategic points like intersections; and landmarks are reference points like buildings. Lynch applied this framework to analyze the mental maps of Boston, Jersey City, and Los Angeles. His work aimed to understand how people navigate cities and design more legible urban environments.
Informal Settlements and Cadastral MappingLouisa Diggs
Quantifying Error in Training Data for Mapping and Monitoring the Earth System - A Workshop on “Quantifying Error in Training Data for Mapping and Monitoring the Earth System” was held on January 8-9, 2019 at Clark University, with support from Omidyar Network’s Property Rights Initiative, now PlaceFund.
The document discusses elements that contribute to the legibility and navigability of cities, as analyzed by urban planner Kevin Lynch. It examines four cities - Athens, Paris, Jaipur, and Rome - and how each city utilizes Lynch's elements of paths, edges, districts, and landmarks to create a coherent structure that is easy for people to understand and navigate. The document analyzes features of each city like pathways in Athens, water edges in Paris, distinct districts in Jaipur, and prominent landmarks in Rome that make the layout and organization of each city clear.
The document discusses the history and definitions of urban design. It began as a field in the 1950s to bridge the gap between architecture and city planning. Urban design is defined as "that part of city planning which deals with the physical form of the city". The document then explores different "spheres of urbanistic action" or approaches to urban design, including its relationship to architecture, landscape architecture, city planning, and as a form of public policy. It also discusses urban design's role in place-making, addressing issues like sprawl, integrating transportation, and ensuring community participation. The conclusion is that urban design is less a technical discipline and more of a mindset among professionals seeking insights about community form.
The document discusses several functional dimensions of urban design including the use of public spaces, density, mixed uses, and privacy considerations. It describes how public spaces should provide comfort, relaxation, passive and active engagement, and discovery opportunities. Higher densities are preferred to lower densities as they support more sustainable development patterns with efficient use of land and resources. Mixed uses that blend residential, commercial and other functions are also highlighted as important for urban vitality.
Additional characteristics of an Urban Space urban morphologySomesh Siddharth
This document provides information on urban morphology and urban design techniques from a course at Amity School of Architecture and Planning. It defines key characteristics of urban spaces like permeability, variety, and legibility. It also outlines the process of urban design, including problem identification, goal setting, situational analysis, synthesis, evaluation, and implementation. Finally, it discusses components and techniques for conducting a visual survey of an urban area, including mapping physical features, activity patterns, and problem areas.
Franklin County, Florida: Disaster Planning for the Business Communitynado-web
How are communities, businesses, and regions preparing for, responding to, and recovering from natural and man-made disasters? This session will explore effective strategies to foster resilience and strengthen local economies all in an effort to “build back better” following a catastrophic event.
Denise Imbler, Director, Emergency Management Program, Apalachee Regional Planning Council, Tallahassee, FL
This document discusses building national resilience to disasters in the United States. It notes that disaster losses could be reduced through increased attention to building resilience at all levels of government and communities. Key points discussed include:
- Strong governance at the federal, state, and local levels is important for resilience.
- Policies need to take a long-term view of community resilience and avoid unintended consequences.
- There are gaps in coordination and policies across federal agencies that impact resilience.
- Building local capacity and empowering communities to prepare and adapt is important from the "bottom-up".
- Post-Hurricane Sandy, there have been new resilience programs and increased attention across government levels.
This document provides an overview and agenda for an Illinois integrated regional planning project meeting. It discusses the passage of the Workforce Innovation and Opportunity Act (WIOA) and opportunity to enhance alignment among workforce development, economic development, and education. Key activities for the project include supporting regional planning, providing technical assistance to regions, and helping regions identify industry targets and partnerships. Participating groups in the project are listed. The agenda covers regional planning, team development, and upcoming regional meetings.
The Caribbean Community Regional Aid for Trade Strategy 2013-2015 aims to help CARICOM member states overcome constraints to competitiveness and trade expansion through three strategic goals: 1) Upgrading key economic infrastructure, 2) Enhancing competitiveness and trade diversification, and 3) Deepening regional integration and maximizing gains from trade agreements. The strategy identifies priority areas and "anchor" projects to achieve these goals in maritime transport, ICT, energy, trade facilitation, and private sector development. It also categorizes activities as regional, national-regional, or national to coordinate aid for trade efforts across the Caribbean.
West Central Wisconsin Regional Planning Commission Broadband Grant Workshop ...WI Broadband
West Central Wisconsin Regional Planning Commission Broadband Grant Workshop Presentation 4.2016 with Public Service Commission Wisconsin, University Wisconsin Extension Broadband & E-Commerce Education Center
إنشاء النماذج
يعد النموذج نوع من أنواع كائنات قواعد البيانات الذي يستخدم في الأصل لإدخال البيانات أو عرضها في قاعدة بيانات. يمكن أيضاً استخدام نموذج كلوحة تبديل لفتح نماذج وتقارير أخرى في قاعدة البيانات
تنضم معظم النماذج إلى جدول و استعلام واحد أو أكثر في قاعدة البيانات. يشير مصدر سجل النموذج إلى الحقول الموجودة في الجدول الأساسي و الاستعلامات. لا يحتاج النموذج إلى احتواء كافة الحقول من كل الجداول أو الاستعلامات التي تستند إليها.
Community Engagementand Capacity Building Cultural PlanningEmily Robson
Presentation delivered by Ernie Ginsler, Regional Consultant, Ontario Healthy Communities Coalition at November 27 2008 "Economies in Transition" forum in Chatham, Ontario.
The presentation discusses research on interpreting visual regional planning scenarios. Interviews with planners found the regional scenario was challenging to interpret and did not clearly communicate community values. Further research is needed to establish formal visual conventions for regional planning and test scenarios with textual support and public participation. Improving scenario communication could help implement regional visions through local decisions over decades.
Designed visualisation: good design doing good?EDV Project
The talk introduces ideas around design as an agent of change and how designed visual communications can operate within the field of argument visualisation.The opportunities present within the the EPSRC-funded platform for Election Debate Visualisation in 2015 allow for design to (re)invent within an area of critical need, situating the power of design and data visualisation in the service of telling compelling, engaging and illuminating stories to the audiences of the Prime Ministerial debates. Focusing on the inherent tensions between neutrality and visual clarity, and the power for beautiful design to allow for accessibility, the presentation will outline some challenges for the team in the creation of research tools, interfaces and visualisations and will touch upon some thoughts around methods for making and methods for testing the platform’s design prototypes.
Creating Thick space - maps and informationnorthcotegal
Slide deck prepared for Activating Urban Commons. Course instructor Peter Pennefather. Faculty of Information. University of Toronto. 2013.
Michelle Gay
2010 its all about place shaping - pugalisLee Pugalis
Place shaping has now entered the everyday vocabulary of built environment professions, academics and the public sector at large. This struck me when leafing through the job vacancies in a well known British regeneration industry publication as I happened to notice an advert for what appeared to be an innovative and exciting new spatial development role: Head of Place Shaping. I was curious about this role, particularly as I had just advertised for an economic development officer with a background in or enthusiasm for ‘place shaping’, so I started to investigate a little further.
This document discusses how geographic information systems (GIS) can be applied to natural resource management. GIS allows for the organization, analysis and modeling of diverse spatial data related to natural resources and the environment. Developing countries in particular have experienced degradation of natural resources, and GIS can help address issues through spatial analysis and modeling. The problem is that Nigeria has faced environmental degradation with few solutions. GIS provides a way to map and estimate risk areas more efficiently and accurately to enhance natural resource decision making.
This document discusses planning and design practice in virtual spaces such as online communities. It argues that online spaces have emerged as places with communities and identities, similarly to physical places. It suggests that planning methods used for physical spaces, such as Lynch's taxonomy of images and cognitive mapping, can also be applied to virtual spaces. The document advocates for planners to get involved in designing user interfaces, evaluating online place quality, and supporting hybrid online-physical communities through social software design.
Synopsis Project: visualisation and storytelling with mapsKarl Donert
The SYNOPSIS project concerns Storytelling and Fundraising for Cultural Heritage professionals.
Cultural heritage covers a variety of activities, and a system of values, traditions, knowledge, and lifestyles that characterise society.
The heritage sector has to deal with new challenges and it is therefore necessary to develop new professionalism, able to promote and support cultural heritage as it improves not only the overall economic growth and employment, but also social cohesion and environmental sustainability.
Storytelling and fundraising skills assume a fundamental role in connecting the past to the future. Cultural Heritage storytelling is concerned with “communicating through stories”, creating narratives through which a cultural heritage enters into an emphatic relationship with people, managing to arouse public emotion. The purpose is to engage people to protect, exploit cultural heritage, and support it financially.
This presentation deals with visualisation and using maps in storytelling with maps as part o the training programme
The document summarizes a presentation on opportunity mapping and advocacy. It discusses how opportunity mapping can be used to analyze access to opportunities across neighborhoods and identify disparities faced by marginalized groups. Opportunity mapping involves collecting data on indicators like education, employment, housing, and environment at the neighborhood level and analyzing patterns of advantage and disadvantage. The results are mapped to visualize spatial inequities and inform advocacy efforts to promote more equitable communities and expand access to opportunities for all residents.
An introduction to the field of Linguistic Landscape and how the languages of public spaces can become a resource for language learning. Presented in Intermediate Spanish II classes, Columbia University, March 29, 2016
xCulture – Cross-cultural UX Elements: Research Method and Design GuidelinesJan Brejcha
Thanks to the intensification of globalization through communication technology, we are faced more and more with UIs coming from different cultural backgrounds. In order to fit the user’s cultural expectations as closely as possible, designers need to combine usability knowledge with cultural insights. By defining a usable set of UI design guidelines for a target culture, designers could market their products with lower costs than with cross-cultural testing. To promote this line of research, we carried a pilot study targeted at the habits, mental models and UI preferences of Chinese and Czech users. Our findings show there is a strong influence of globalization on the cultural markers mainly through the use of common software platforms. However, we found many important culture-specific differences as well in both groups. We present our results as guidelines that could be used to enhance the user’s acceptance of the UI in a specific culture.
This document summarizes a workshop on opportunity mapping presented by researchers from the Kirwan Institute. The workshop consisted of three parts: an introduction, a discussion of opportunity mapping and advocacy, and a look toward the future of democratizing data. In the introduction, the presenters provided background on the Kirwan Institute and discussed why mapping is an effective tool for advocacy. They then explained what opportunity mapping is, how it can be used to identify inequities, and potential outcomes of the approach. Finally, they discussed making opportunity maps interactive and accessible online to further their use. The overall workshop aimed to demonstrate how mapping can tell stories about spatial inequities and support advocacy efforts.
In information visualization, visual mirages can emerge when the visual representation of data is interpreted or appears to indicate patterns that are not truly present in the data. This can be caused by issues such as incorrect data scaling, the use of improper visualization techniques, or a lack of clear visual signals. Such mirages might be mis-lead and lead to incorrect assumptions. To avoid such blunders, it is critical to extensively evaluate visualizations and verify that they appropriately show data patterns.
Humans of Lomé project: Traveling Circus of UrbanismMariko Sugita
A presentation slide to explain the collaboration project of Traveling Circus of Urbanism with WoeLab from 13 December 2021 til 31th January 2022 in Lomé, Togo.
This document summarizes a presentation given by Jason Reece from the Kirwan Institute for the Study of Race & Ethnicity. The presentation discusses the concept of opportunity and how access to opportunity structures like education, housing, employment, and social networks impact people's likelihood of success. It notes that people of color are more likely to live in areas with fewer opportunities. The presentation outlines how the Kirwan Institute conducts opportunity mapping to analyze disparities in access to opportunities across places. It provides examples of how these maps have informed policies and programs in various locations to improve access to opportunities.
Introduction to Information Architecture & Design - 6/20/15Robert Stribley
Events.com wants to revamp its website to become the go-to online resource for people wanting to attend or promote events across the United States. The presentation covers conducting user research through focus groups and surveys, performing a competitive review of similar websites, creating personas based on user research findings, and using card sorting to help organize content and define site navigation. The information architecture process involves defining page types, sketching designs, creating site maps and wireframes, and testing prototypes with users.
The document discusses the importance of developing a clear design concept. It defines what a concept is and provides examples of concept definitions. It also discusses how concepts can be communicated visually and verbally. The document outlines different levels of reasoning - inductive, deductive, and design reasoning - that contribute to concept development. It provides examples of site determinants, physical concepts, cultural factors, and spatial and visual design factors that influence concept generation. The document emphasizes that concepts should translate the design philosophy and provide interior and exterior expression that appeals to both professionals and laypeople. It includes examples of concept sketches, illustrations, and drawings.
This document discusses using narrative space design concepts and storytelling as a design strategy for public spaces and environments. It proposes gathering stories from local users to inform design and using storytelling to prototype services. The concept design process involves identifying spatial elements and human actions through observation, then transforming experiences into spatial patterns through diagrams, sketches and models. The goal is to reflect local identity and inspire through aesthetic quality. Spatial patterns are analyzed through basic elements, grids, and routes to explore relationships between space and movement. The final outcomes aim to structure spaces as narrative sites transformed through sequences of user movement.
This document outlines Serena Pollastri's year 1 research plan. The research aims to map visualization processes that can contribute to designing future scenarios of sustainable, livable cities. The theoretical framework is based on a "metadesign" approach of collaboratively designing design tools to enable systemic change. The research structure involves literature reviews on visualizations, future scenarios, and cities/liveability. Design experiments are planned, including future visioning workshops and a foresight report. The timeline shows literature reviews and design experiments occurring through 2014-2016, culminating in publications and conferences.
Similar to The Regional Image: Interpreting the Visual Products of Regional Planning (20)
AI 101: An Introduction to the Basics and Impact of Artificial IntelligenceIndexBug
Imagine a world where machines not only perform tasks but also learn, adapt, and make decisions. This is the promise of Artificial Intelligence (AI), a technology that's not just enhancing our lives but revolutionizing entire industries.
UiPath Test Automation using UiPath Test Suite series, part 5DianaGray10
Welcome to UiPath Test Automation using UiPath Test Suite series part 5. In this session, we will cover CI/CD with devops.
Topics covered:
CI/CD with in UiPath
End-to-end overview of CI/CD pipeline with Azure devops
Speaker:
Lyndsey Byblow, Test Suite Sales Engineer @ UiPath, Inc.
Dr. Sean Tan, Head of Data Science, Changi Airport Group
Discover how Changi Airport Group (CAG) leverages graph technologies and generative AI to revolutionize their search capabilities. This session delves into the unique search needs of CAG’s diverse passengers and customers, showcasing how graph data structures enhance the accuracy and relevance of AI-generated search results, mitigating the risk of “hallucinations” and improving the overall customer journey.
Goodbye Windows 11: Make Way for Nitrux Linux 3.5.0!SOFTTECHHUB
As the digital landscape continually evolves, operating systems play a critical role in shaping user experiences and productivity. The launch of Nitrux Linux 3.5.0 marks a significant milestone, offering a robust alternative to traditional systems such as Windows 11. This article delves into the essence of Nitrux Linux 3.5.0, exploring its unique features, advantages, and how it stands as a compelling choice for both casual users and tech enthusiasts.
TrustArc Webinar - 2024 Global Privacy SurveyTrustArc
How does your privacy program stack up against your peers? What challenges are privacy teams tackling and prioritizing in 2024?
In the fifth annual Global Privacy Benchmarks Survey, we asked over 1,800 global privacy professionals and business executives to share their perspectives on the current state of privacy inside and outside of their organizations. This year’s report focused on emerging areas of importance for privacy and compliance professionals, including considerations and implications of Artificial Intelligence (AI) technologies, building brand trust, and different approaches for achieving higher privacy competence scores.
See how organizational priorities and strategic approaches to data security and privacy are evolving around the globe.
This webinar will review:
- The top 10 privacy insights from the fifth annual Global Privacy Benchmarks Survey
- The top challenges for privacy leaders, practitioners, and organizations in 2024
- Key themes to consider in developing and maintaining your privacy program
Observability Concepts EVERY Developer Should Know -- DeveloperWeek Europe.pdfPaige Cruz
Monitoring and observability aren’t traditionally found in software curriculums and many of us cobble this knowledge together from whatever vendor or ecosystem we were first introduced to and whatever is a part of your current company’s observability stack.
While the dev and ops silo continues to crumble….many organizations still relegate monitoring & observability as the purview of ops, infra and SRE teams. This is a mistake - achieving a highly observable system requires collaboration up and down the stack.
I, a former op, would like to extend an invitation to all application developers to join the observability party will share these foundational concepts to build on:
Driving Business Innovation: Latest Generative AI Advancements & Success StorySafe Software
Are you ready to revolutionize how you handle data? Join us for a webinar where we’ll bring you up to speed with the latest advancements in Generative AI technology and discover how leveraging FME with tools from giants like Google Gemini, Amazon, and Microsoft OpenAI can supercharge your workflow efficiency.
During the hour, we’ll take you through:
Guest Speaker Segment with Hannah Barrington: Dive into the world of dynamic real estate marketing with Hannah, the Marketing Manager at Workspace Group. Hear firsthand how their team generates engaging descriptions for thousands of office units by integrating diverse data sources—from PDF floorplans to web pages—using FME transformers, like OpenAIVisionConnector and AnthropicVisionConnector. This use case will show you how GenAI can streamline content creation for marketing across the board.
Ollama Use Case: Learn how Scenario Specialist Dmitri Bagh has utilized Ollama within FME to input data, create custom models, and enhance security protocols. This segment will include demos to illustrate the full capabilities of FME in AI-driven processes.
Custom AI Models: Discover how to leverage FME to build personalized AI models using your data. Whether it’s populating a model with local data for added security or integrating public AI tools, find out how FME facilitates a versatile and secure approach to AI.
We’ll wrap up with a live Q&A session where you can engage with our experts on your specific use cases, and learn more about optimizing your data workflows with AI.
This webinar is ideal for professionals seeking to harness the power of AI within their data management systems while ensuring high levels of customization and security. Whether you're a novice or an expert, gain actionable insights and strategies to elevate your data processes. Join us to see how FME and AI can revolutionize how you work with data!
How to Get CNIC Information System with Paksim Ga.pptxdanishmna97
Pakdata Cf is a groundbreaking system designed to streamline and facilitate access to CNIC information. This innovative platform leverages advanced technology to provide users with efficient and secure access to their CNIC details.
Threats to mobile devices are more prevalent and increasing in scope and complexity. Users of mobile devices desire to take full advantage of the features
available on those devices, but many of the features provide convenience and capability but sacrifice security. This best practices guide outlines steps the users can take to better protect personal devices and information.
Unlock the Future of Search with MongoDB Atlas_ Vector Search Unleashed.pdfMalak Abu Hammad
Discover how MongoDB Atlas and vector search technology can revolutionize your application's search capabilities. This comprehensive presentation covers:
* What is Vector Search?
* Importance and benefits of vector search
* Practical use cases across various industries
* Step-by-step implementation guide
* Live demos with code snippets
* Enhancing LLM capabilities with vector search
* Best practices and optimization strategies
Perfect for developers, AI enthusiasts, and tech leaders. Learn how to leverage MongoDB Atlas to deliver highly relevant, context-aware search results, transforming your data retrieval process. Stay ahead in tech innovation and maximize the potential of your applications.
#MongoDB #VectorSearch #AI #SemanticSearch #TechInnovation #DataScience #LLM #MachineLearning #SearchTechnology
Building Production Ready Search Pipelines with Spark and MilvusZilliz
Spark is the widely used ETL tool for processing, indexing and ingesting data to serving stack for search. Milvus is the production-ready open-source vector database. In this talk we will show how to use Spark to process unstructured data to extract vector representations, and push the vectors to Milvus vector database for search serving.
HCL Notes and Domino License Cost Reduction in the World of DLAUpanagenda
Webinar Recording: https://www.panagenda.com/webinars/hcl-notes-and-domino-license-cost-reduction-in-the-world-of-dlau/
The introduction of DLAU and the CCB & CCX licensing model caused quite a stir in the HCL community. As a Notes and Domino customer, you may have faced challenges with unexpected user counts and license costs. You probably have questions on how this new licensing approach works and how to benefit from it. Most importantly, you likely have budget constraints and want to save money where possible. Don’t worry, we can help with all of this!
We’ll show you how to fix common misconfigurations that cause higher-than-expected user counts, and how to identify accounts which you can deactivate to save money. There are also frequent patterns that can cause unnecessary cost, like using a person document instead of a mail-in for shared mailboxes. We’ll provide examples and solutions for those as well. And naturally we’ll explain the new licensing model.
Join HCL Ambassador Marc Thomas in this webinar with a special guest appearance from Franz Walder. It will give you the tools and know-how to stay on top of what is going on with Domino licensing. You will be able lower your cost through an optimized configuration and keep it low going forward.
These topics will be covered
- Reducing license cost by finding and fixing misconfigurations and superfluous accounts
- How do CCB and CCX licenses really work?
- Understanding the DLAU tool and how to best utilize it
- Tips for common problem areas, like team mailboxes, functional/test users, etc
- Practical examples and best practices to implement right away
Cosa hanno in comune un mattoncino Lego e la backdoor XZ?Speck&Tech
ABSTRACT: A prima vista, un mattoncino Lego e la backdoor XZ potrebbero avere in comune il fatto di essere entrambi blocchi di costruzione, o dipendenze di progetti creativi e software. La realtà è che un mattoncino Lego e il caso della backdoor XZ hanno molto di più di tutto ciò in comune.
Partecipate alla presentazione per immergervi in una storia di interoperabilità, standard e formati aperti, per poi discutere del ruolo importante che i contributori hanno in una comunità open source sostenibile.
BIO: Sostenitrice del software libero e dei formati standard e aperti. È stata un membro attivo dei progetti Fedora e openSUSE e ha co-fondato l'Associazione LibreItalia dove è stata coinvolta in diversi eventi, migrazioni e formazione relativi a LibreOffice. In precedenza ha lavorato a migrazioni e corsi di formazione su LibreOffice per diverse amministrazioni pubbliche e privati. Da gennaio 2020 lavora in SUSE come Software Release Engineer per Uyuni e SUSE Manager e quando non segue la sua passione per i computer e per Geeko coltiva la sua curiosità per l'astronomia (da cui deriva il suo nickname deneb_alpha).
Sudheer Mechineni, Head of Application Frameworks, Standard Chartered Bank
Discover how Standard Chartered Bank harnessed the power of Neo4j to transform complex data access challenges into a dynamic, scalable graph database solution. This keynote will cover their journey from initial adoption to deploying a fully automated, enterprise-grade causal cluster, highlighting key strategies for modelling organisational changes and ensuring robust disaster recovery. Learn how these innovations have not only enhanced Standard Chartered Bank’s data infrastructure but also positioned them as pioneers in the banking sector’s adoption of graph technology.
In the rapidly evolving landscape of technologies, XML continues to play a vital role in structuring, storing, and transporting data across diverse systems. The recent advancements in artificial intelligence (AI) present new methodologies for enhancing XML development workflows, introducing efficiency, automation, and intelligent capabilities. This presentation will outline the scope and perspective of utilizing AI in XML development. The potential benefits and the possible pitfalls will be highlighted, providing a balanced view of the subject.
We will explore the capabilities of AI in understanding XML markup languages and autonomously creating structured XML content. Additionally, we will examine the capacity of AI to enrich plain text with appropriate XML markup. Practical examples and methodological guidelines will be provided to elucidate how AI can be effectively prompted to interpret and generate accurate XML markup.
Further emphasis will be placed on the role of AI in developing XSLT, or schemas such as XSD and Schematron. We will address the techniques and strategies adopted to create prompts for generating code, explaining code, or refactoring the code, and the results achieved.
The discussion will extend to how AI can be used to transform XML content. In particular, the focus will be on the use of AI XPath extension functions in XSLT, Schematron, Schematron Quick Fixes, or for XML content refactoring.
The presentation aims to deliver a comprehensive overview of AI usage in XML development, providing attendees with the necessary knowledge to make informed decisions. Whether you’re at the early stages of adopting AI or considering integrating it in advanced XML development, this presentation will cover all levels of expertise.
By highlighting the potential advantages and challenges of integrating AI with XML development tools and languages, the presentation seeks to inspire thoughtful conversation around the future of XML development. We’ll not only delve into the technical aspects of AI-powered XML development but also discuss practical implications and possible future directions.
Programming Foundation Models with DSPy - Meetup SlidesZilliz
Prompting language models is hard, while programming language models is easy. In this talk, I will discuss the state-of-the-art framework DSPy for programming foundation models with its powerful optimizers and runtime constraint system.
Programming Foundation Models with DSPy - Meetup Slides
The Regional Image: Interpreting the Visual Products of Regional Planning
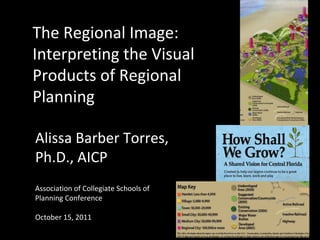
1. The Regional Image:
Interpreting the Visual
Products of Regional
Planning
Alissa Barber Torres,
Ph.D., AICP
Association of Collegiate Schools of
Planning Conference
October 15, 2011
2. Approach
• Studied “How Shall We Grow?” 2050 regional
land use scenario (“The 4C’s”)
• Includes seven Central Florida counties (93
local governments)
• Implementation through decades of local
stakeholder decisions and interpretations
Can that be done effectively?
3. “The 4C’s” Scenario
Source: http://www.myregion.org/RegionalVision/VisionMaps/tabid/204/Default.aspx
4. Visual documentation Visual instructions
Visual persuasion
Visual
intervention
Scenarios as
Textual
“instructions” to create
persuasion
a future place
(“storytelling”)
5. Approach
• Dissertation considers scenarios as technical
and persuasive communication
• Five one-hour interviews and two focus groups
with planners (N=14)
• Qualitative “data slice” providing insights for
further research
• Other scenarios may not have same
characteristics and outcomes
6. Approach
• Included comparison to Harris Interactive
Community Values Survey
• Values: growth management, neighborhoods,
nature, schools, transportation
• Also used rhetorical analysis (Healey 2007)
designed for regional scale
• Assessment context of “imageability”--
elements that create “identity and structure in
the mental image” (Lynch, 1950, p. 9)
7. Approach
“What space is being referred to? How is it positioned
in relation to other spaces and places? What are its
connectivities and how are these produced? How is it
bounded and what are its scales? What are its ‘front’
and ‘back’ regions? What are its key descriptive
concepts, categories, and measures? How is the
connection between past, present, and future
established? Whose viewpoint and whose perceived
and lived space is being privileged?”
(Healey, 2007, p. 209-210).
8. Research Findings
• “The 4C’s” scenario not functioning well as
technical communication
• Two community values not seen in scenario at all
• Needs clarification the meaning of design/visual
elements
• Would benefit from more detailed textual
support within scenario’s “real estate”
• Can’t rely on shared mental context among
planners about the regional place depicted
9. Research Findings
Assessment of Scenario Legend
White dotted lines are confusing and not on the legend.
Doesn’t give accurate description of where people will live based on sprawl and
quarter-acre lots. What is defined as undeveloped? No definition in the legend.
Also need definition of conservation—would it include conservation
subdivisions?
Bothers me that vacant and conservation are different—not clear—where would we
build after 2050?
Legend doesn’t describe nonresidential that is in mix. Existing conservation looks
forested, not wetland.
Why are development areas both hatched and not hatched?
Color palettes usually are specific to planning—dark to light for density/intensity,
and this doesn’t do that.
Source: Focus Groups and Interviews.
10. Research Findings
Assessment of Scenario Place Icons
Growth or population.
Consider to be growth centers to focus densities and intensities.
Shows current location of employment and residential centers in region and what
growth projections are. How and where future growth will take place.
Misleading where height of colored boxes suggests building height, but is actually
population.
Not clear the size of column equals people—may be with clusters—nominal, but
ordinal and interval here—no way of determining.
Thought it was transportation icons.
Pink boxes say 100,000 population or more, but doesn’t tell why four are
together.
11. Research Findings
Assessment of Scenario Lines (Transportation)
I don’t know, I have no idea [after referring to legend]—connection corridors.
Swooshes are connections.
Economic regions that have partnerships with each other.
Transportation and connectivity between places. The map represents
multimodal nature of the region and the connection of centers.
Nominal levels shows where going, but not volume.
Doesn’t suggest surface travel, as goes top of box to top of box [place icon].
Roads and railroads—look like we’re flying, as don’t connect on ground.
Multimodal connections and the short pink block are confusing.
Source: Focus Groups and Interviews.
12. Research Findings
• Planners’ interpretations vary, often by their
own specializations or value systems
• No planner identified two of the five
community values within the scenario
• Many challenges to defining a region in this
setting among planners, even individually
• Regional sense of place or narrative not
present or emerging
13. Research Findings
• Need detailed content to support intrepretation,
using text and clear visual/spatial logic
• Kostelnick and Hassett warn visual conventions
fleeting and often based in particular moment in
time (2003, p. 190)
• Planning community may not sustain conventions
needed to interpret the scenario over intended
life (2050)
• Implications for realizing community values and the
desired “future place “
14. Research and Practice
• Need testing with larger samples
• User-centered design approaches specific to tasks
(“think aloud” protocol)
• Observe planners in workplaces (ex. Healey, Carp)
interpreting and comparing to local plans
• Comparison of U.S. visioning scenarios’ visual
conventions as a visual meta-analysis
15. Research and Practice
• Testing with prior dialogue and consensus about
regional context
• Review of scenarios with better regional contexts
(ex. Portland, the Buffalo Commons )
• “Storymapping” regional narratives online
• Use of digital media, like Krieger’s “Urban
Tomography,” for participatory image-making
• Create region in gaming/virtual environment or
Central Florida MST decision theater
16. References
Healey, P. (2007). Urban Complexity and
Spatial Strategies: Towards a Relational
Planning for Our Times. London and New
York: Routledge.
Kostelnick, C. and Hassett, M. (2003). Shaping
Information: the Rhetoric of Visual
Conventions. Carbondale: Southern Illinois
University Press.
Lynch, K. (1950). The Image of the City.
Cambridge and London: The MIT Press.