This quarterly investment review summarizes market performance in the second quarter of 2015. US stocks had slightly positive returns while international developed and emerging markets outperformed. Bonds yields increased in the US fixed income market. The review provides an overview of returns across global asset classes and geographic regions.

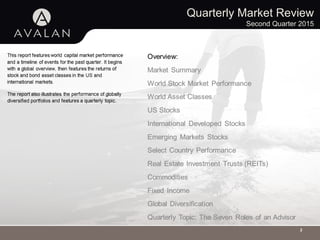
![Market Summary
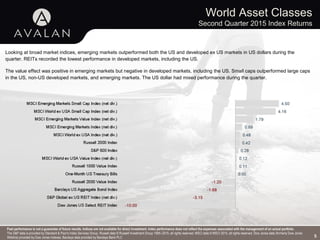
Second Quarter 2015 Index Returns
3
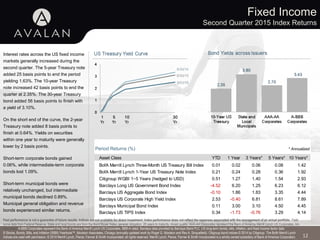
BONDS
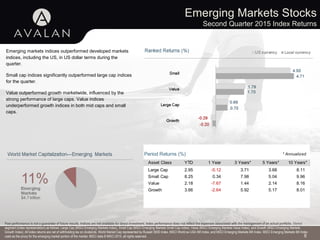
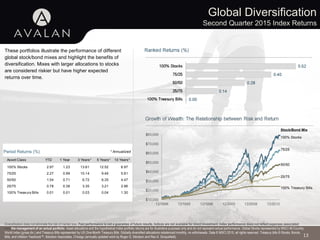
Past performance is not a guarantee of future results. Indices are not available for direct investment. Index performance does not reflect the expenses associated with the management of an actual portfolio.
Market segment (index representation) as follows: US Stock Market (Russell 3000 Index), International Developed Stocks (MSCI World ex USA Index [net div.]), Emerging Markets (MSCI Emerging Markets Index [net div.]),
Global Real Estate (S&P Global REIT Index), US Bond Market (Barclays US Aggregate Bond Index), and Global Bond ex US Market (Citigroup WGBI ex USA 1−30 Years [Hedged to USD]). The S&P data are provided by
Standard & Poor's Index Services Group. Russell data © Russell Investment Group 1995–2015, all rights reserved. MSCI data © MSCI 2015, all rights reserved. Barclays data provided by Barclays Bank PLC. Citigroup bond
indices © 2014 by Citigroup.](https://image.slidesharecdn.com/2q15investmentcommentary-150724191634-lva1-app6891/85/2-q15-investment-commentary-3-320.jpg)