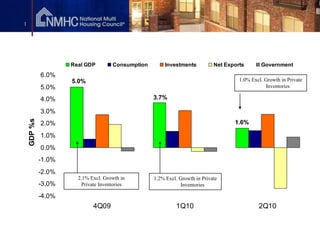
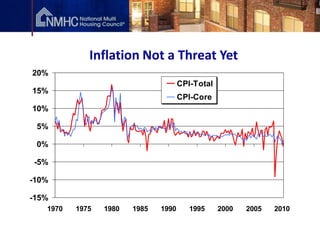
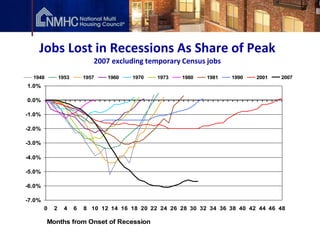
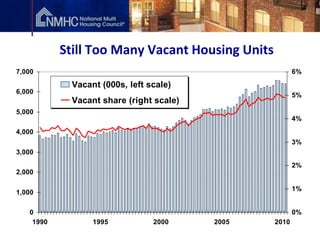
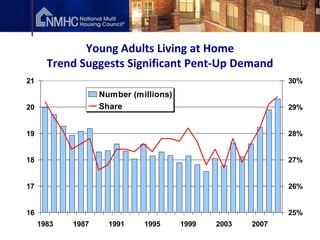
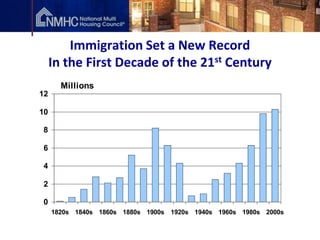
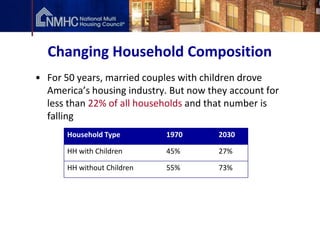
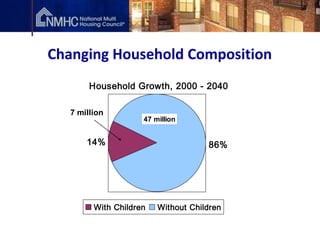
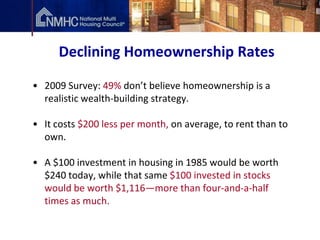
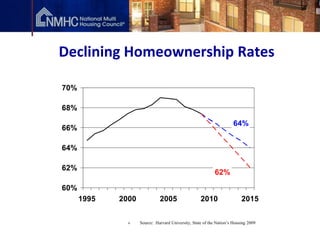
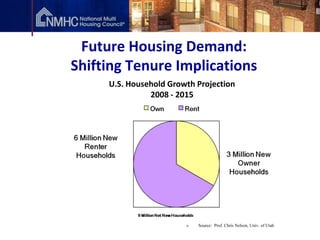
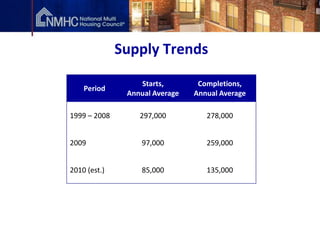
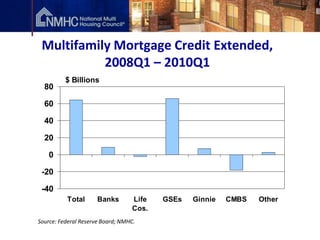
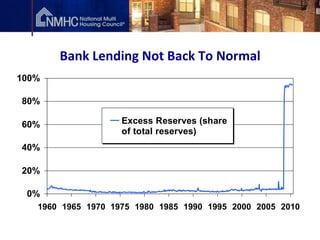
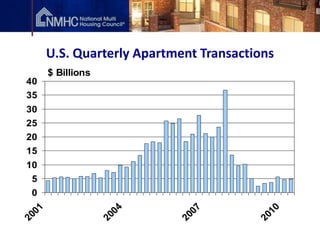
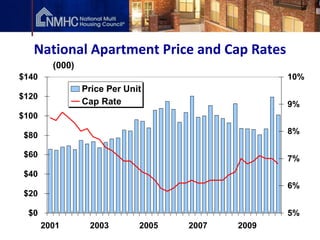
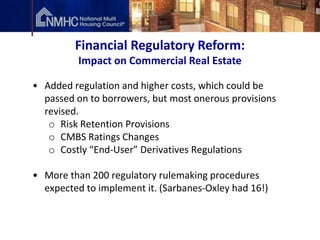
State of the Apartment Market
September 2010
1


                     Real GDP        Consumption       Investments           Net Exports       Government
             6.0%
                     5.0%                                                             1.0% Excl. Growth in Private
             5.0%                                                                                Inventories

             4.0%                                  3.7%

             3.0%
    GDP %s


             2.0%                                                                   1.6%

             1.0%
             0.0%
             -1.0%
             -2.0%
                       2.1% Excl. Growth in        1.2% Excl. Growth in Private
             -3.0%      Private Inventories                   Inventories

             -4.0%
                             4Q09                           1Q10                              2Q10
Inflation Not a Threat Yet
20%
                                      CPI-Total
15%
                                      CPI-Core
10%

 5%

 0%

-5%

-10%

-15%
   1970   1975   1980   1985   1990      1995     2000   2005   2010
Jobs Lost in Recessions As Share of Peak
                              2007 excluding temporary Census jobs
  1948          1953       1957   1960   1970    1973   1980    1981   1990    2001   2007
1.0%

0.0%

-1.0%

-2.0%

-3.0%

-4.0%

-5.0%

-6.0%

-7.0%
        0   2     4    6   8 10 12 14 16 18 20 22 24 26 28 30 32 34 36 38 40 42 44 46 48

         Months from Onset of Recession
NMHC Market Tightness Index
100


75


50


25


 0
   Jul    Jan    Jul    Jan    Jul    Jan    Jul    Jan
  1999   2001   2002   2004   2005   2007   2008   2010
Still Too Many Vacant Housing Units
7,000                                                   6%

             Vacant (000s, left scale)
6,000
                                                        5%
             Vacant share (right scale)
5,000
                                                        4%
4,000
                                                        3%
3,000
                                                        2%
2,000

                                                        1%
1,000

   0                                                    0%
    1990          1995           2000     2005   2010
Housing Inventory Remains High
     (Months’ Supply of Existing Homes)
20

          Single-family
15
          Condo

10


 5


 0
 2000   2002      2004    2006   2008   2010
Young Adults Living at Home
       Trend Suggests Significant Pent-Up Demand
21                                                          30%
                   Number (millions)
20                 Share                                    29%


19                                                          28%


18                                                          27%


17                                                          26%


16                                                          25%
     1983   1987     1991    1995      1999   2003   2007
Why the Long-Term Outlook for U.S.
               Apartments Should Be Favorable

Will we finally see sweeping change in favor of the density,
efficiency, flexibility and affordability of apartment living?
If so, what will drive it?

        1. Population growth
        2.   Echo boomers (and Millennials)
        3.   Changing household composition
        4.   Continued immigration
        5.   Environmental concerns
        6.   Affordability (in the post-crash world)
        7.   Bloom off the rose of homeownership
Population Growth

 • The U.S. population is expected to
   increase 33% by 2030 to 376
   million.

 • That’s 94 million more people than
   there were in 2000.

 • To accommodate that growth, we
   need 60 million new housing units.
Baby Boomers

• 78 million strong, 45 million households.
• If only a small percentage migrate to rental
  housing, the new demand is tremendous.

          Relocation Choices of Seniors
       Renter Before Move     20%
       Renter After Move      59%
Echo Boomers and Millennials
                             A Continuing Stream of Young People

      Millions
5

4

3

2

1
1933           1943            1953              1963   1973   1983   1993   2003
Source: National Center for Health Statistics.
Immigration Set a New Record
     In the First Decade of the 21st Century
       Millions
12

10

8

6

4

2

0
     1820s 1840s 1860s 1880s 1900s 1920s 1940s 1960s 1980s 2000s
Changing Household Composition
• For 50 years, married couples with children drove
  America’s housing industry. But now they account for
  less than 22% of all households and that number is
  falling
       Household Type        1970       2030

       HH with Children      45%        27%

       HH without Children   55%        73%
Changing Household Composition
        Household Growth, 2000 - 2040

   7 million
                     47 million


       14%                           86%


         With Children   Without Children
Declining Homeownership Rates

• 2009 Survey: 49% don’t believe homeownership is a
  realistic wealth-building strategy.

• It costs $200 less per month, on average, to rent than to
  own.

• A $100 investment in housing in 1985 would be worth
  $240 today, while that same $100 invested in stocks
  would be worth $1,116—more than four-and-a-half
  times as much.
Declining Homeownership Rates

70%

68%

                                                                      64%
66%

64%

62%
                                                            62%

60%
      1995   2000             2005                  2010                  2015


               »    Source: Harvard University, State of the Nation’s Housing 2009
Future Housing Demand:
Shifting Tenure Implications
     U.S. Household Growth Projection
               2008 - 2015


                        »   Source: Prof. Chris Nelson, Univ. of Utah
Supply Trends

                  Starts,        Completions,
    Period
               Annual Average   Annual Average

1999 – 2008       297,000          278,000


2009               97,000          259,000


2010 (est.)        85,000          135,000
Multifamily Mortgage Credit Extended,
           2008Q1 – 2010Q1
          $ Billions
  80

  60

  40

  20

    0

 -20

 -40
          Total       Banks       Life   GSEs   Ginnie   CMBS   Other
                                  Cos.
Source: Federal Reserve Board; NMHC.
Bank Lending Not Back To Normal
100%

80%

60%                 Excess Reserves (share
                    of total reserves)
40%

20%

 0%
   1960 1965 1970 1975 1980 1985 1990 1995 2000 2005 2010
U.S. Quarterly Apartment Transactions
       $ Billions
40
35
30
25
20
15
10
 5
 0
  01


                      04


                              07


                                           10
20


                    20


                            20


                                         20
National Apartment Price and Cap Rates
         (000)
$140                                               10%
                 Price Per Unit
$120
                 Cap Rate                          9%
$100

$80                                                8%

$60                                                7%
$40
                                                   6%
$20

  $0                                               5%
       2001       2003        2005   2007   2009
Financial Regulatory Reform:
          Impact on Commercial Real Estate

• Added regulation and higher costs, which could be
  passed on to borrowers, but most onerous provisions
  revised.
   o Risk Retention Provisions
   o CMBS Ratings Changes
   o Costly “End-User” Derivatives Regulations

• More than 200 regulatory rulemaking procedures
  expected to implement it. (Sarbanes-Oxley had 16!)
Next Up: GSE Reform
• Making the case for multifamily
  o We weren’t part of the problem – don’t throw the
    baby out with the bath water!
  o The nation is increasingly relying on rental housing,
    but private capital cannot meet 100% of the
    industry’s needs
  o A federally backed secondary market is critical to the
    industry’s health

• The process: a marathon, not a sprint.
Other Legislative Threats
• Carried Interest
• National Energy Efficiency Building Code/Green Building
  Mandates
• Card Check/Unionization Legislation
• Tax Law Changes
Conclusion
• Short-Term: Jobs, Jobs, Jobs

• Longer Term: Positive Demographics
1


              Thank You
    Douglas M. Bibby
    President
    National Multi Housing Council

    Web Site: www.nmhc.org
    E-Mail: info@nmhc.org
    Phone: 202/974-2300

Dougbibby 100930085051 Phpapp02

  • 1.
    State of theApartment Market September 2010
  • 2.
    1 Real GDP Consumption Investments Net Exports Government 6.0% 5.0% 1.0% Excl. Growth in Private 5.0% Inventories 4.0% 3.7% 3.0% GDP %s 2.0% 1.6% 1.0% 0.0% -1.0% -2.0% 2.1% Excl. Growth in 1.2% Excl. Growth in Private -3.0% Private Inventories Inventories -4.0% 4Q09 1Q10 2Q10
  • 3.
    Inflation Not aThreat Yet 20% CPI-Total 15% CPI-Core 10% 5% 0% -5% -10% -15% 1970 1975 1980 1985 1990 1995 2000 2005 2010
  • 4.
    Jobs Lost inRecessions As Share of Peak 2007 excluding temporary Census jobs 1948 1953 1957 1960 1970 1973 1980 1981 1990 2001 2007 1.0% 0.0% -1.0% -2.0% -3.0% -4.0% -5.0% -6.0% -7.0% 0 2 4 6 8 10 12 14 16 18 20 22 24 26 28 30 32 34 36 38 40 42 44 46 48 Months from Onset of Recession
  • 5.
    NMHC Market TightnessIndex 100 75 50 25 0 Jul Jan Jul Jan Jul Jan Jul Jan 1999 2001 2002 2004 2005 2007 2008 2010
  • 6.
    Still Too ManyVacant Housing Units 7,000 6% Vacant (000s, left scale) 6,000 5% Vacant share (right scale) 5,000 4% 4,000 3% 3,000 2% 2,000 1% 1,000 0 0% 1990 1995 2000 2005 2010
  • 7.
    Housing Inventory RemainsHigh (Months’ Supply of Existing Homes) 20 Single-family 15 Condo 10 5 0 2000 2002 2004 2006 2008 2010
  • 8.
    Young Adults Livingat Home Trend Suggests Significant Pent-Up Demand 21 30% Number (millions) 20 Share 29% 19 28% 18 27% 17 26% 16 25% 1983 1987 1991 1995 1999 2003 2007
  • 9.
    Why the Long-TermOutlook for U.S. Apartments Should Be Favorable Will we finally see sweeping change in favor of the density, efficiency, flexibility and affordability of apartment living? If so, what will drive it? 1. Population growth 2. Echo boomers (and Millennials) 3. Changing household composition 4. Continued immigration 5. Environmental concerns 6. Affordability (in the post-crash world) 7. Bloom off the rose of homeownership
  • 10.
    Population Growth •The U.S. population is expected to increase 33% by 2030 to 376 million. • That’s 94 million more people than there were in 2000. • To accommodate that growth, we need 60 million new housing units.
  • 11.
    Baby Boomers • 78million strong, 45 million households. • If only a small percentage migrate to rental housing, the new demand is tremendous. Relocation Choices of Seniors Renter Before Move 20% Renter After Move 59%
  • 12.
    Echo Boomers andMillennials A Continuing Stream of Young People Millions 5 4 3 2 1 1933 1943 1953 1963 1973 1983 1993 2003 Source: National Center for Health Statistics.
  • 13.
    Immigration Set aNew Record In the First Decade of the 21st Century Millions 12 10 8 6 4 2 0 1820s 1840s 1860s 1880s 1900s 1920s 1940s 1960s 1980s 2000s
  • 14.
    Changing Household Composition •For 50 years, married couples with children drove America’s housing industry. But now they account for less than 22% of all households and that number is falling Household Type 1970 2030 HH with Children 45% 27% HH without Children 55% 73%
  • 15.
    Changing Household Composition Household Growth, 2000 - 2040 7 million 47 million 14% 86% With Children Without Children
  • 16.
    Declining Homeownership Rates •2009 Survey: 49% don’t believe homeownership is a realistic wealth-building strategy. • It costs $200 less per month, on average, to rent than to own. • A $100 investment in housing in 1985 would be worth $240 today, while that same $100 invested in stocks would be worth $1,116—more than four-and-a-half times as much.
  • 17.
    Declining Homeownership Rates 70% 68% 64% 66% 64% 62% 62% 60% 1995 2000 2005 2010 2015 » Source: Harvard University, State of the Nation’s Housing 2009
  • 18.
    Future Housing Demand: ShiftingTenure Implications U.S. Household Growth Projection 2008 - 2015 » Source: Prof. Chris Nelson, Univ. of Utah
  • 19.
    Supply Trends Starts, Completions, Period Annual Average Annual Average 1999 – 2008 297,000 278,000 2009 97,000 259,000 2010 (est.) 85,000 135,000
  • 20.
    Multifamily Mortgage CreditExtended, 2008Q1 – 2010Q1 $ Billions 80 60 40 20 0 -20 -40 Total Banks Life GSEs Ginnie CMBS Other Cos. Source: Federal Reserve Board; NMHC.
  • 21.
    Bank Lending NotBack To Normal 100% 80% 60% Excess Reserves (share of total reserves) 40% 20% 0% 1960 1965 1970 1975 1980 1985 1990 1995 2000 2005 2010
  • 22.
    U.S. Quarterly ApartmentTransactions $ Billions 40 35 30 25 20 15 10 5 0 01 04 07 10 20 20 20 20
  • 23.
    National Apartment Priceand Cap Rates (000) $140 10% Price Per Unit $120 Cap Rate 9% $100 $80 8% $60 7% $40 6% $20 $0 5% 2001 2003 2005 2007 2009
  • 24.
    Financial Regulatory Reform: Impact on Commercial Real Estate • Added regulation and higher costs, which could be passed on to borrowers, but most onerous provisions revised. o Risk Retention Provisions o CMBS Ratings Changes o Costly “End-User” Derivatives Regulations • More than 200 regulatory rulemaking procedures expected to implement it. (Sarbanes-Oxley had 16!)
  • 25.
    Next Up: GSEReform • Making the case for multifamily o We weren’t part of the problem – don’t throw the baby out with the bath water! o The nation is increasingly relying on rental housing, but private capital cannot meet 100% of the industry’s needs o A federally backed secondary market is critical to the industry’s health • The process: a marathon, not a sprint.
  • 26.
    Other Legislative Threats •Carried Interest • National Energy Efficiency Building Code/Green Building Mandates • Card Check/Unionization Legislation • Tax Law Changes
  • 27.
    Conclusion • Short-Term: Jobs,Jobs, Jobs • Longer Term: Positive Demographics
  • 28.
    1 Thank You Douglas M. Bibby President National Multi Housing Council Web Site: www.nmhc.org E-Mail: info@nmhc.org Phone: 202/974-2300