Download as PDF, PPTX


![Parallel buildsParallel builds
Ninja, FASTBuild, IncrediBuild: best in this regard
make: -jN (and through CMake: "cmake --build . -- -jN")
MSBuild (build system behind Visual Studio):
/MP[processMax] - in CMake: "target_compile_options(target /MP)"
inability to parallelize compilation of dependent dlls
fixes this when integrated with Visual Studio
thread oversubscription (no overarching scheduler):
8 projects in parallel (8 cpp each + /MP) ==> 64 threads!
Ninja instead of MSBuild as the VS backend!
since recently supports
- Bruce Dawson
careful with unity builds and "long poles"
modern LTO/LTCG technology is parallelizable too
IncrediBuild
running Custom Build Tools in parallel
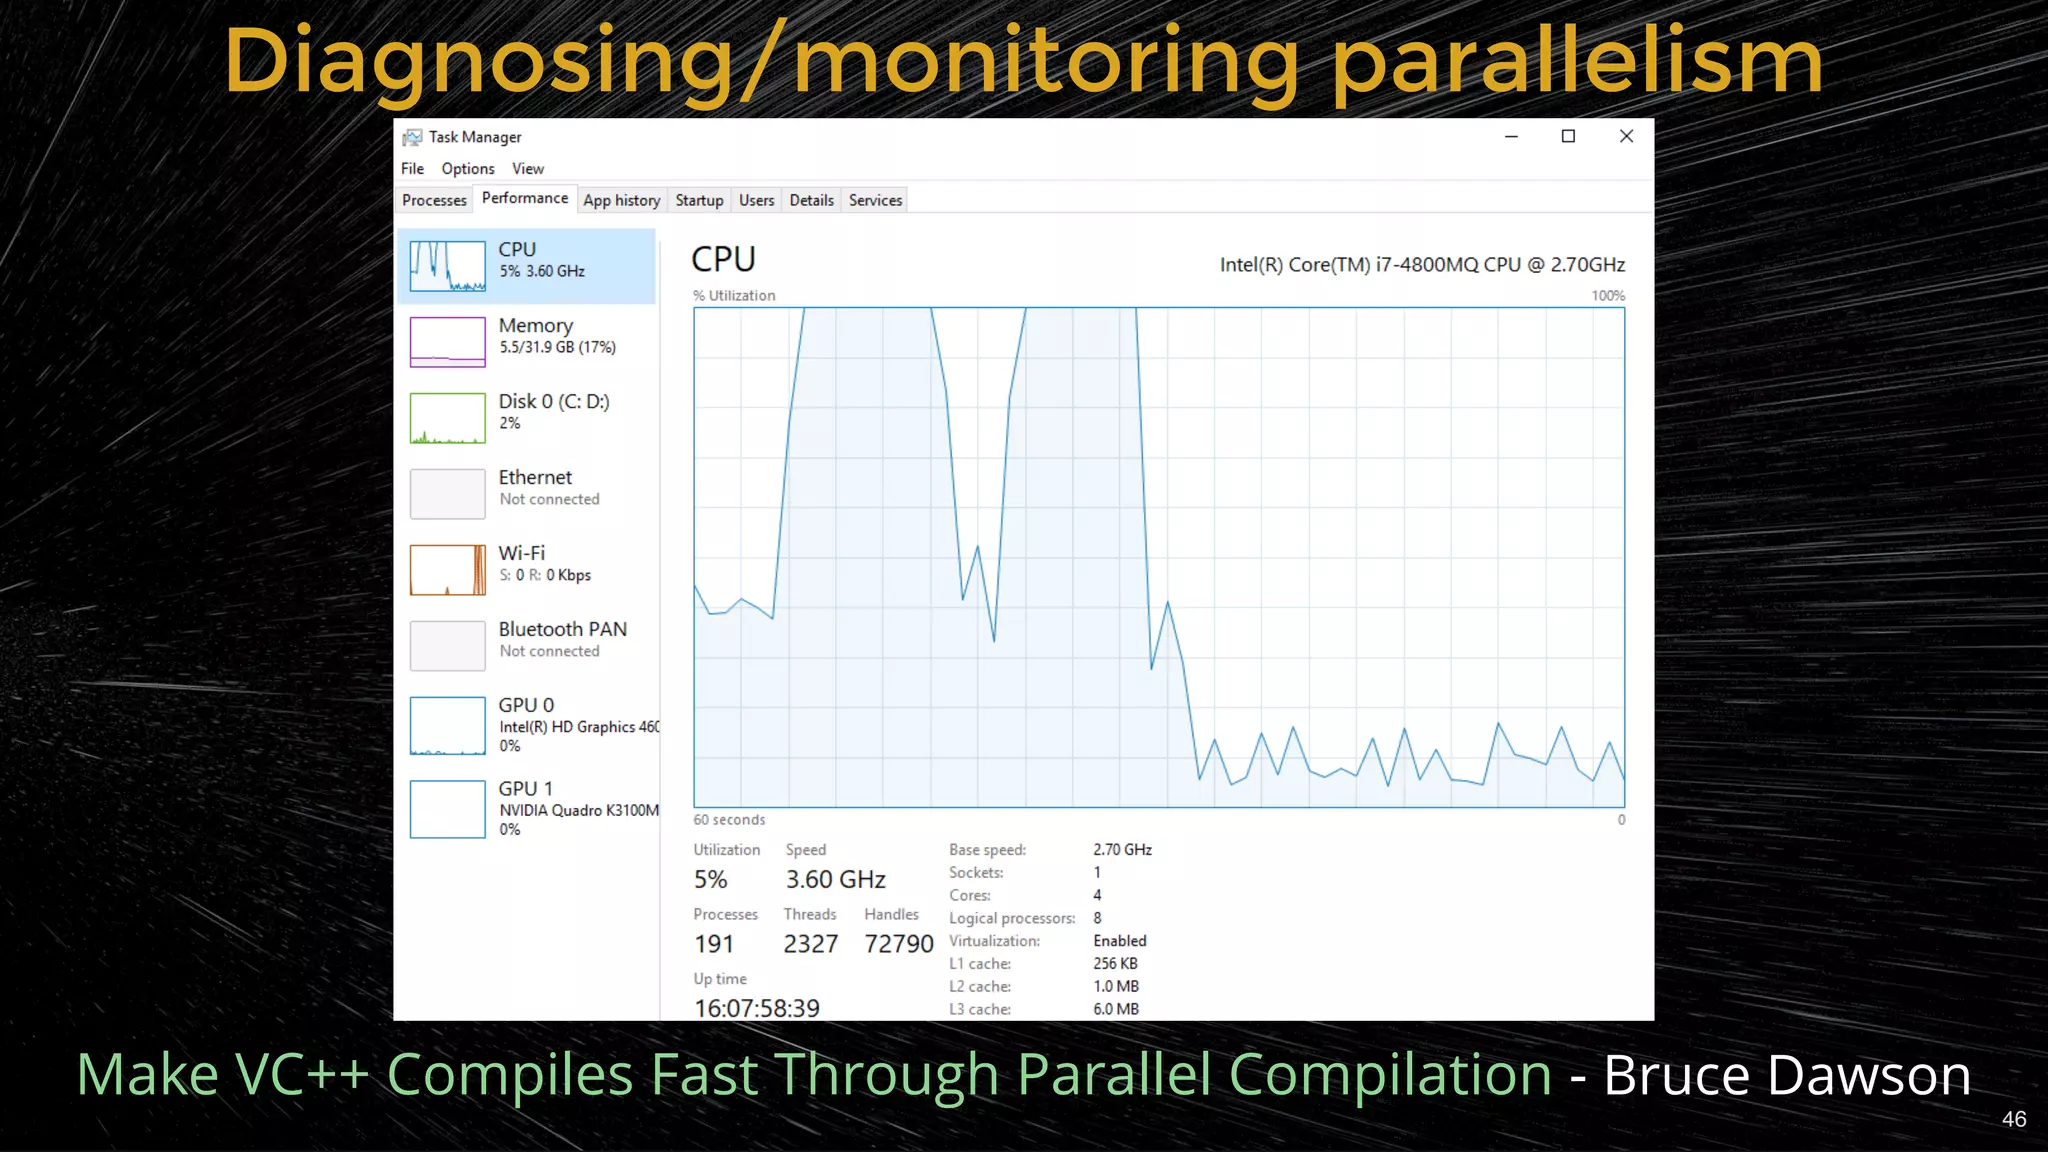
Make VC++ Compiles Fast Through Parallel Compilation
45](https://image.slidesharecdn.com/thehitchhikersguidetofasterbuilds-190726062829/75/The-Hitchhiker-s-Guide-to-Faster-Builds-Viktor-Kirilov-CoreHard-Spring-2019-45-2048.jpg)


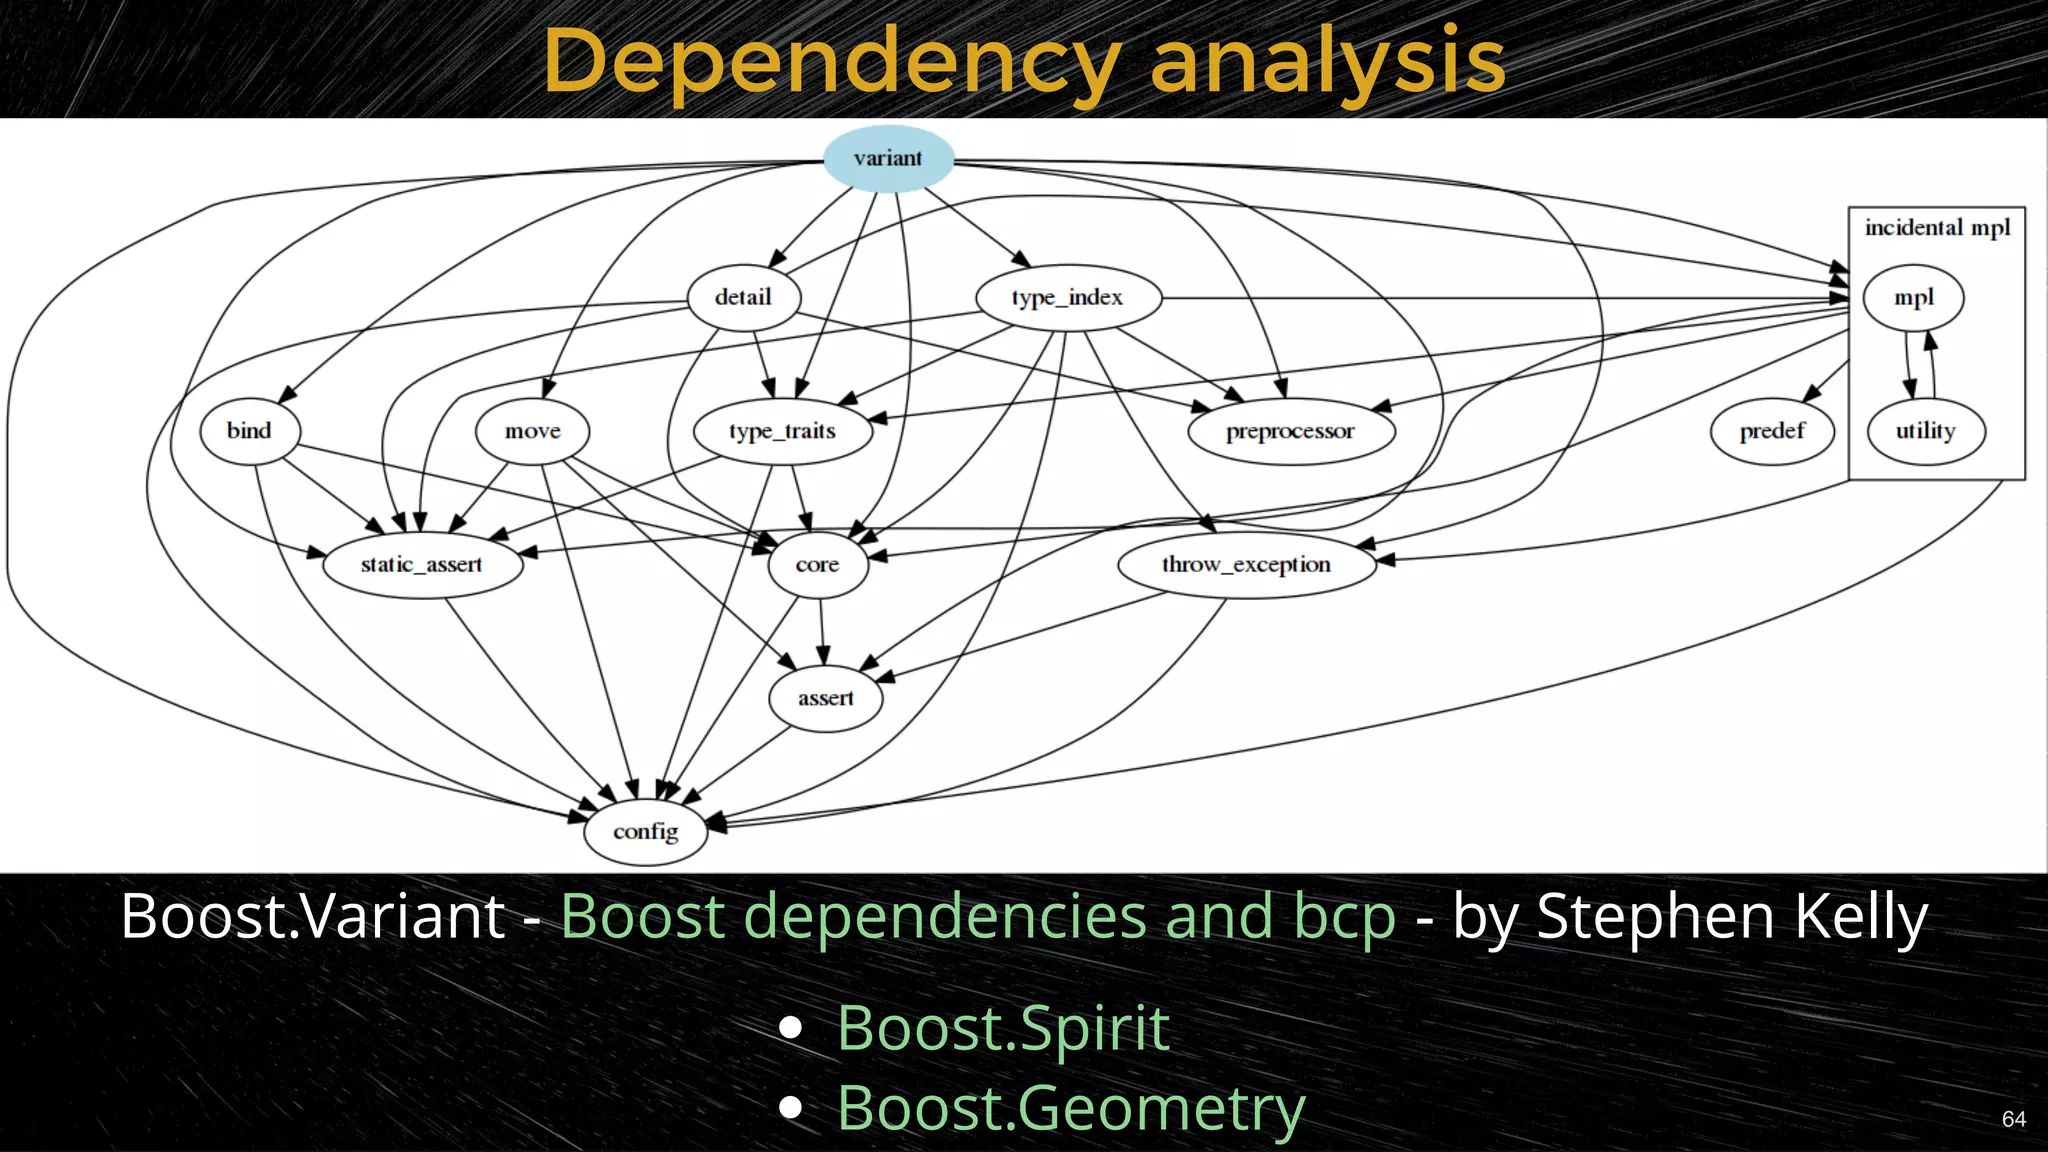
![Dependency analysisDependency analysis
cmake --graphviz=[file]
visualize with
some (most) build systems have such a feature ( )
Most tools from the "Finding unnecessary includes" slide
by scitools
- Graphviz
- Graphviz
maybe even
IDE tools
options
Graphviz
bazel
Understand
CppDepend
cpp-dependencies
Doxygen
SourceTrail
Visual Studio Code Maps 63](https://image.slidesharecdn.com/thehitchhikersguidetofasterbuilds-190726062829/75/The-Hitchhiker-s-Guide-to-Faster-Builds-Viktor-Kirilov-CoreHard-Spring-2019-63-2048.jpg)


The document discusses strategies to reduce compile times in C++, a common pain point in software development. It highlights major contributing factors to long build times, such as the complexity of the language and inefficient project structure, and offers various techniques including precompiled headers, unity builds, and improved code organization. Ultimately, it emphasizes the importance of optimizing compile times to enhance productivity and encourage experimentation within development teams.
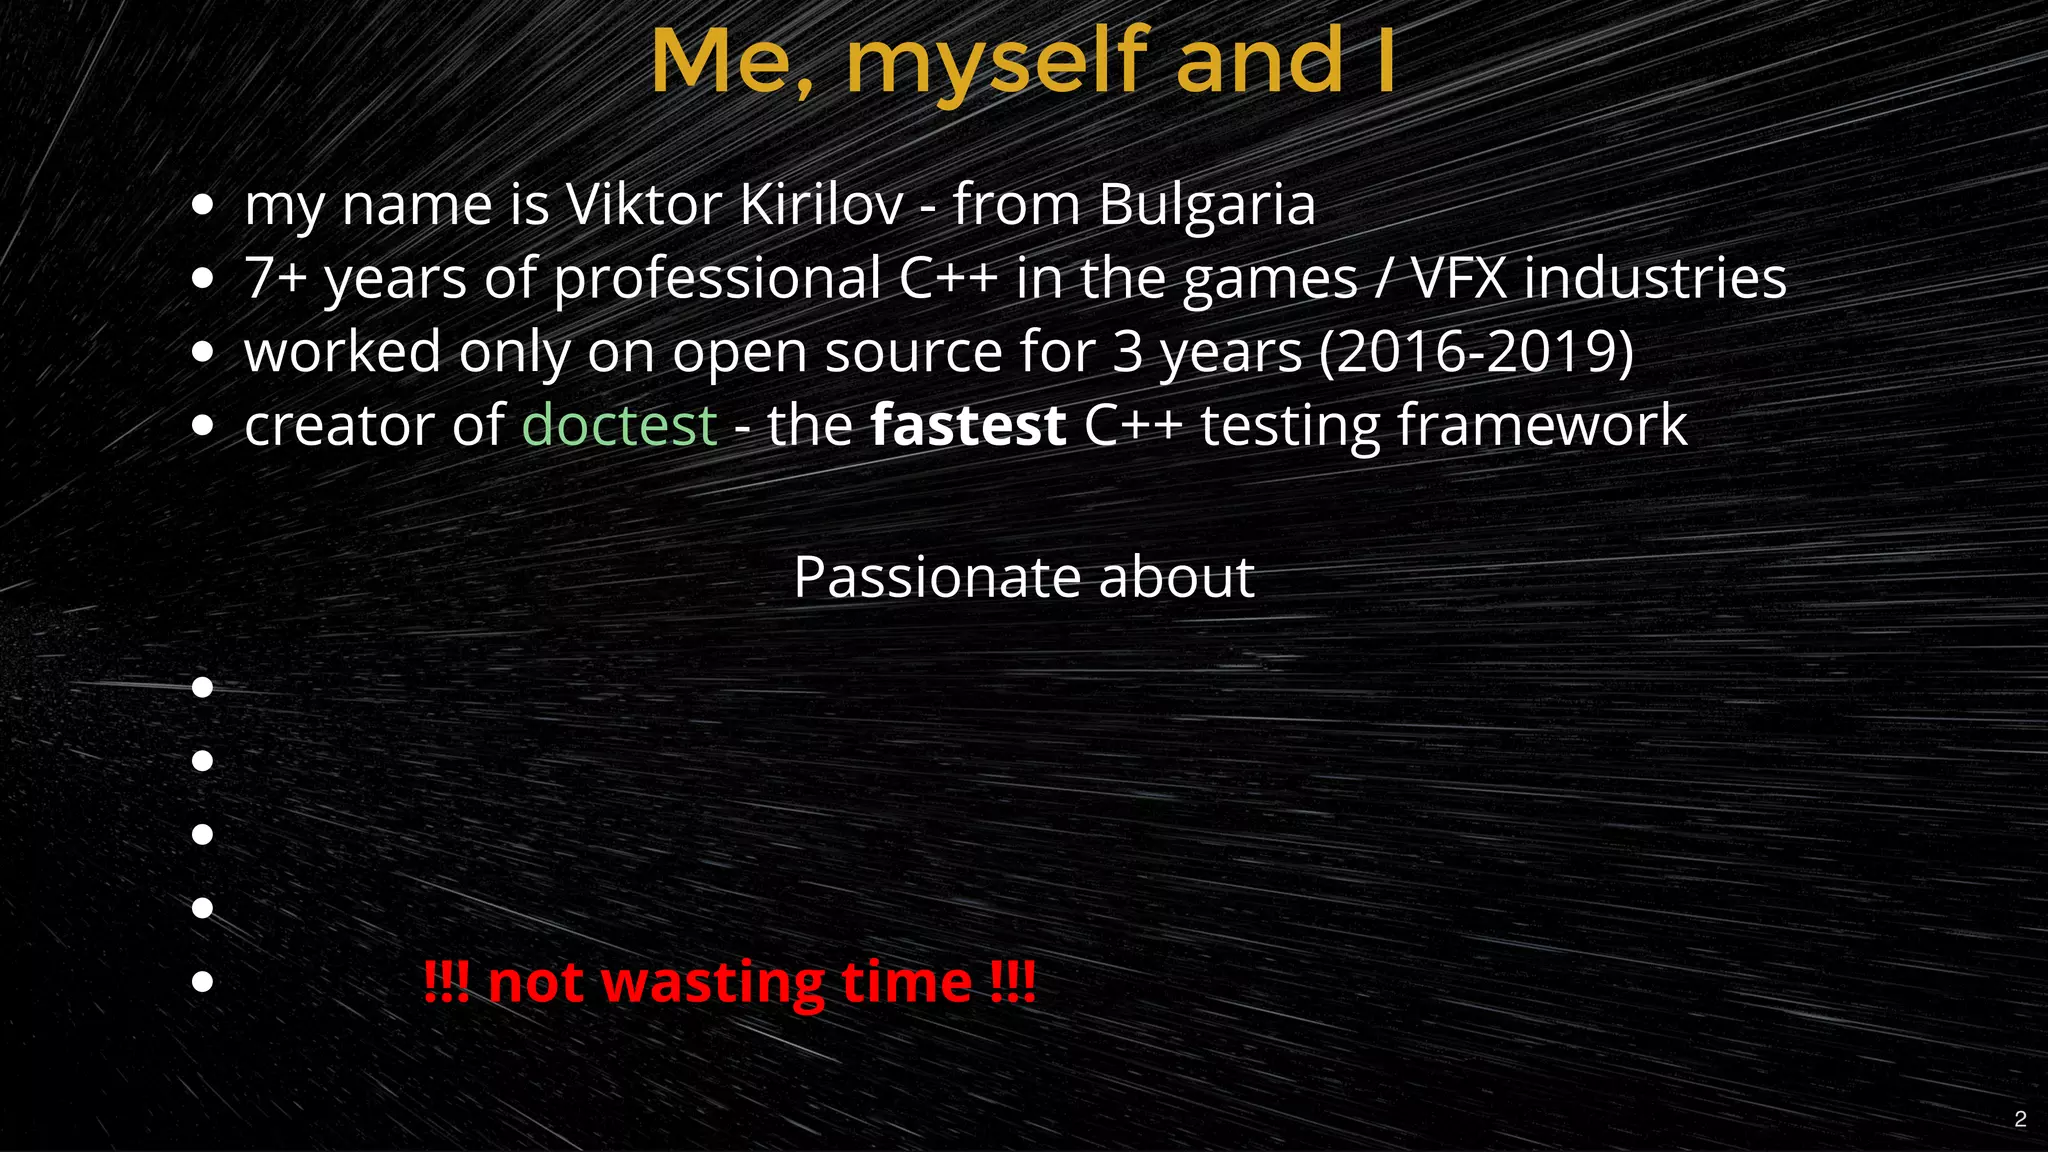
Introduction of Viktor Kirilov and his experience in C++ along with his framework for fast testing.
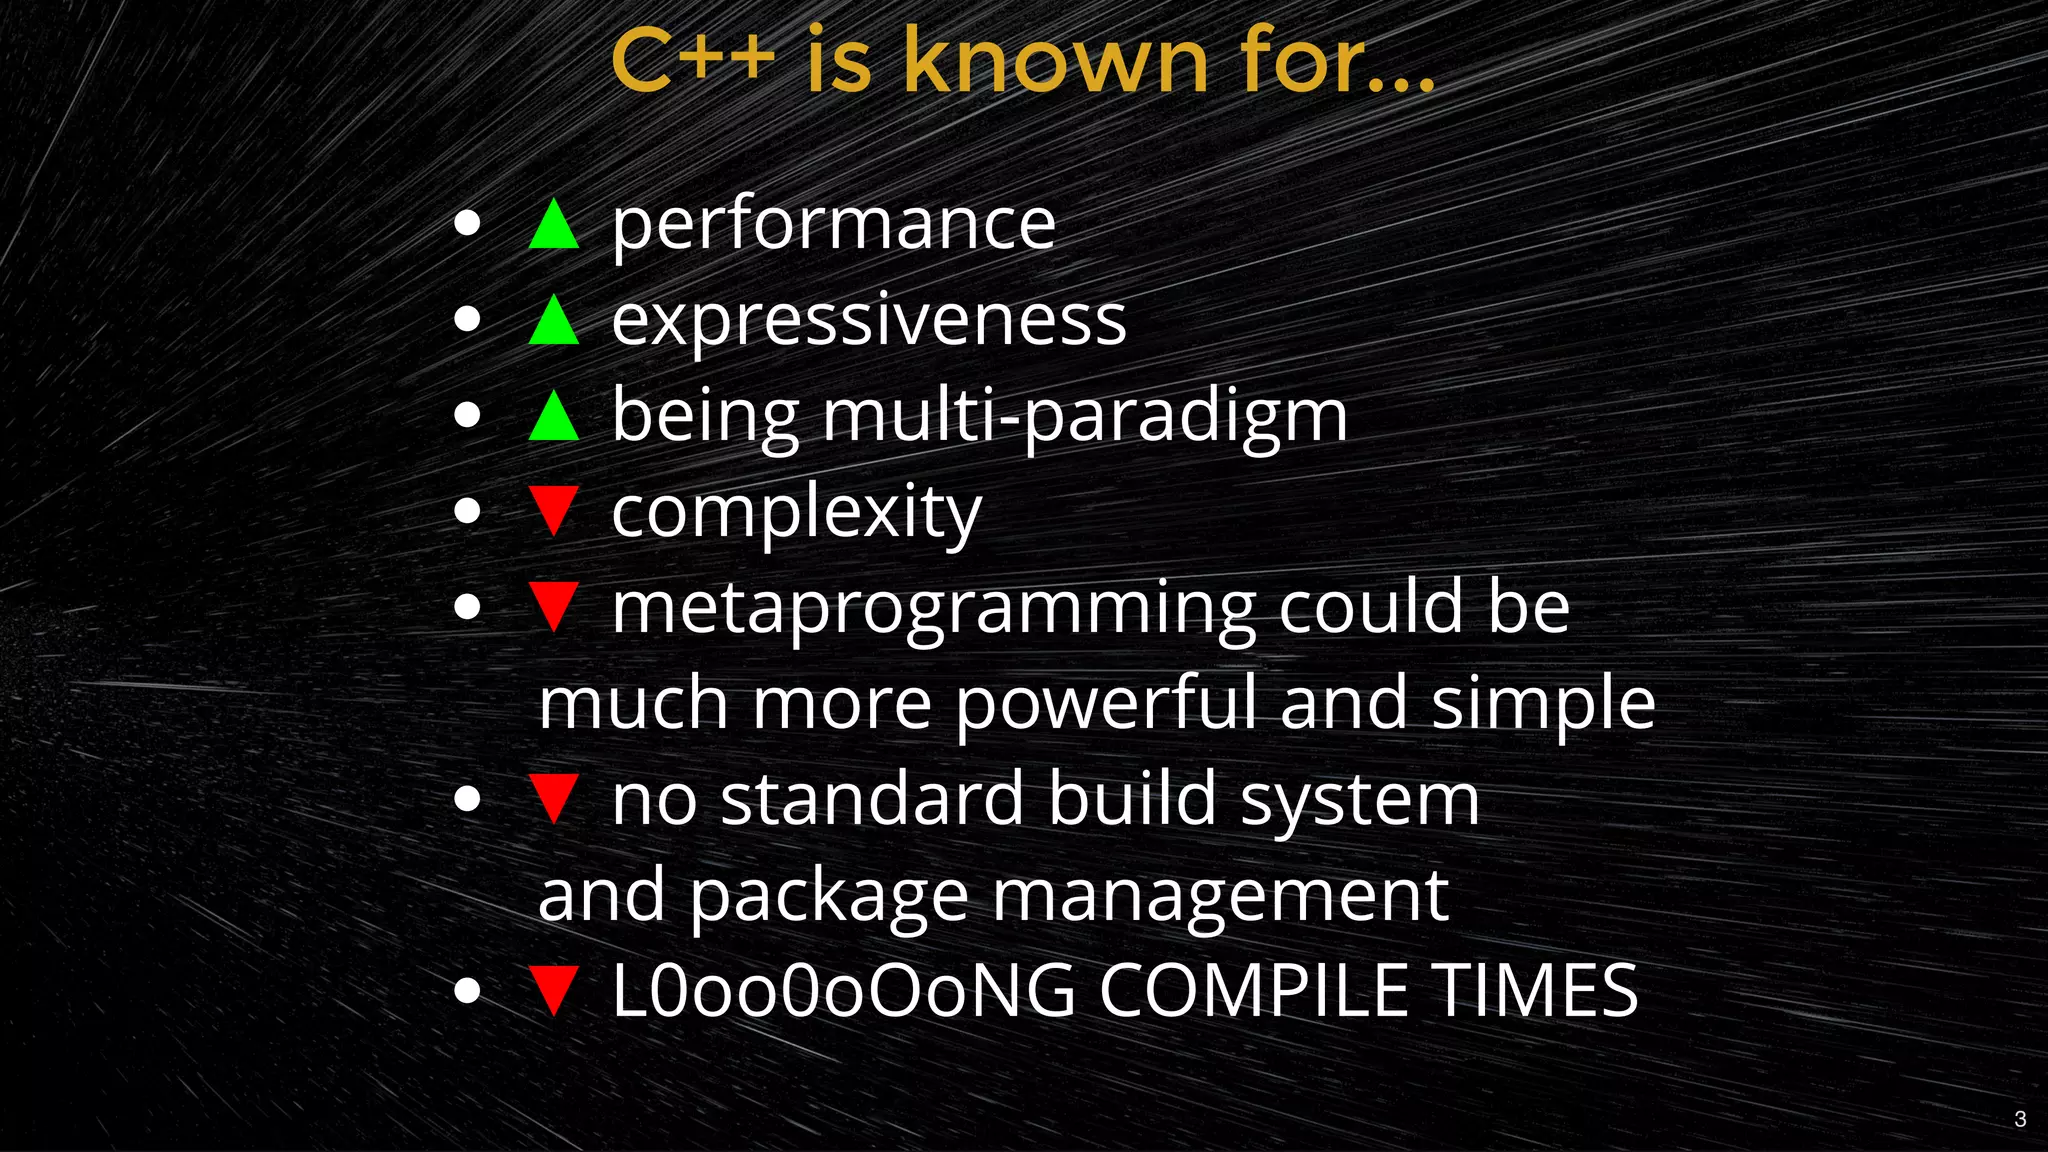
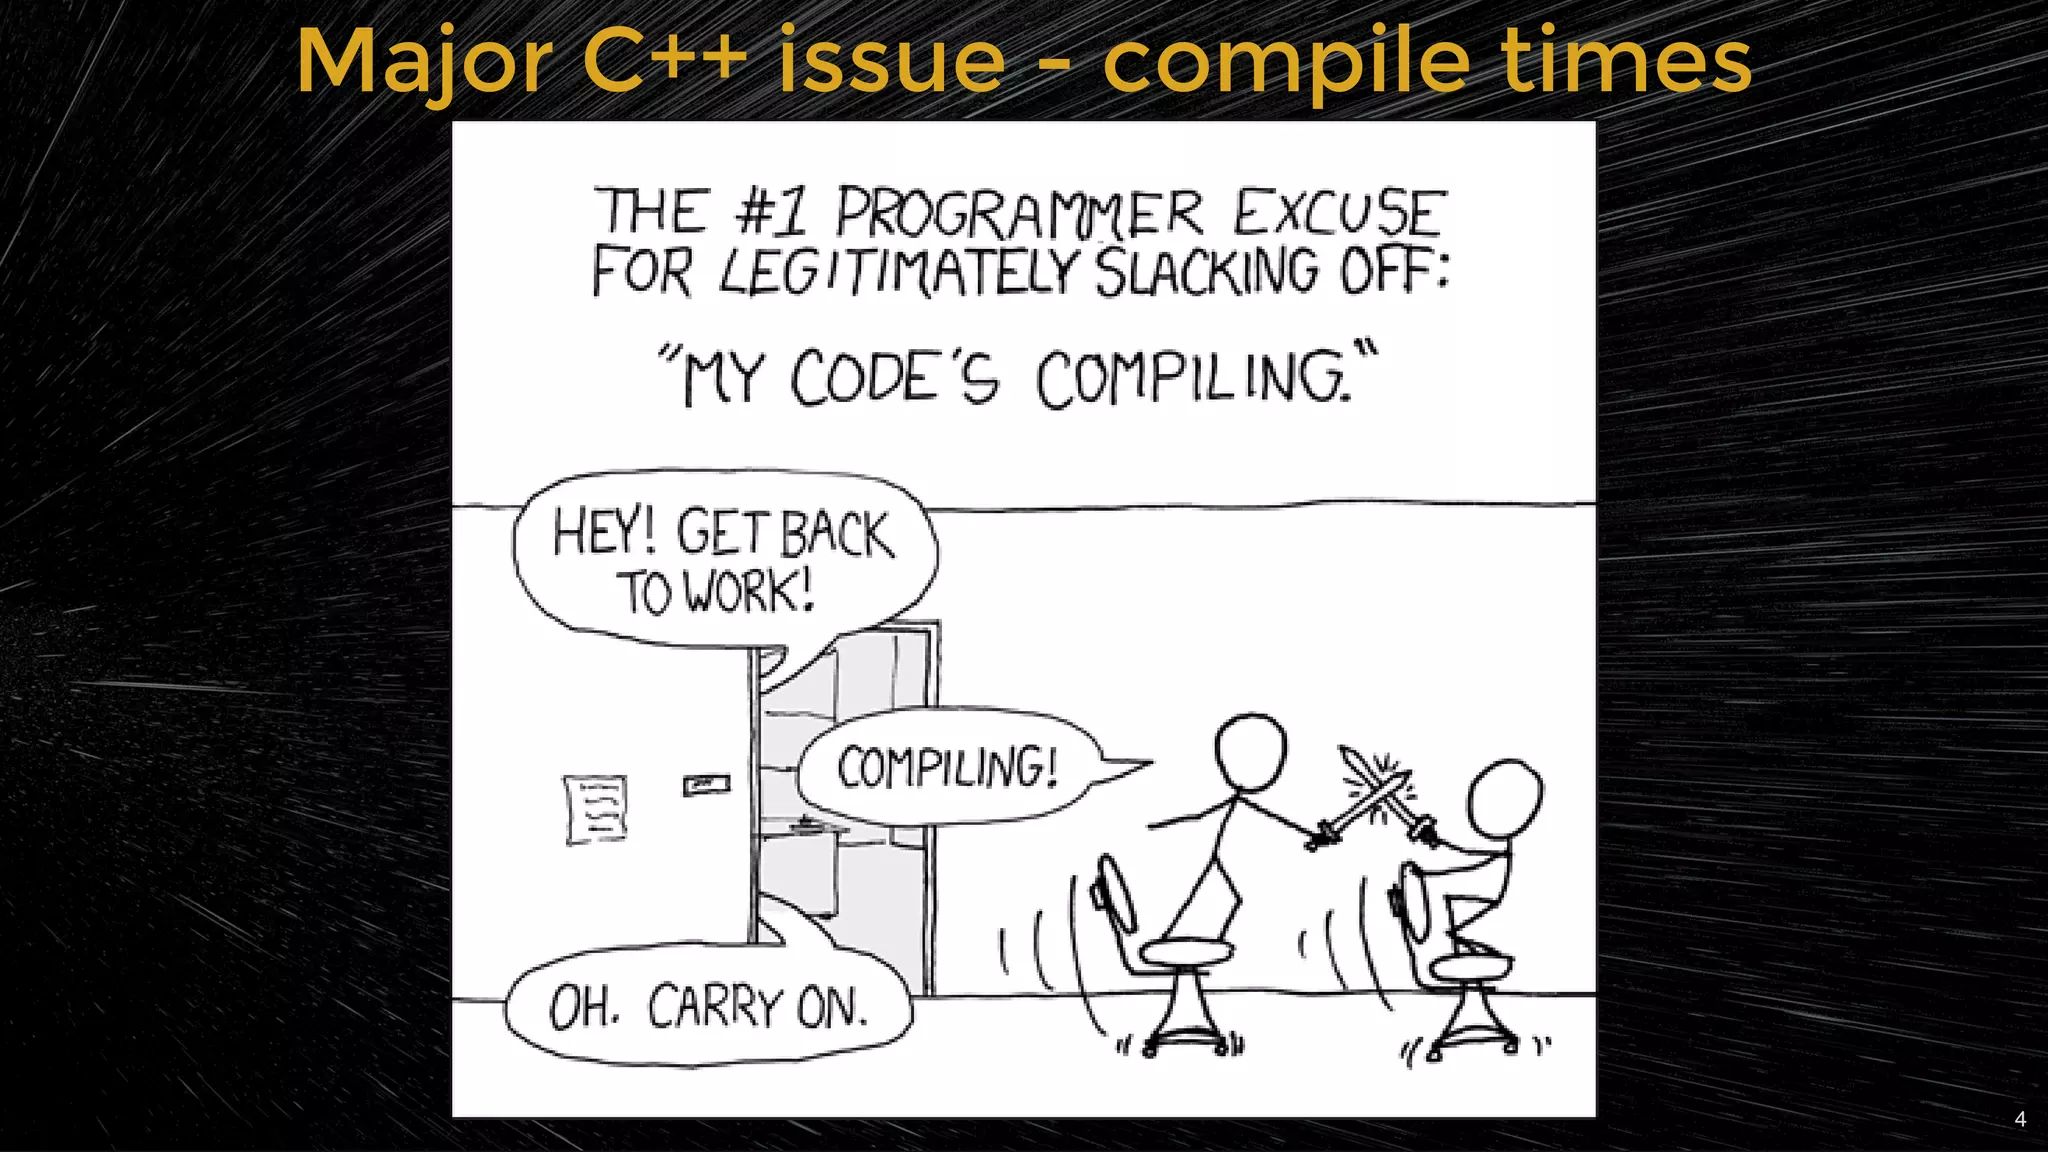
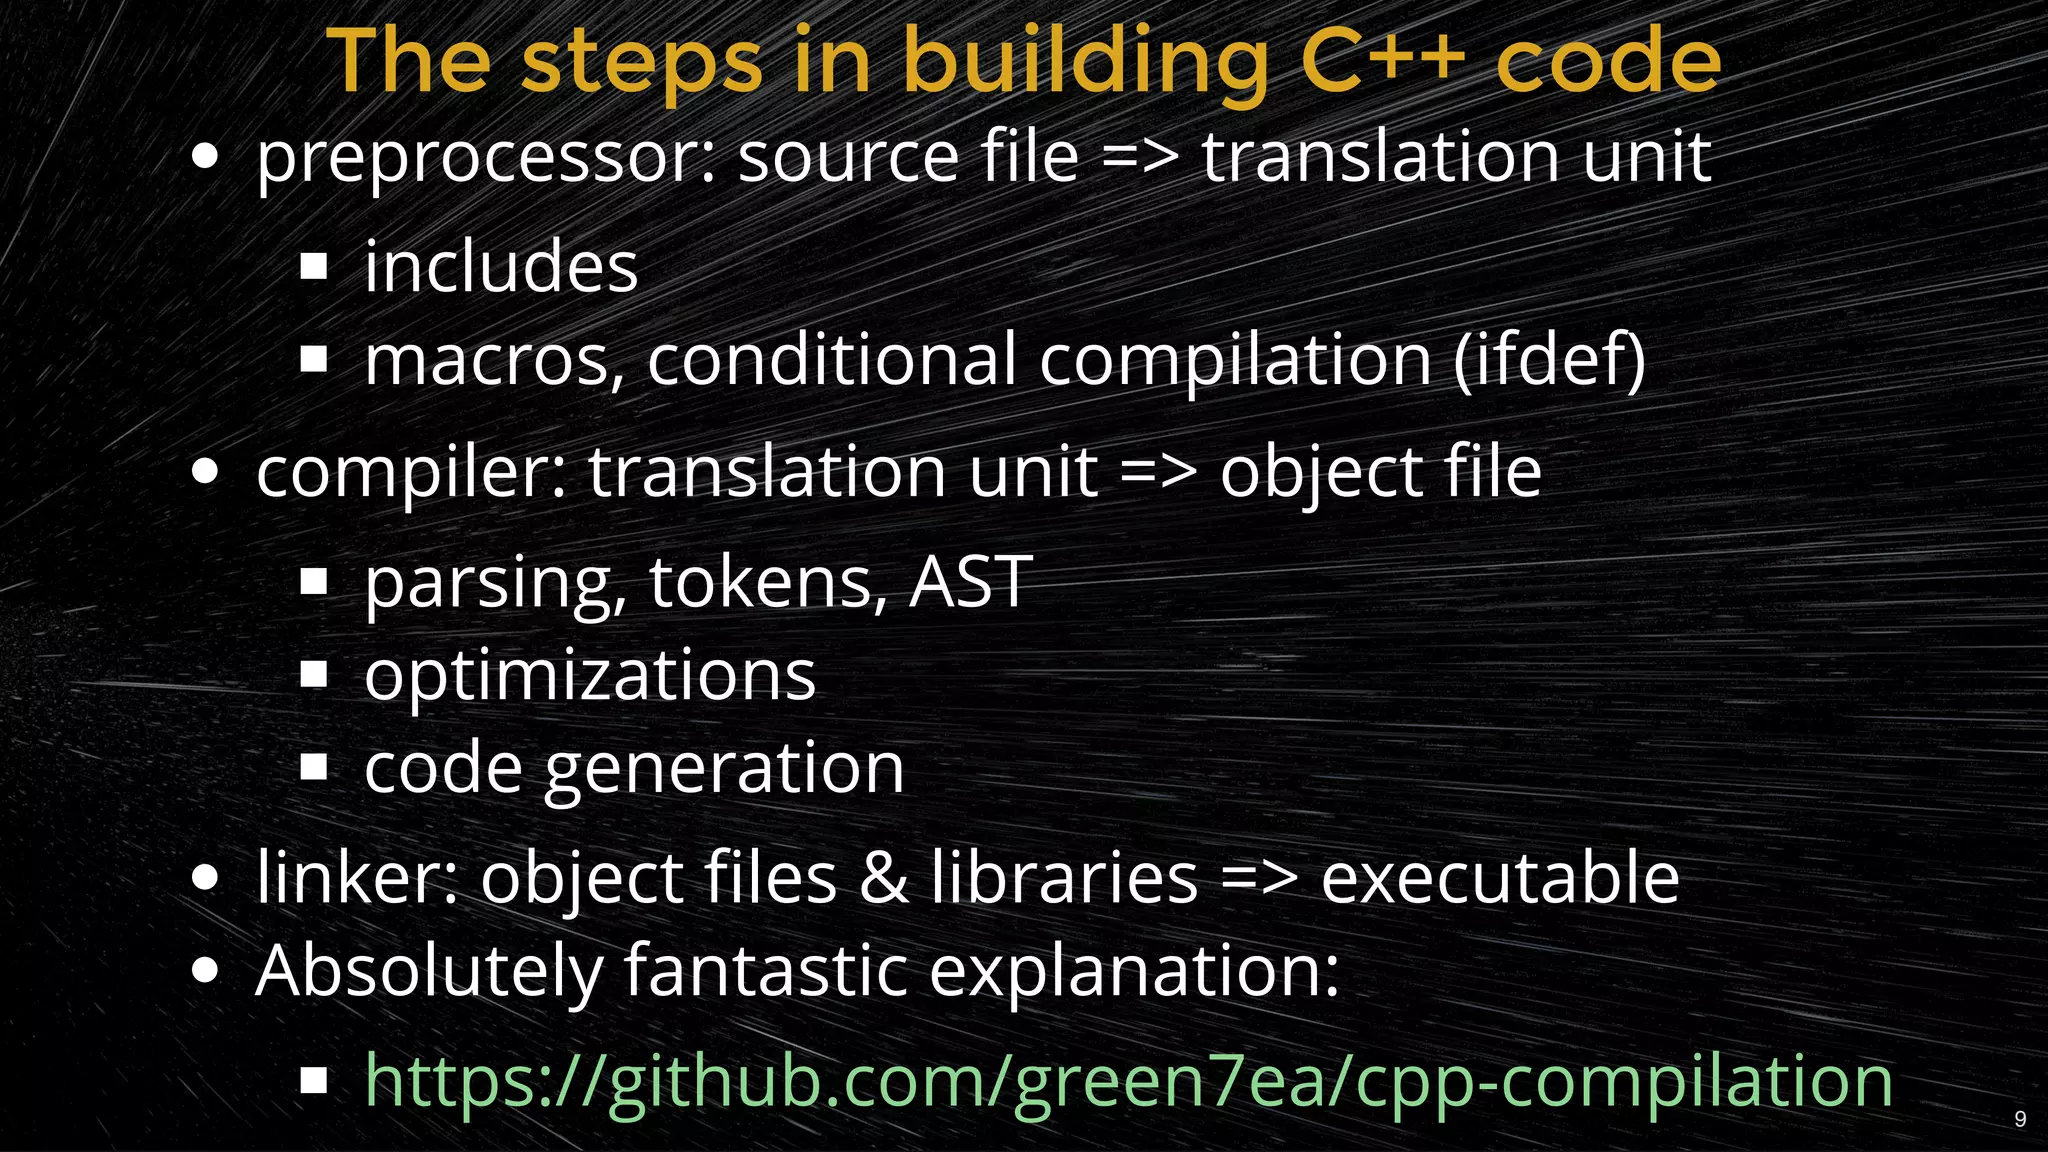
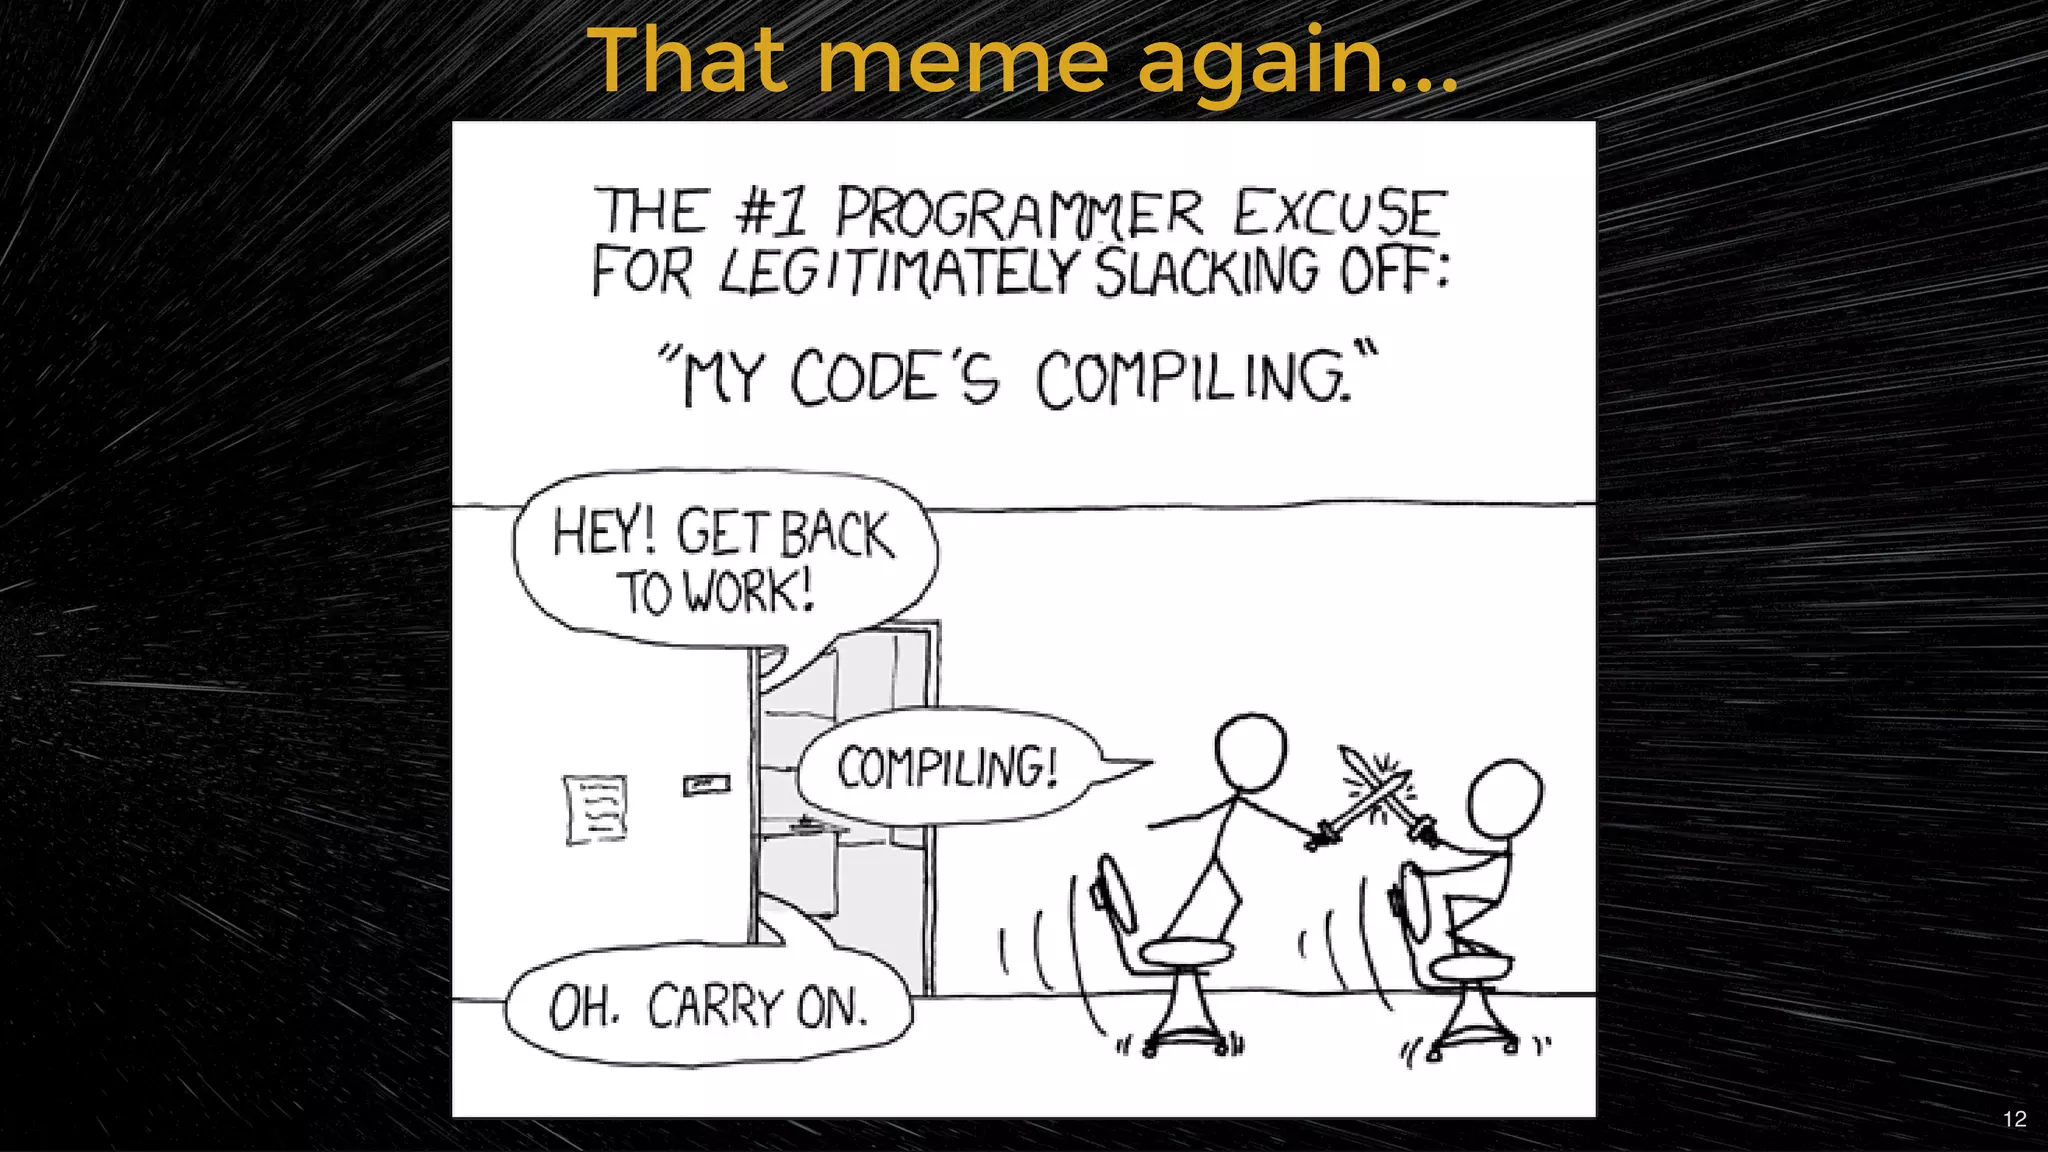
C++ offers performance but has long compile times due to various complexities.
Outline of the presentation covering topics like precompiled headers, caching, build systems, and diagnostics.
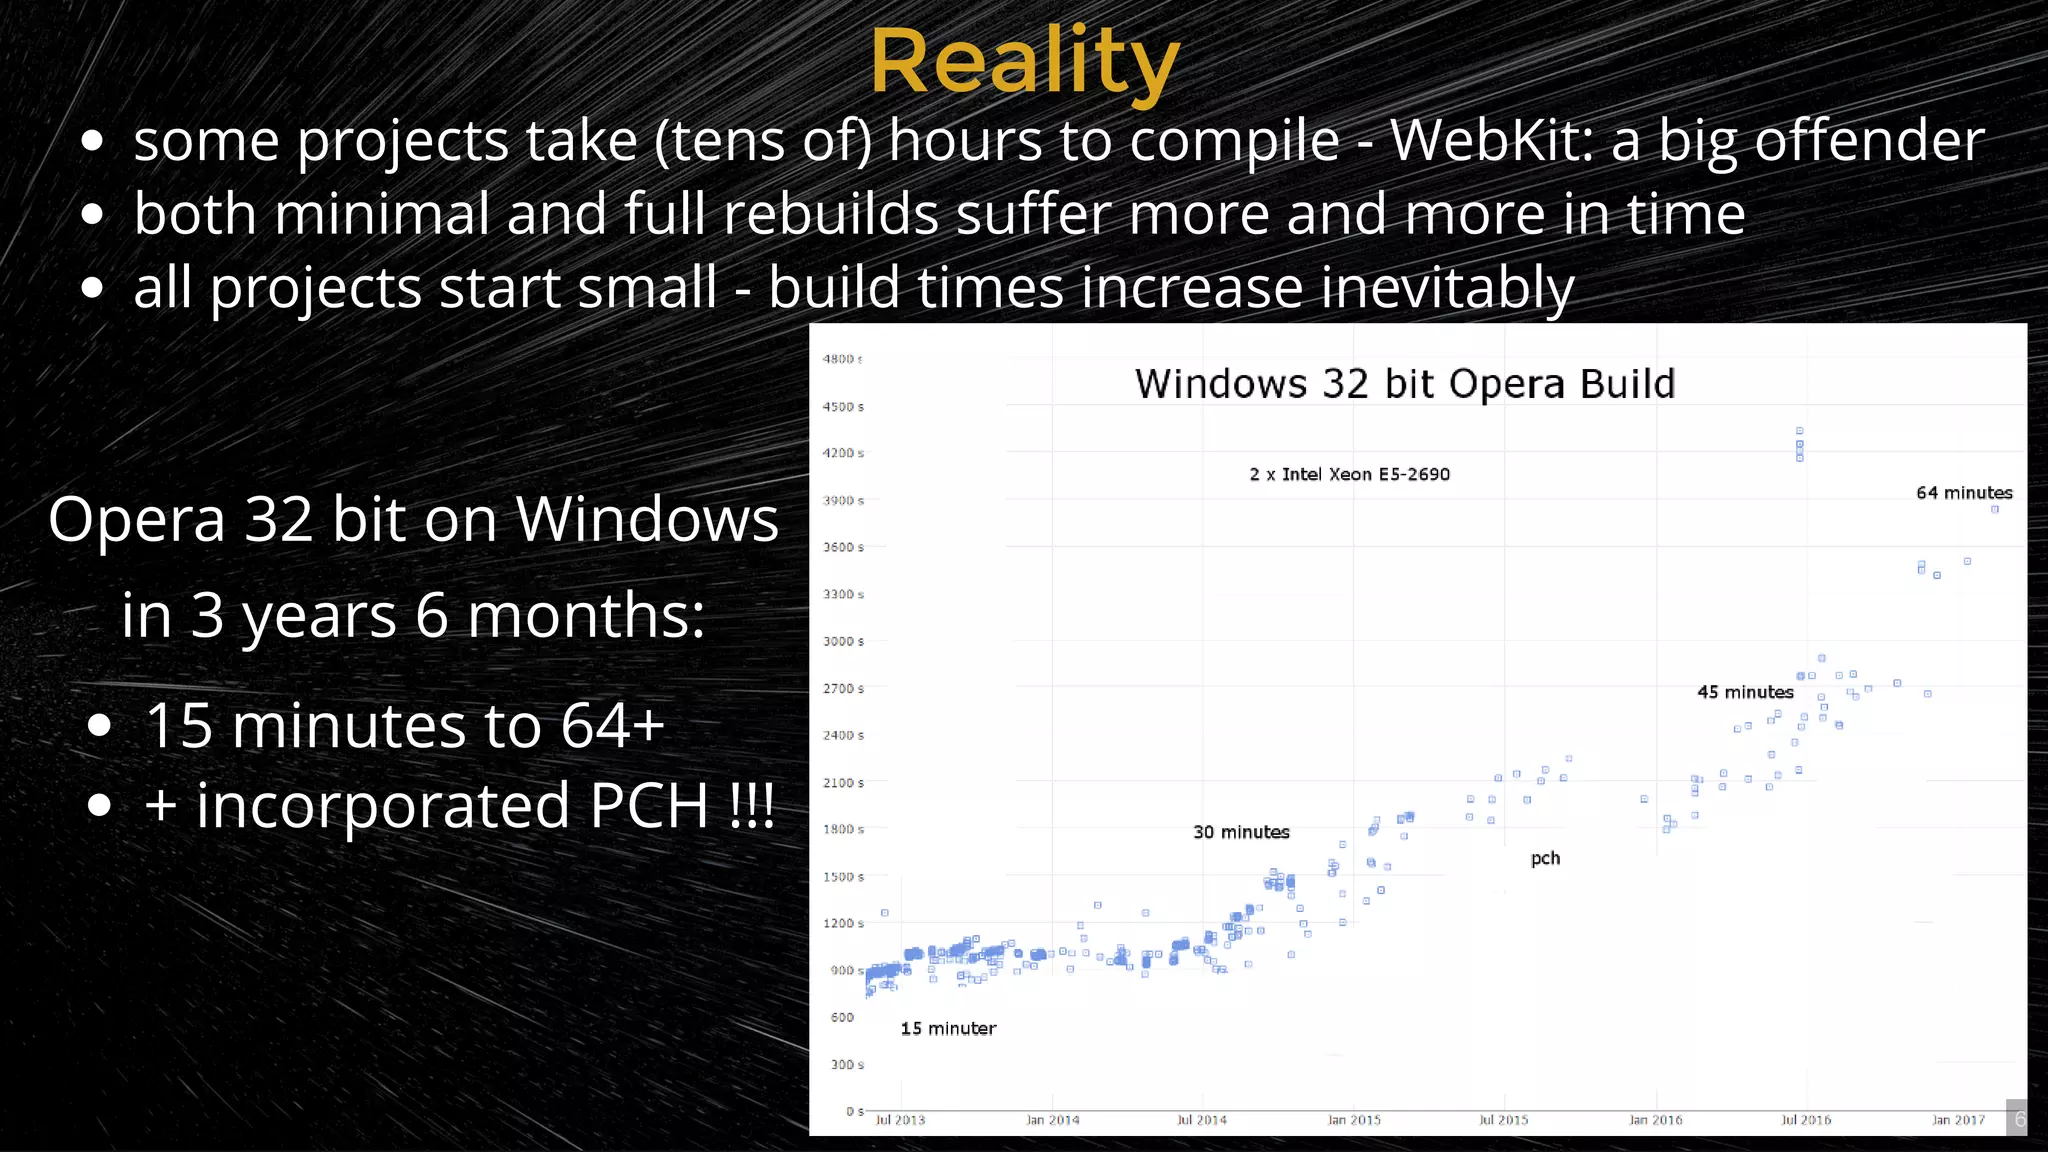
Some projects take excessive hours to compile; WebKit is cited as a major offender leading to increased build times.
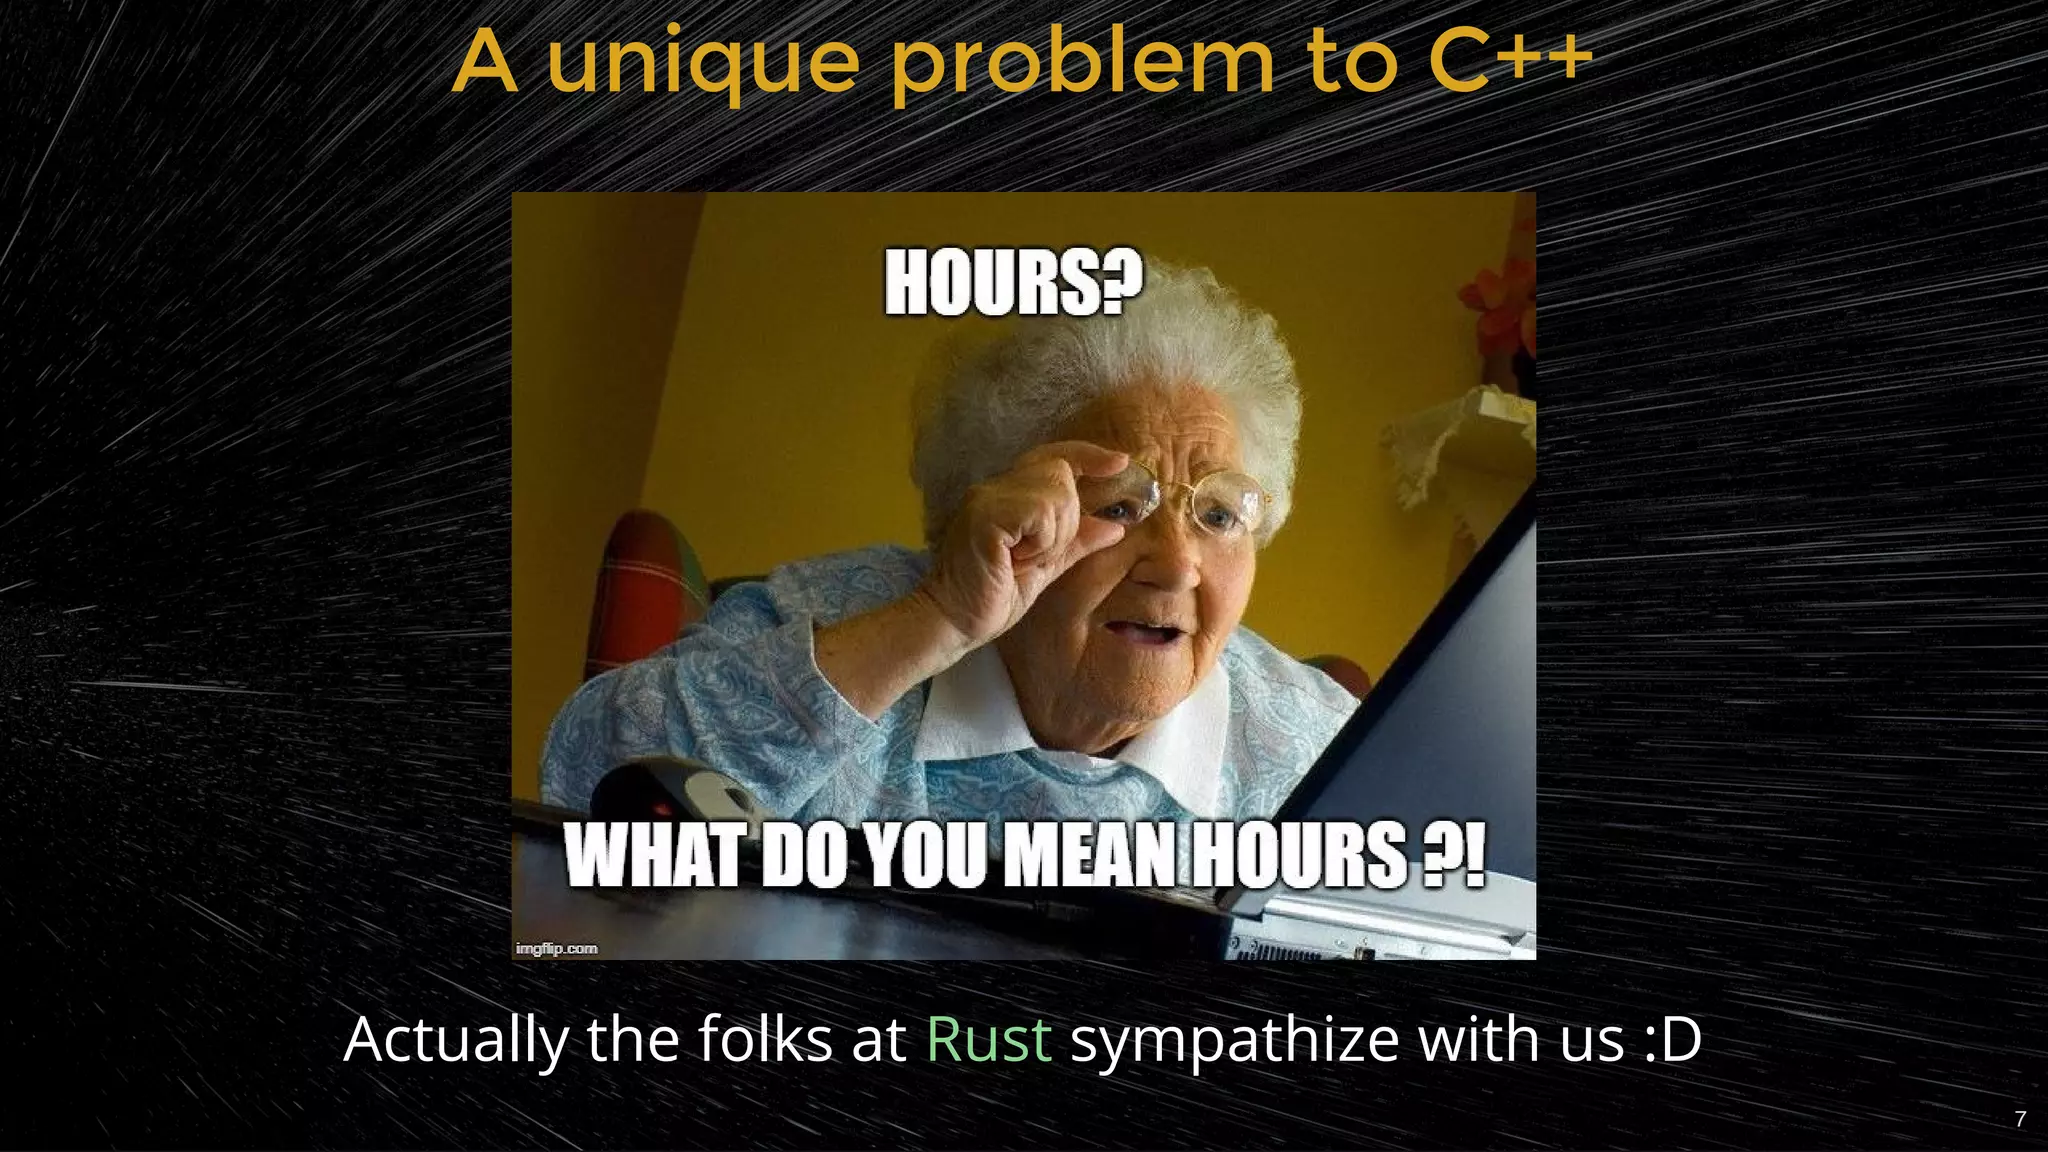
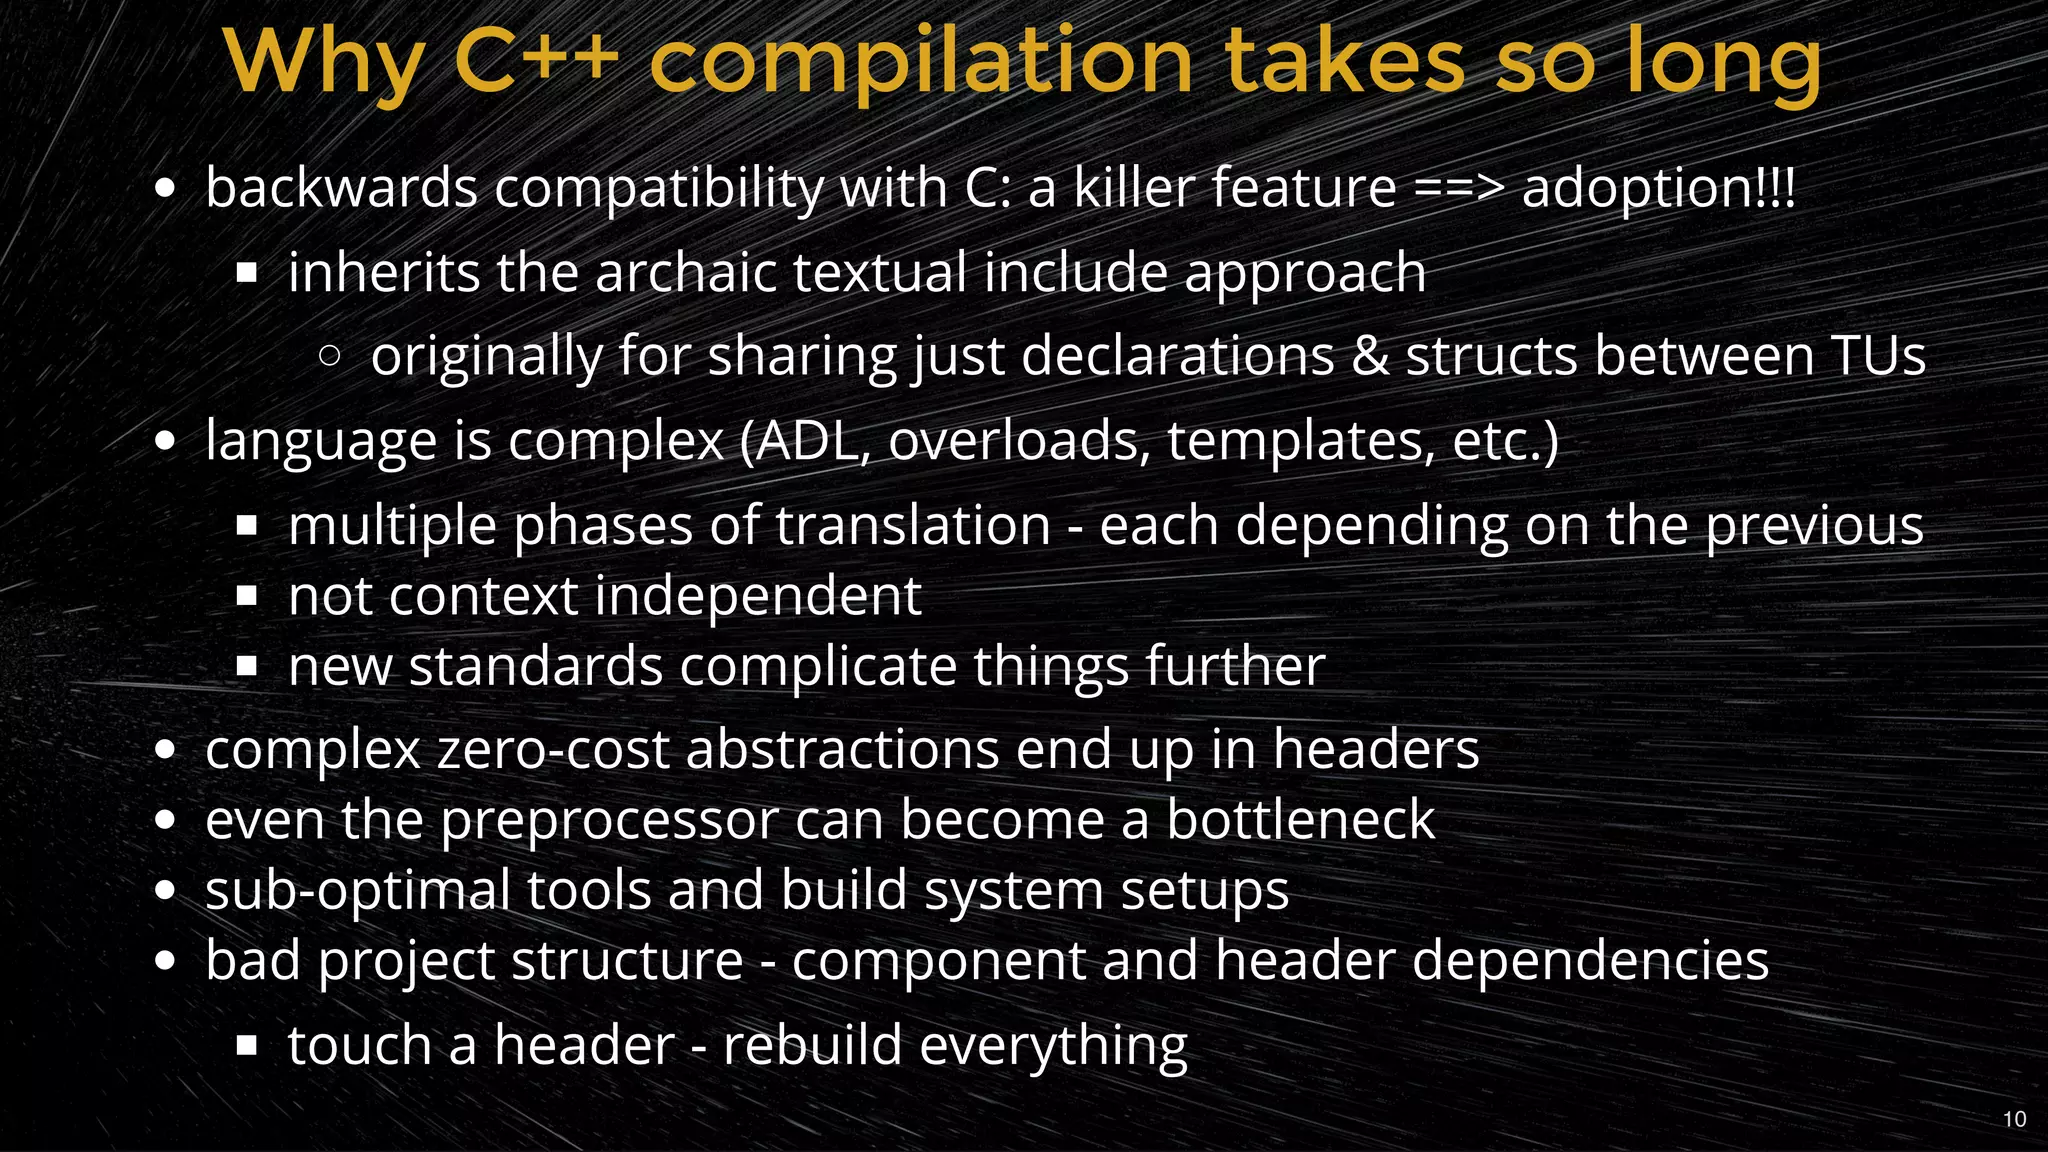
C++ has unique complications causing long compile times, particularly due to its complexity and inclusion model.
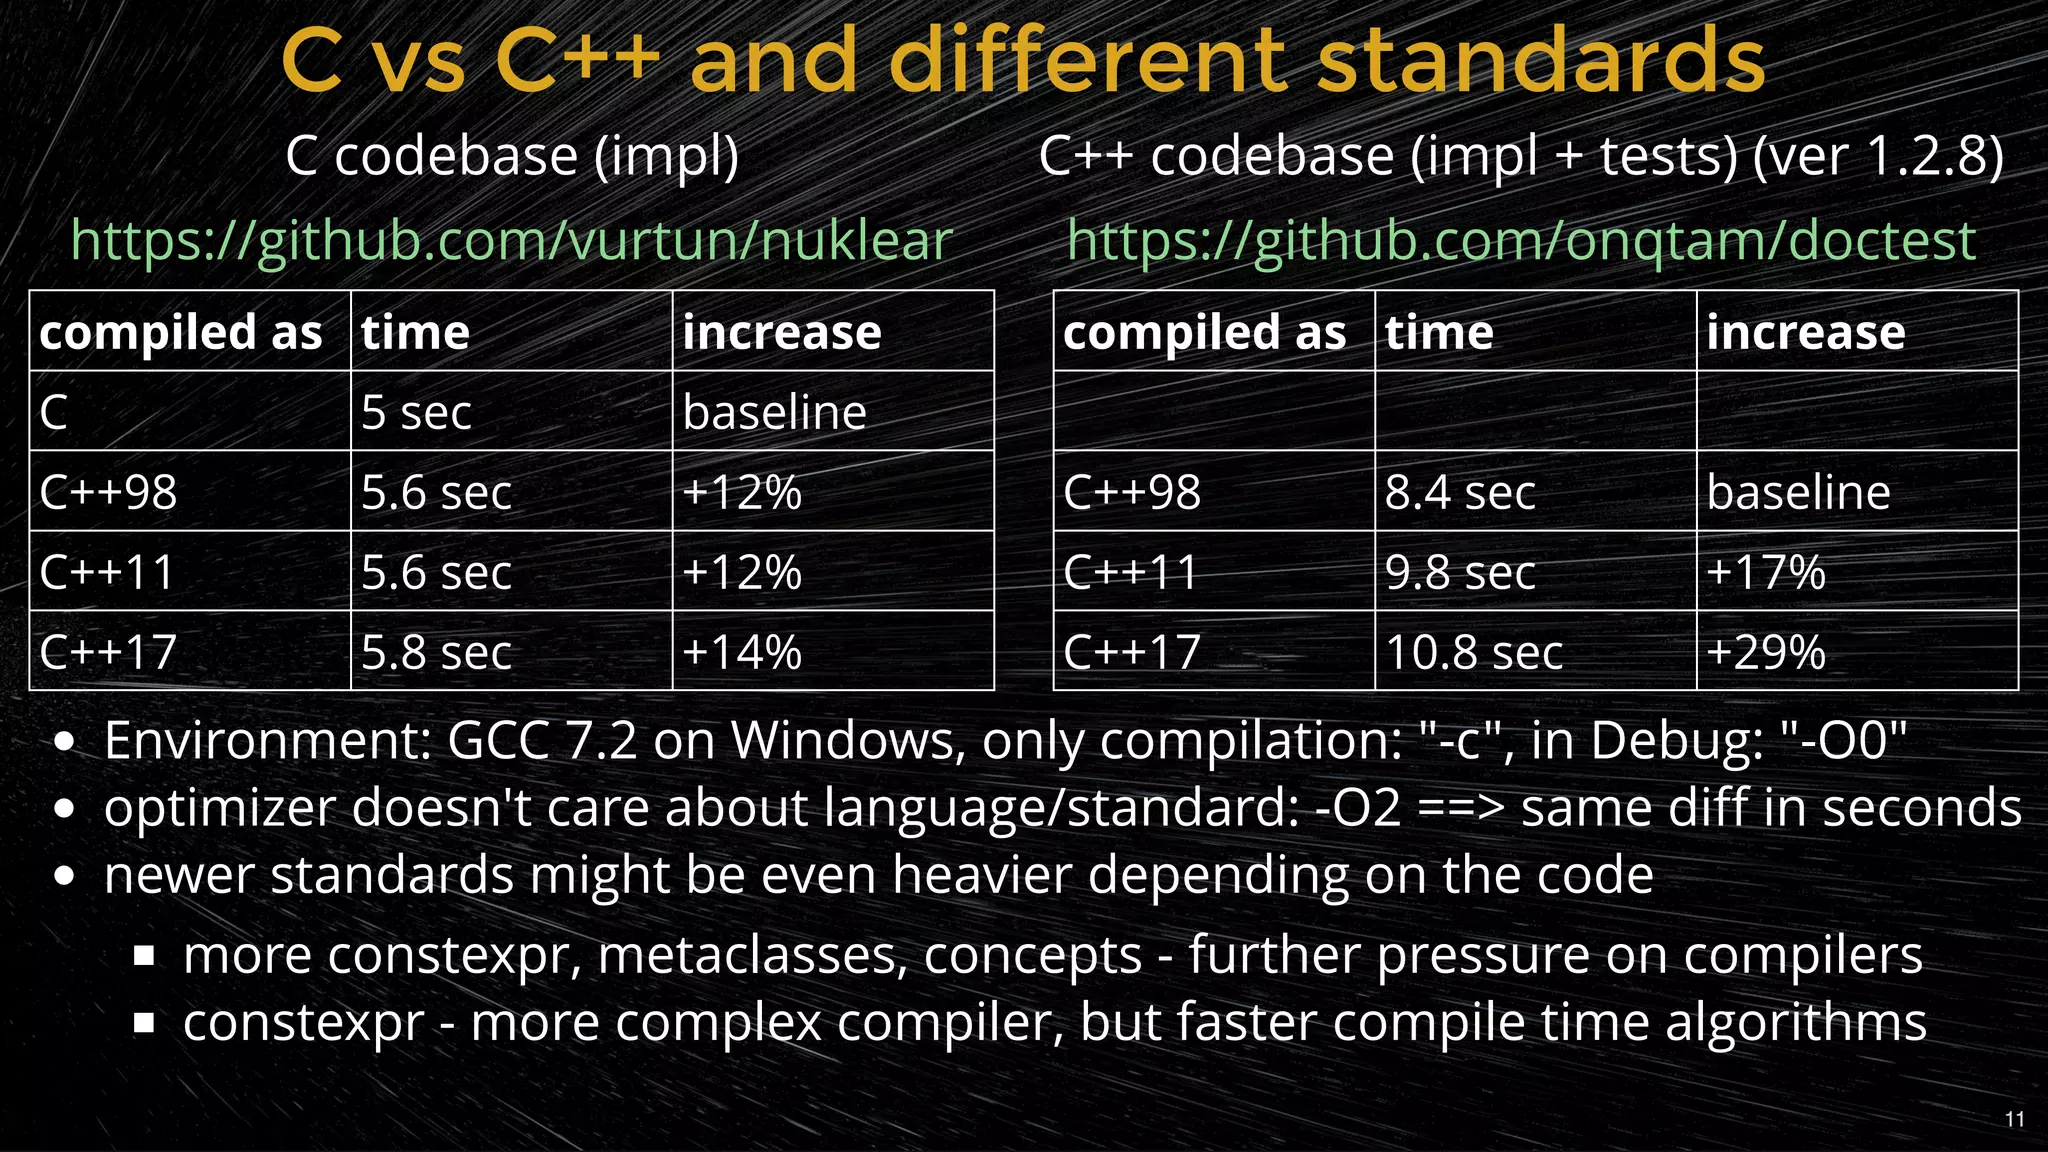
Comparative data on compilation times for different C++ standards highlighting increasing times.
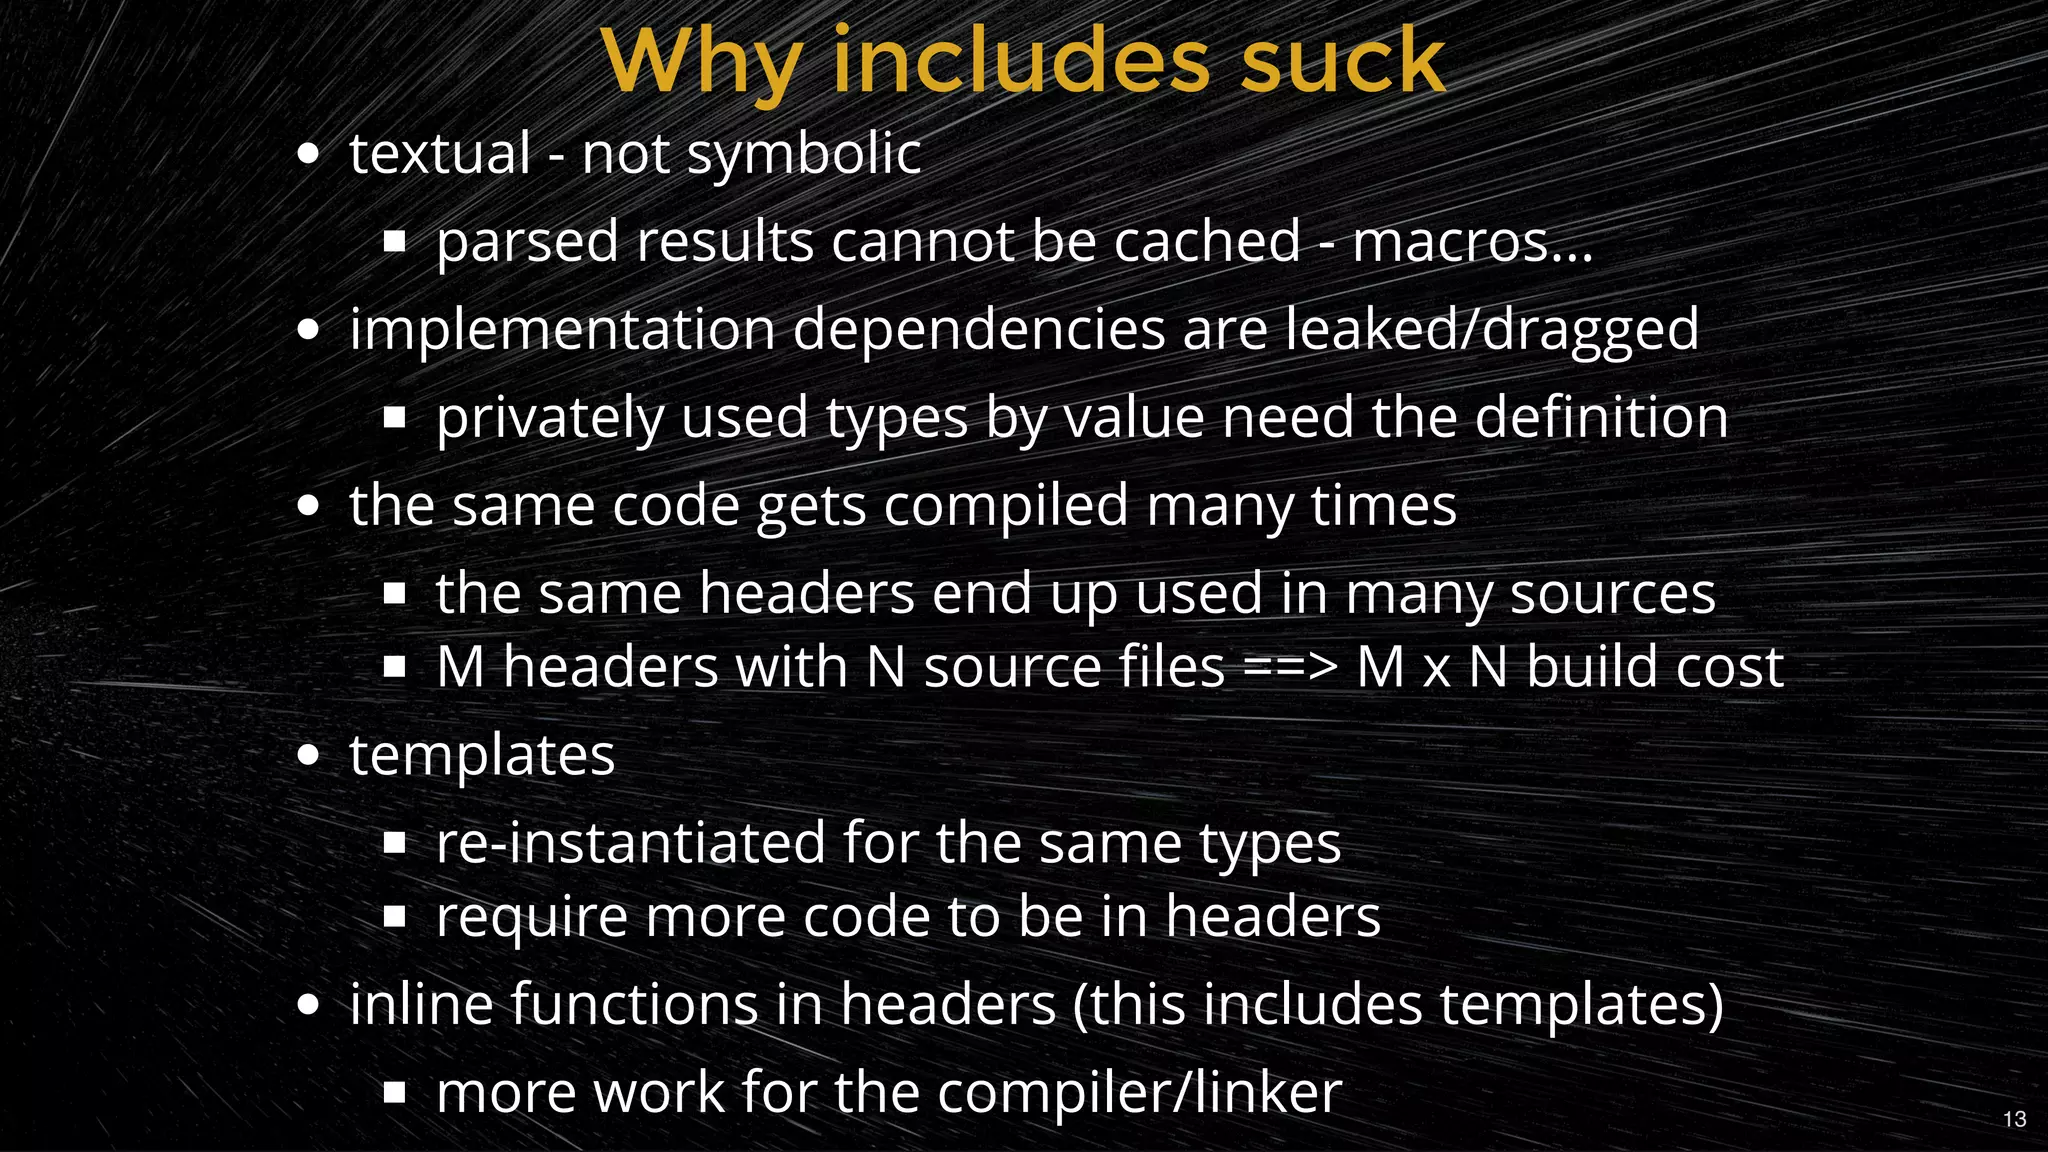
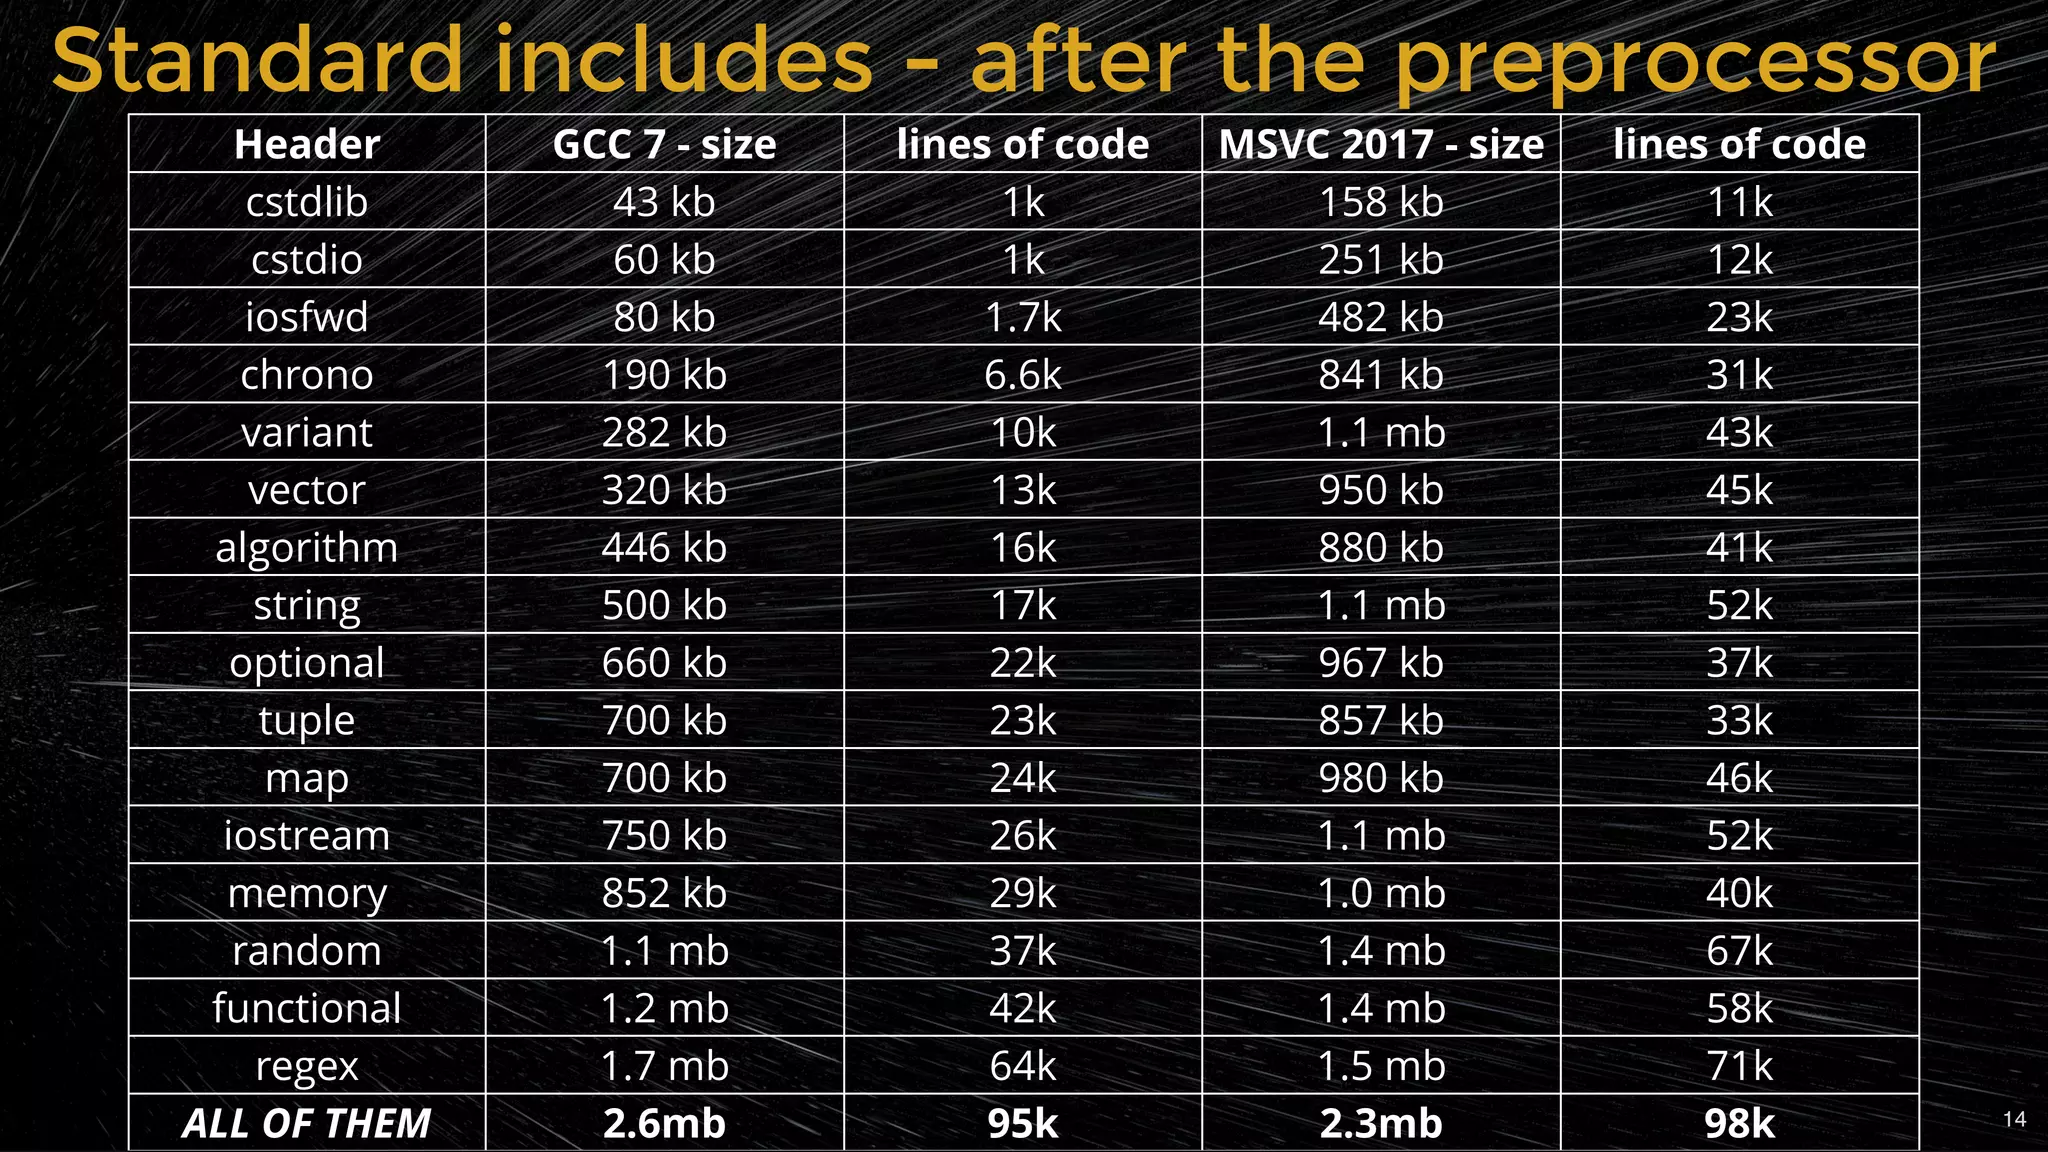
Discusses inefficiencies of header files and their impact on compilation times.
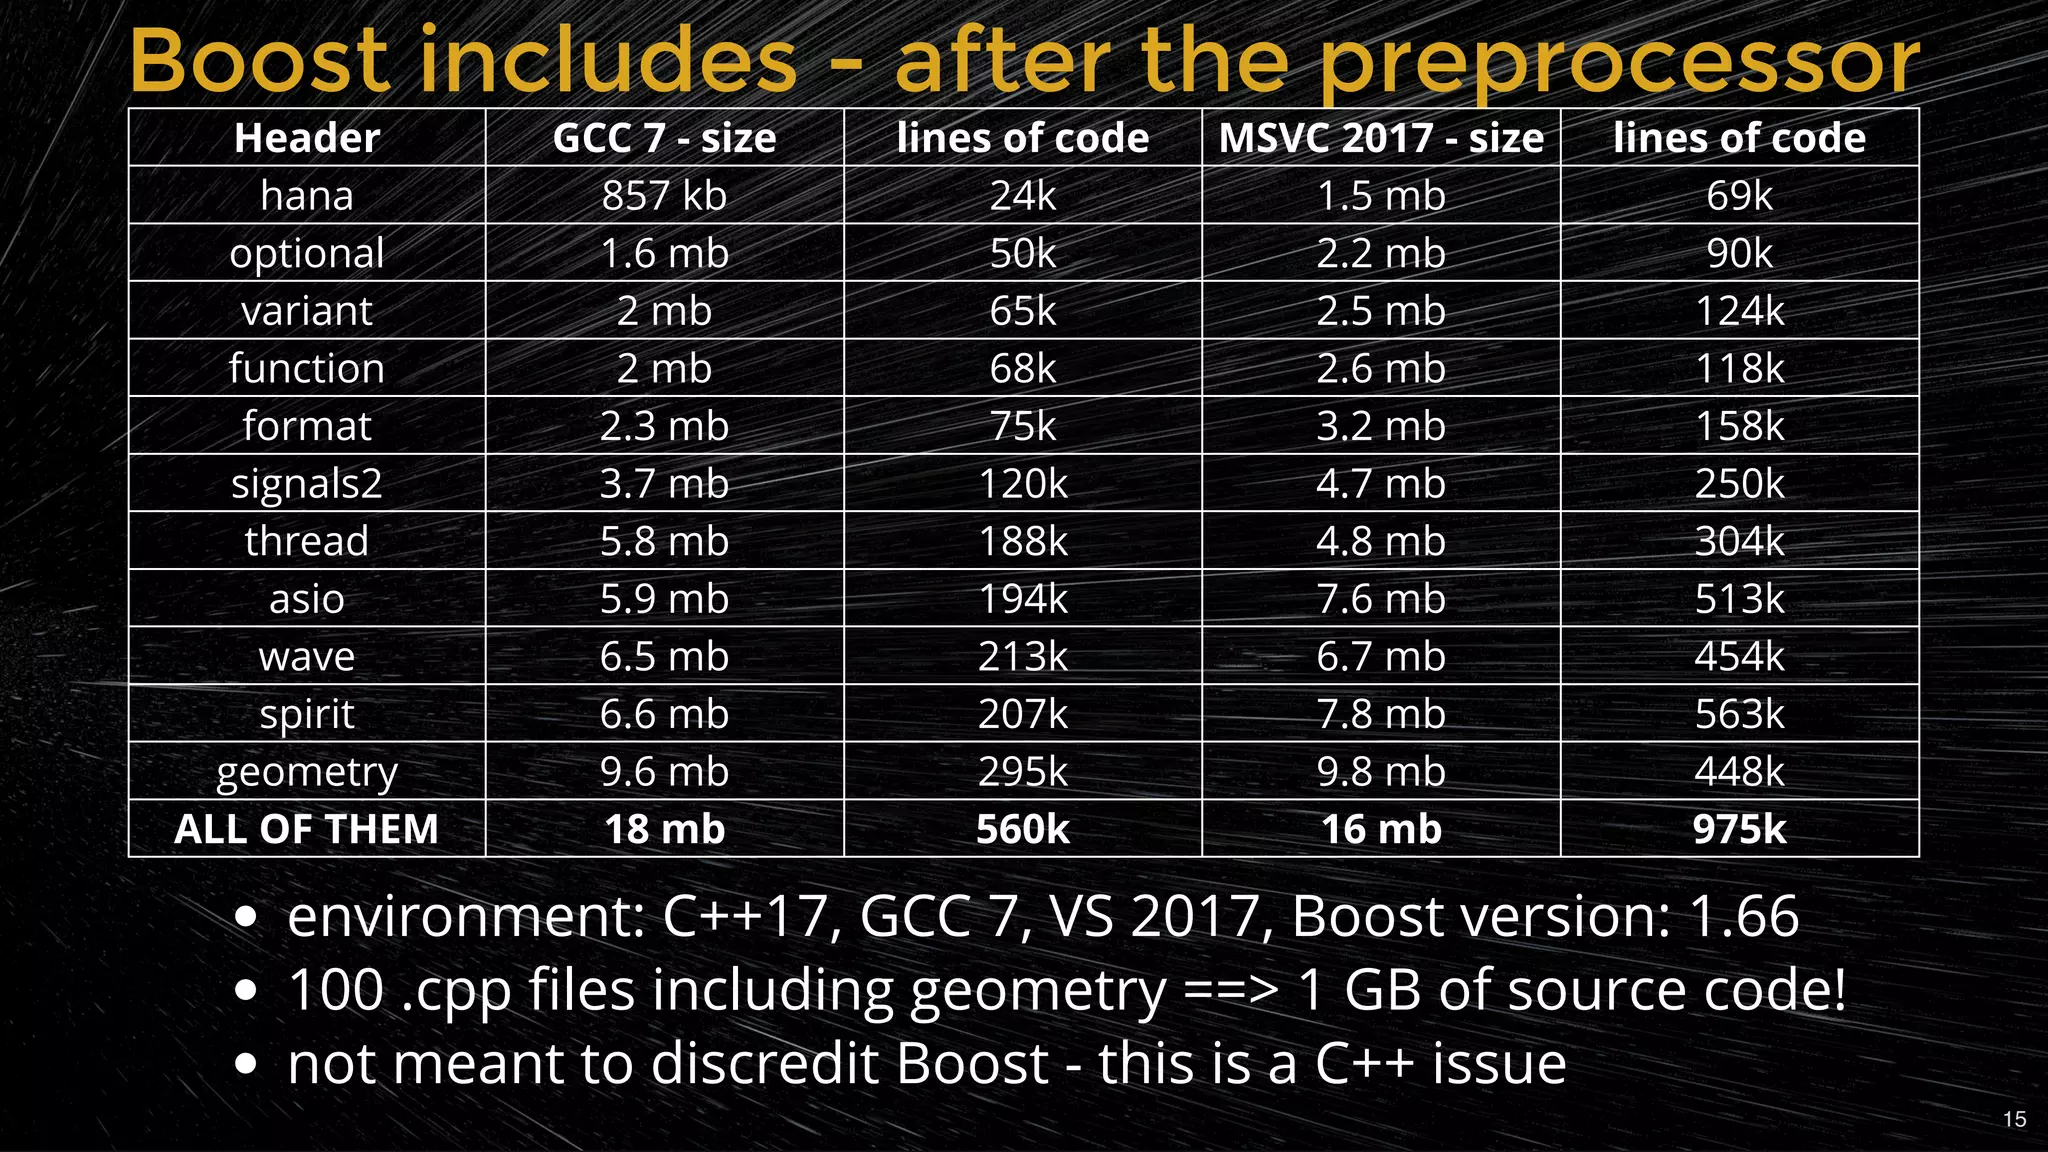
Analysis of the size of Boost libraries after preprocessing and its impact on compilation.
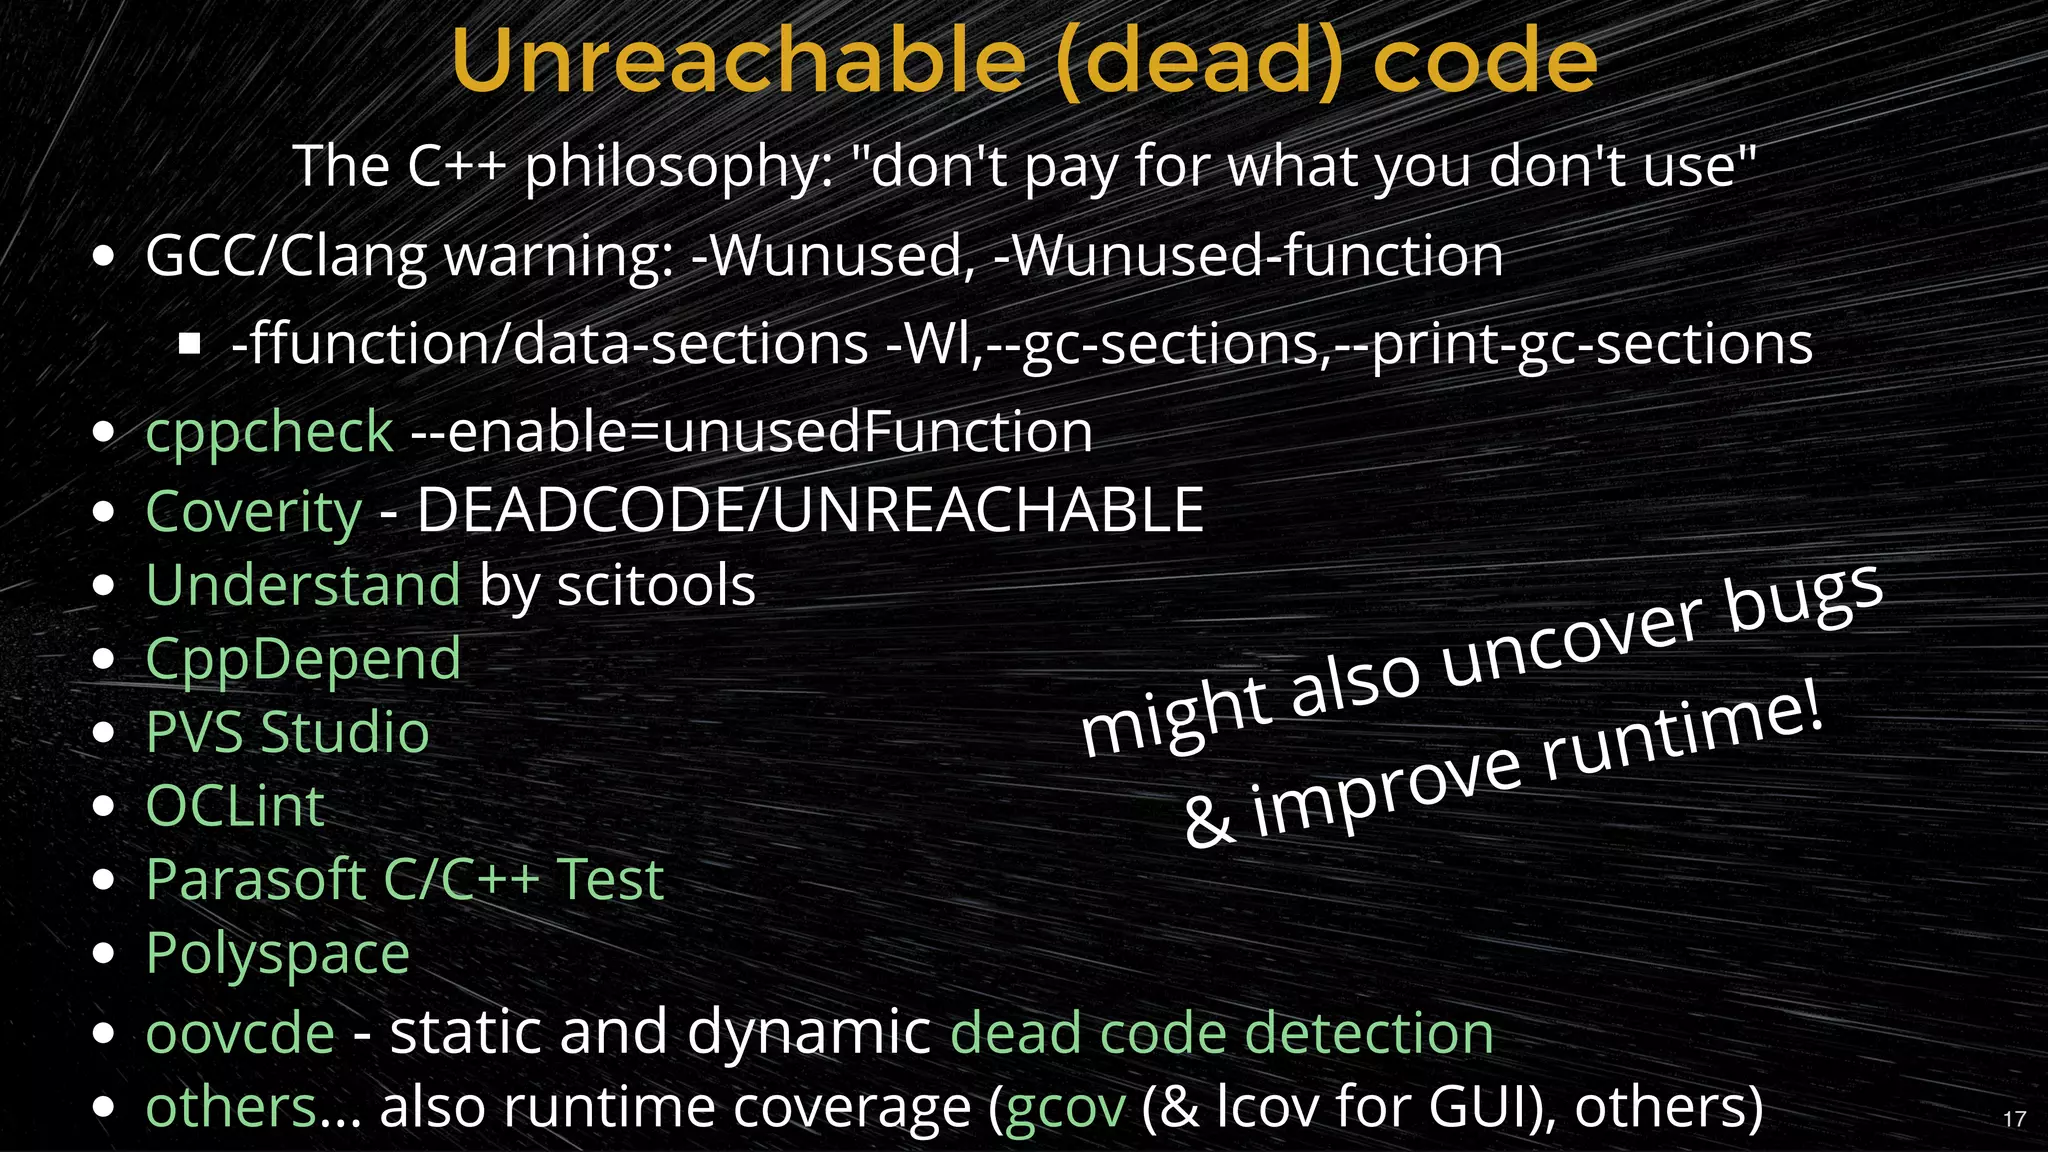
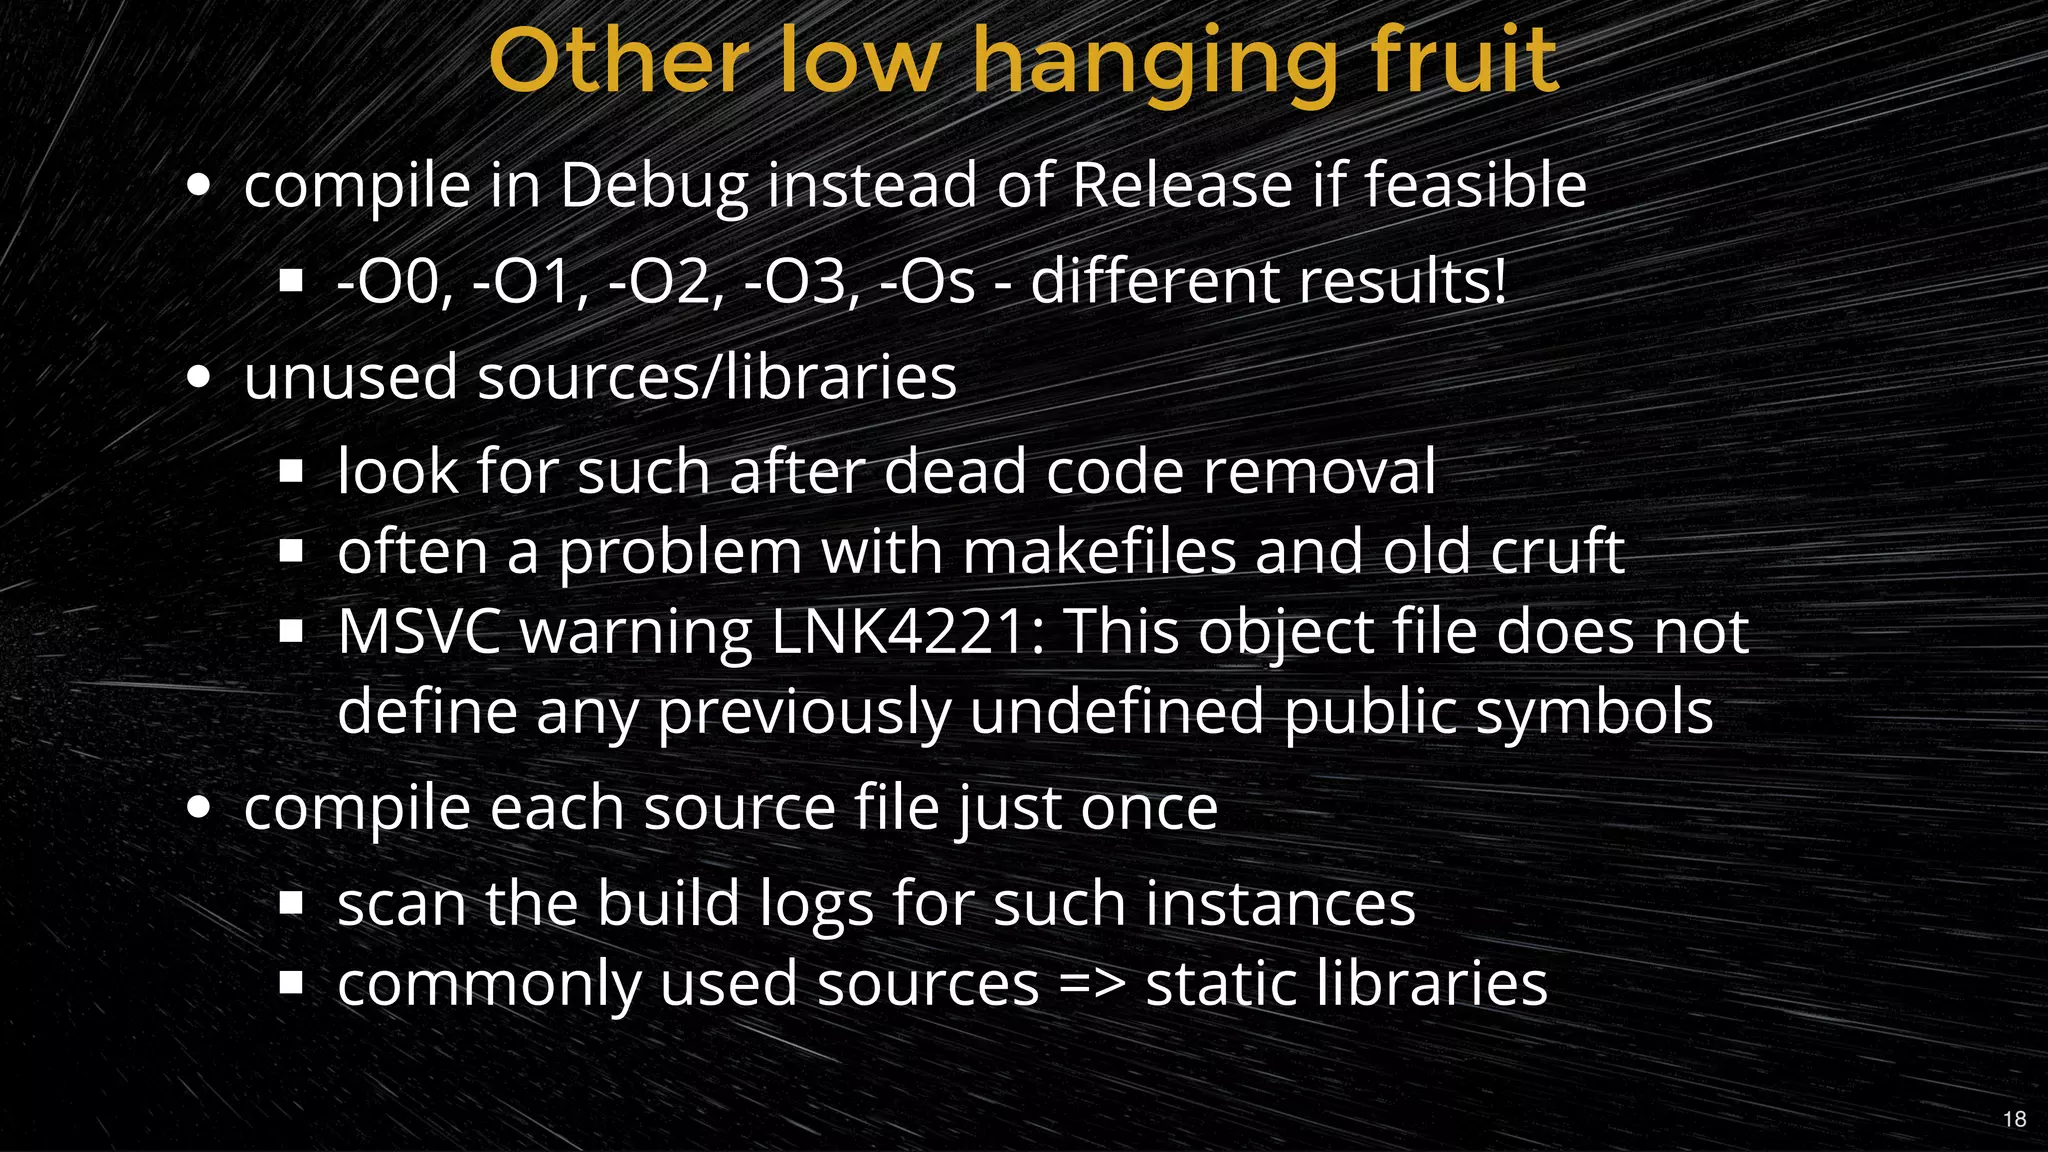
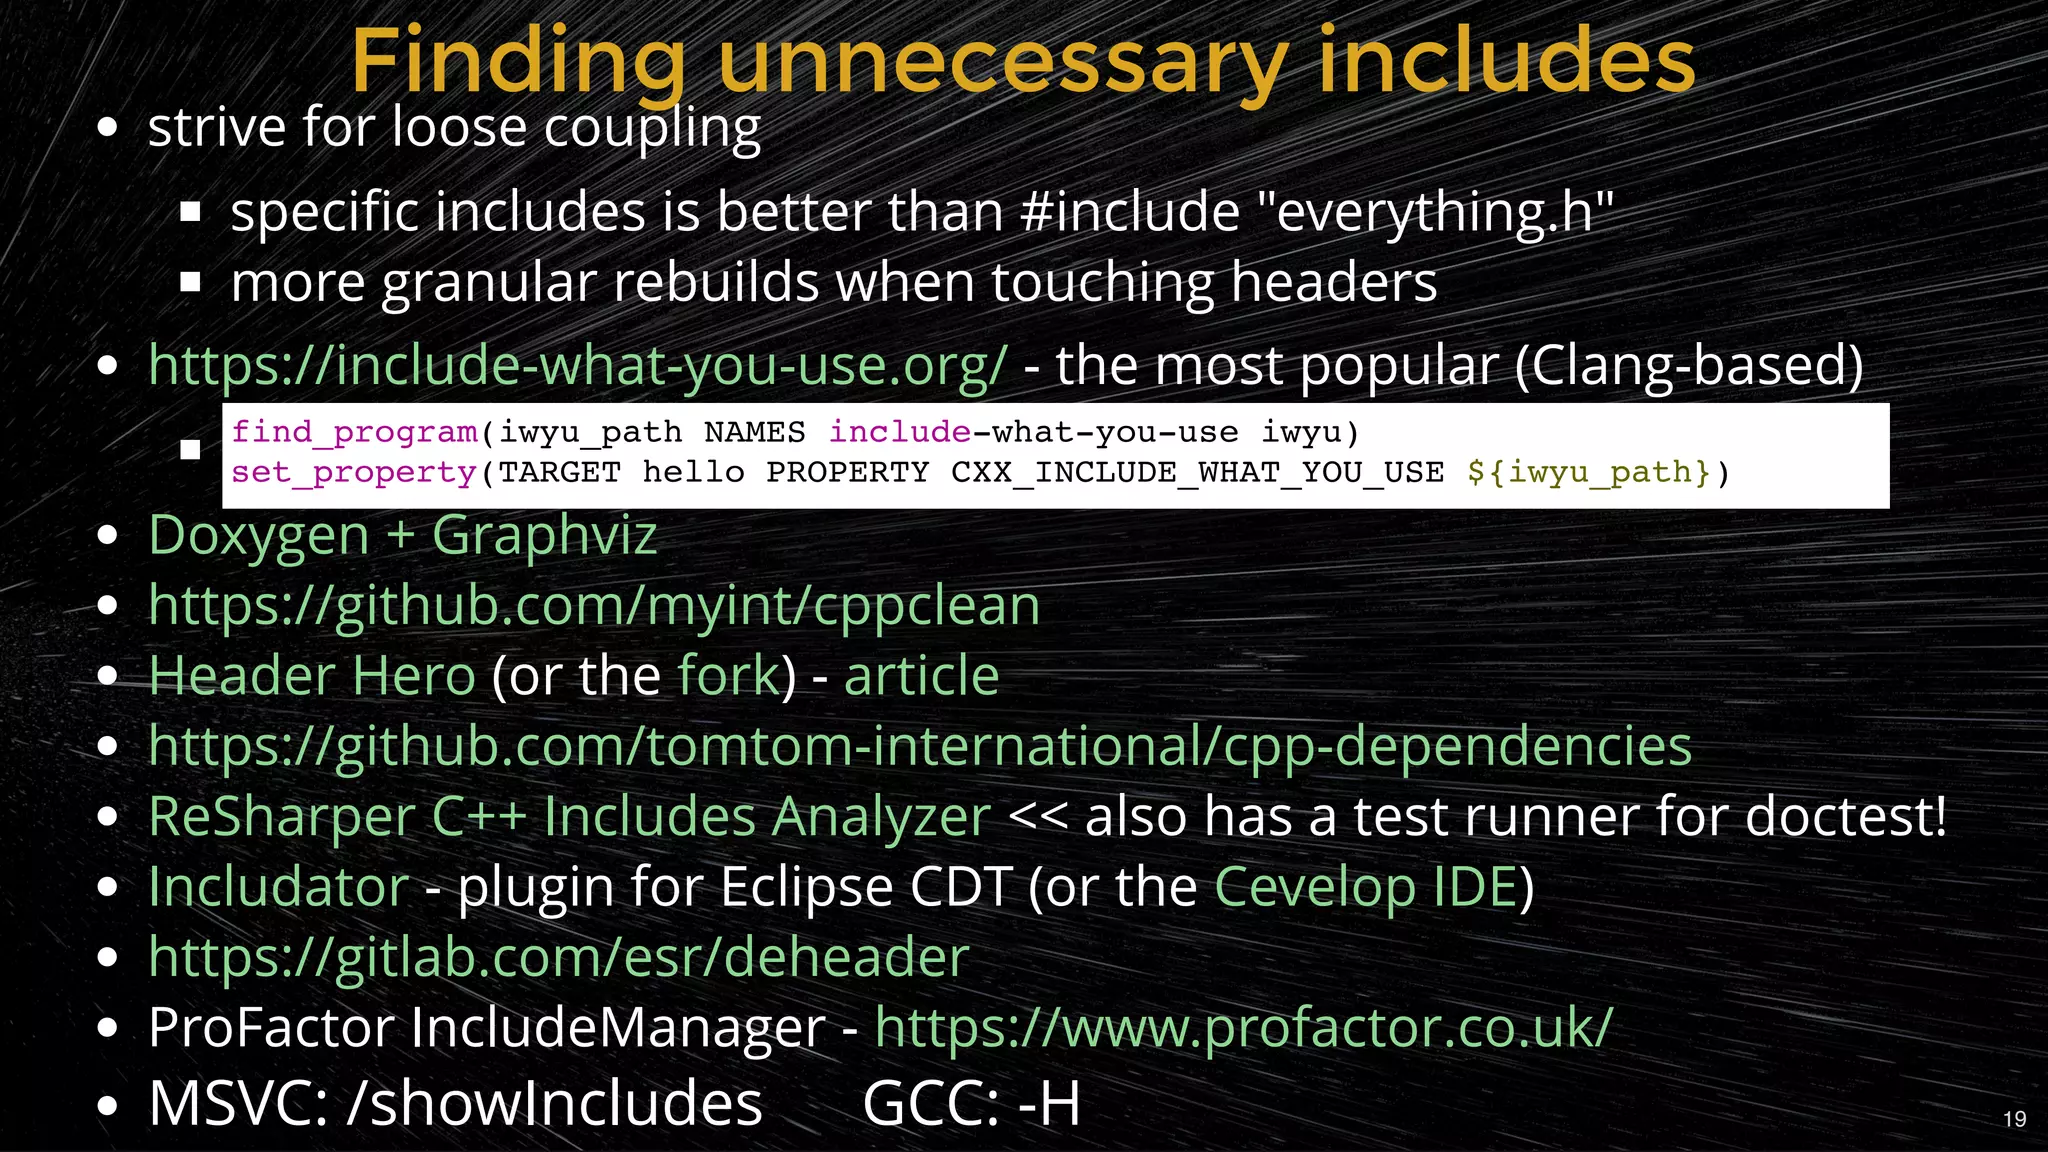
Importance of removing dead code, managing includes smartly, and optimizing builds.
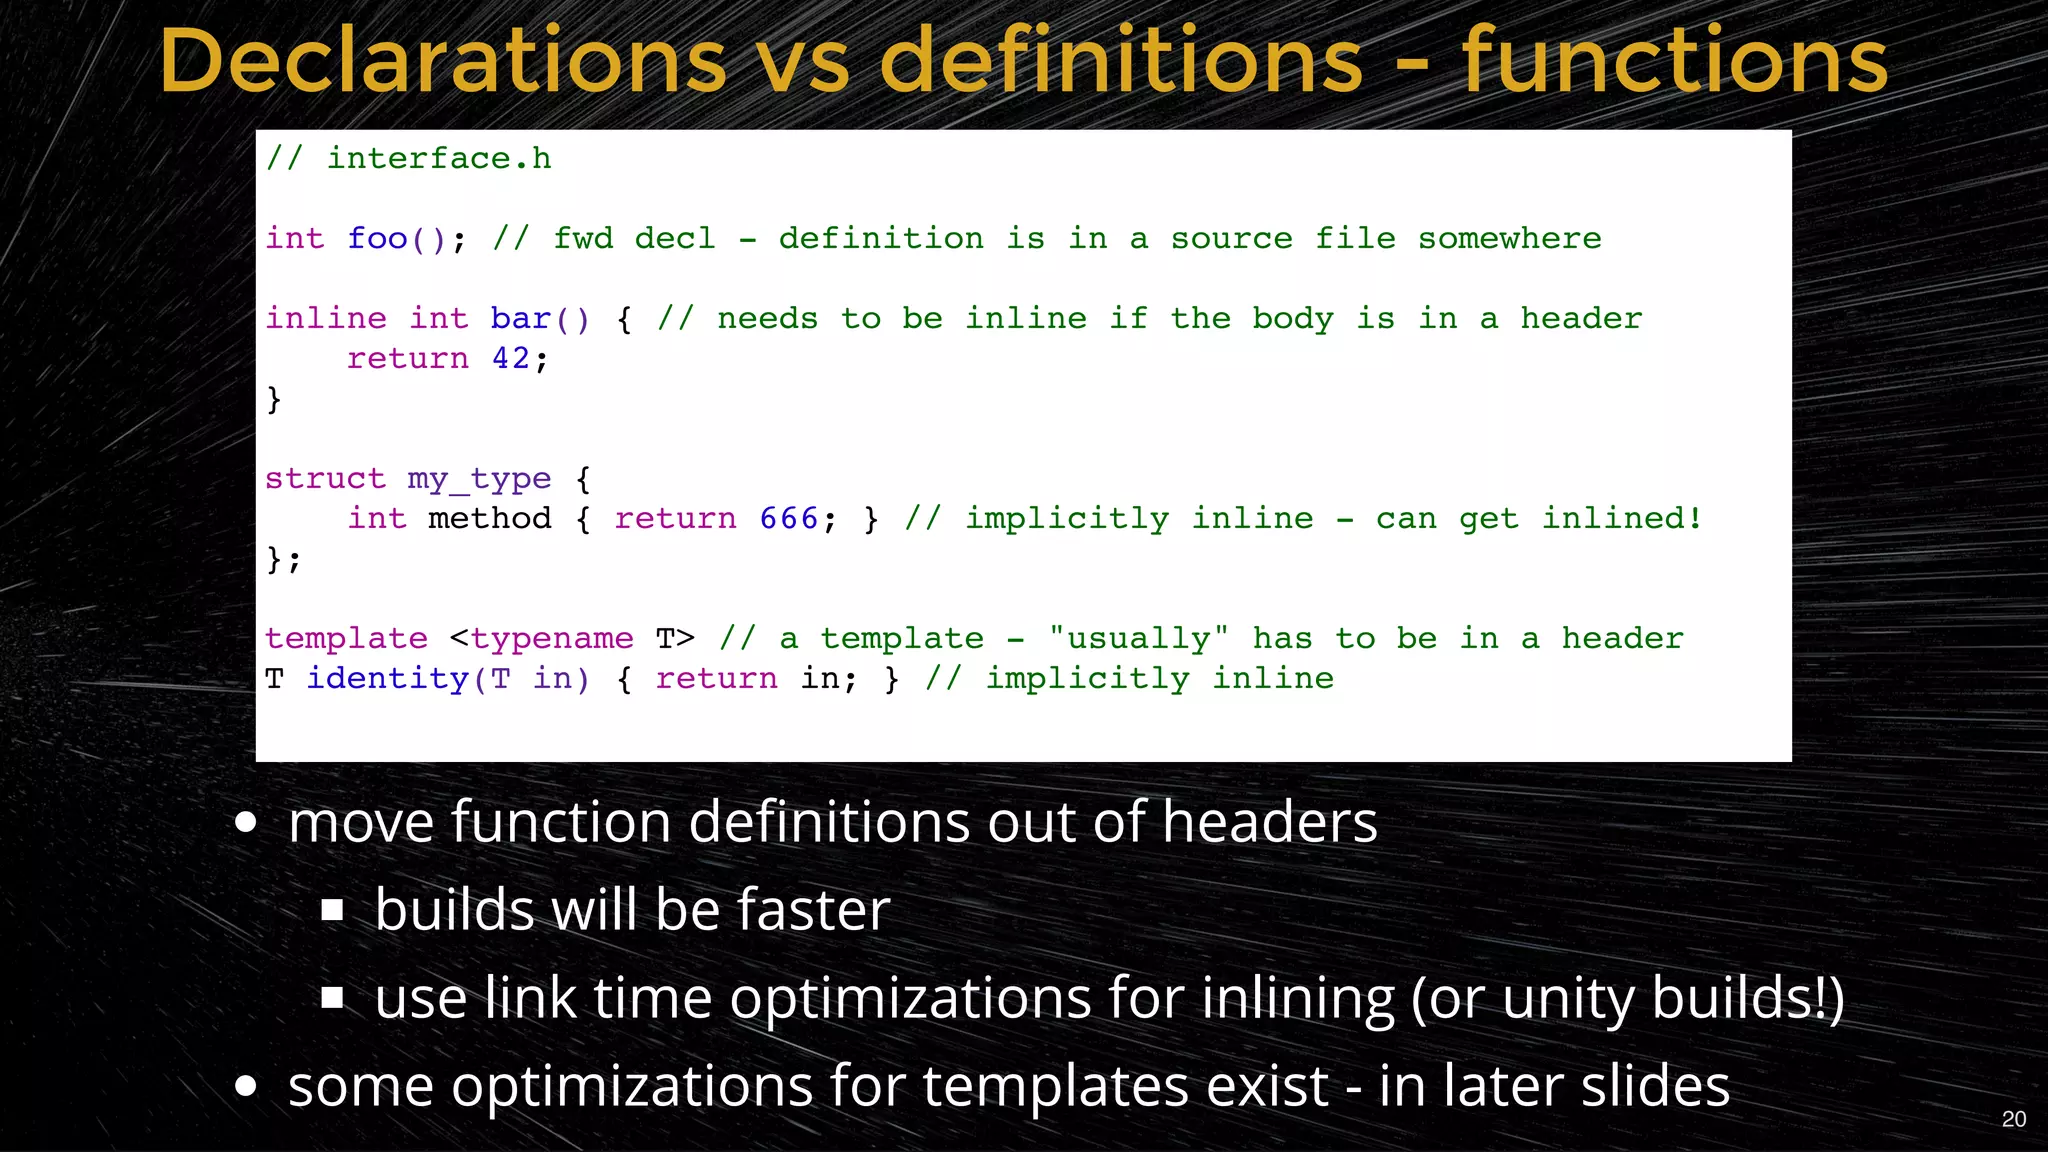
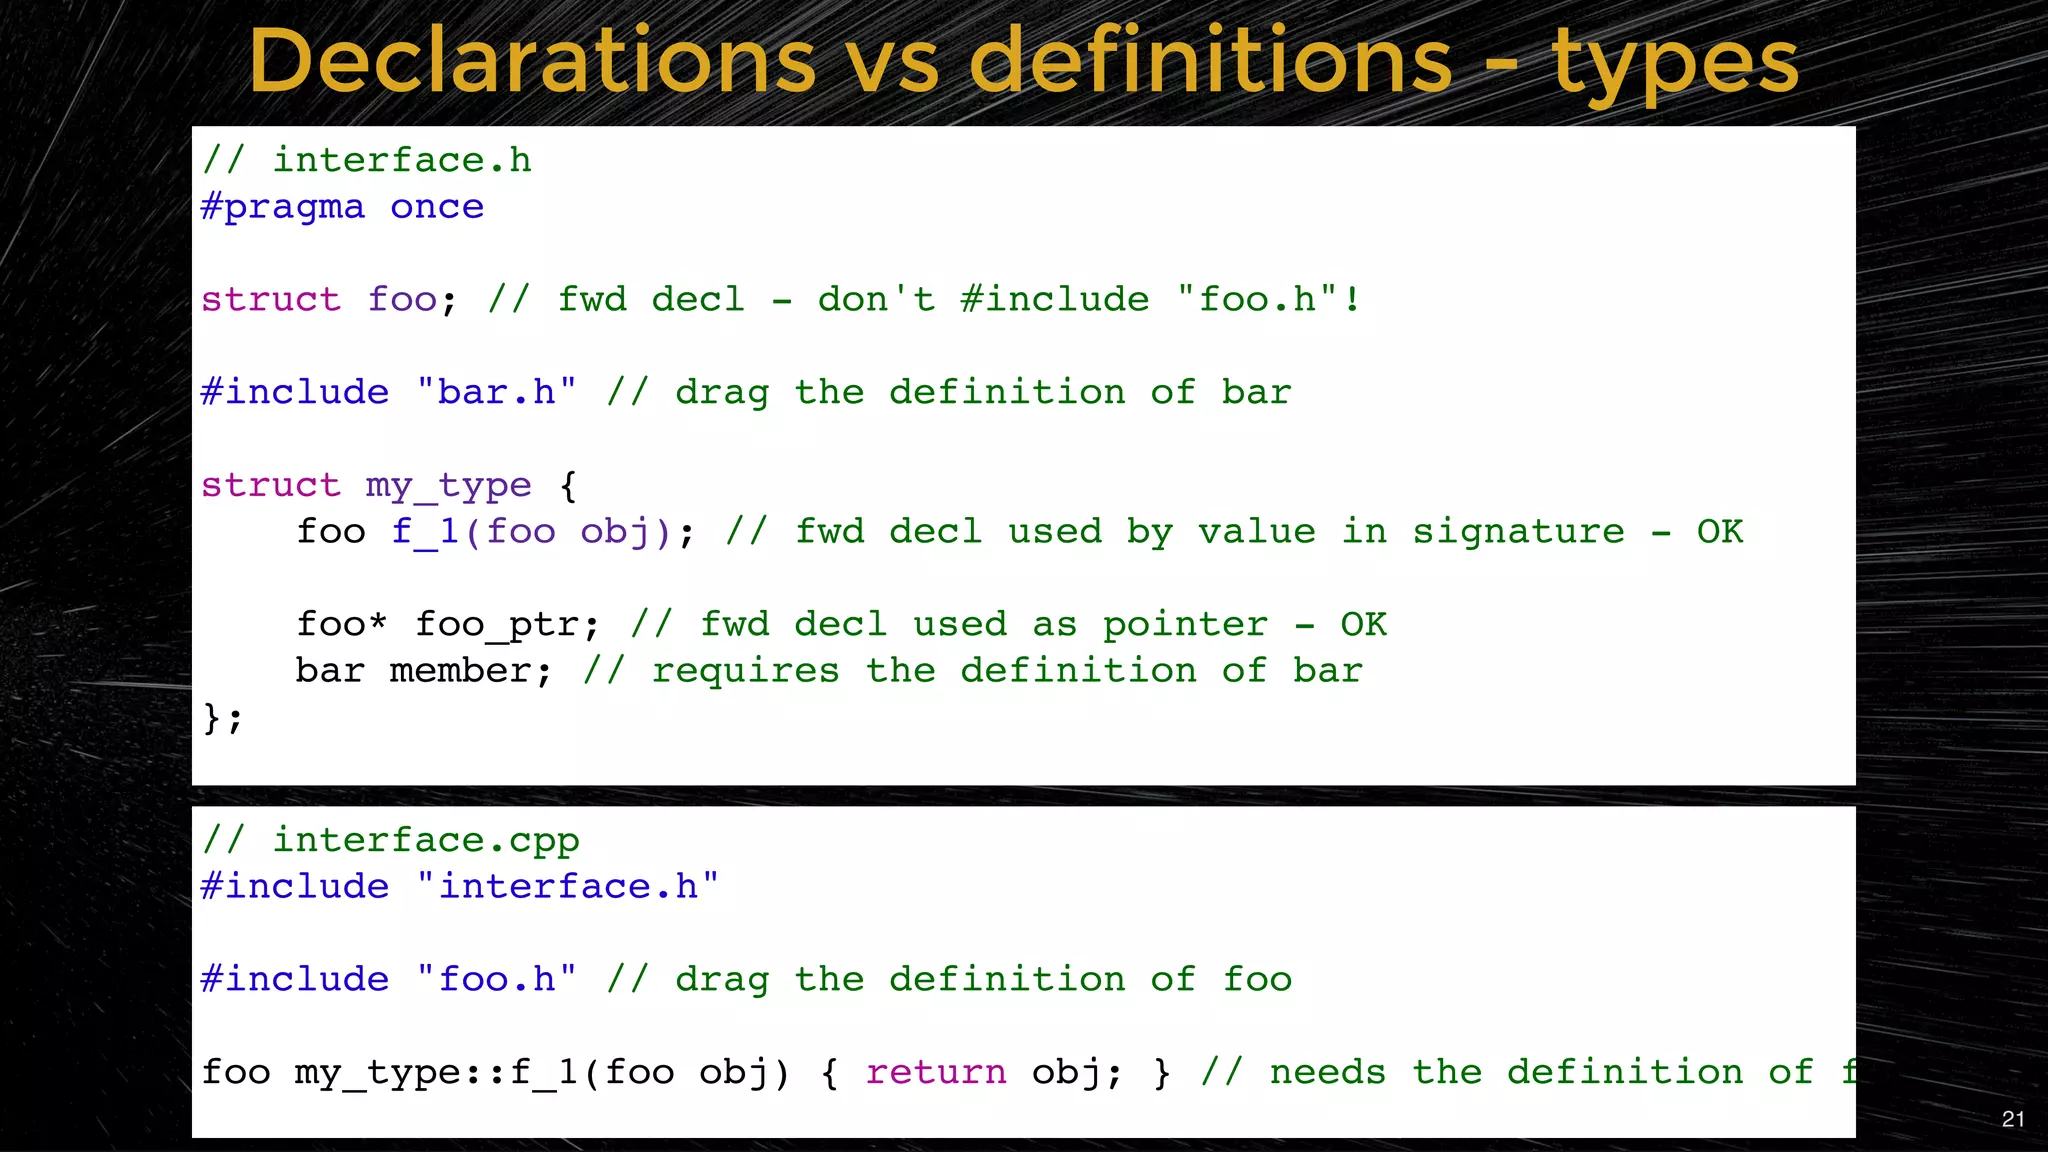
Explanation of the differences between declarations and definitions, focusing on optimization strategies.
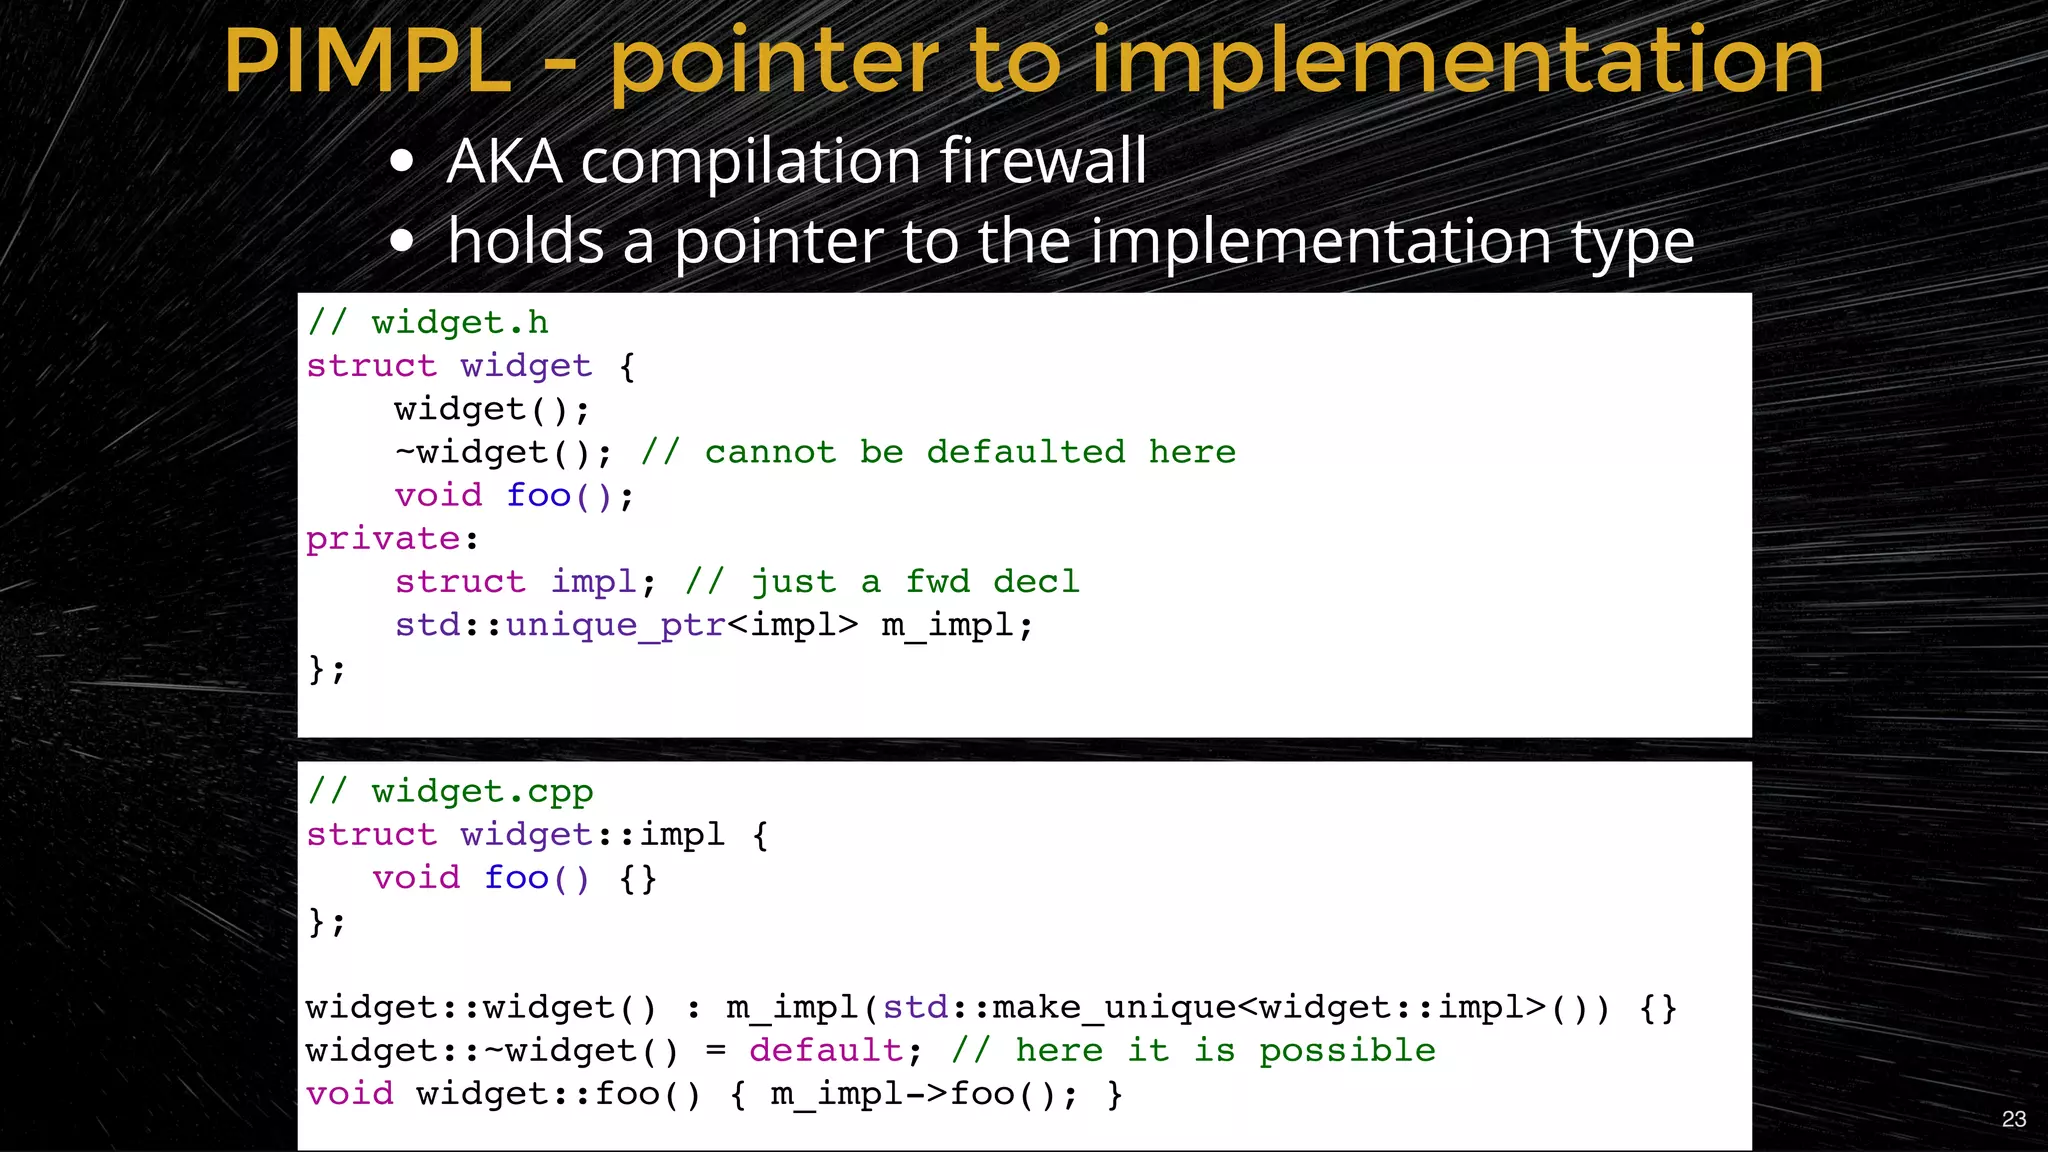
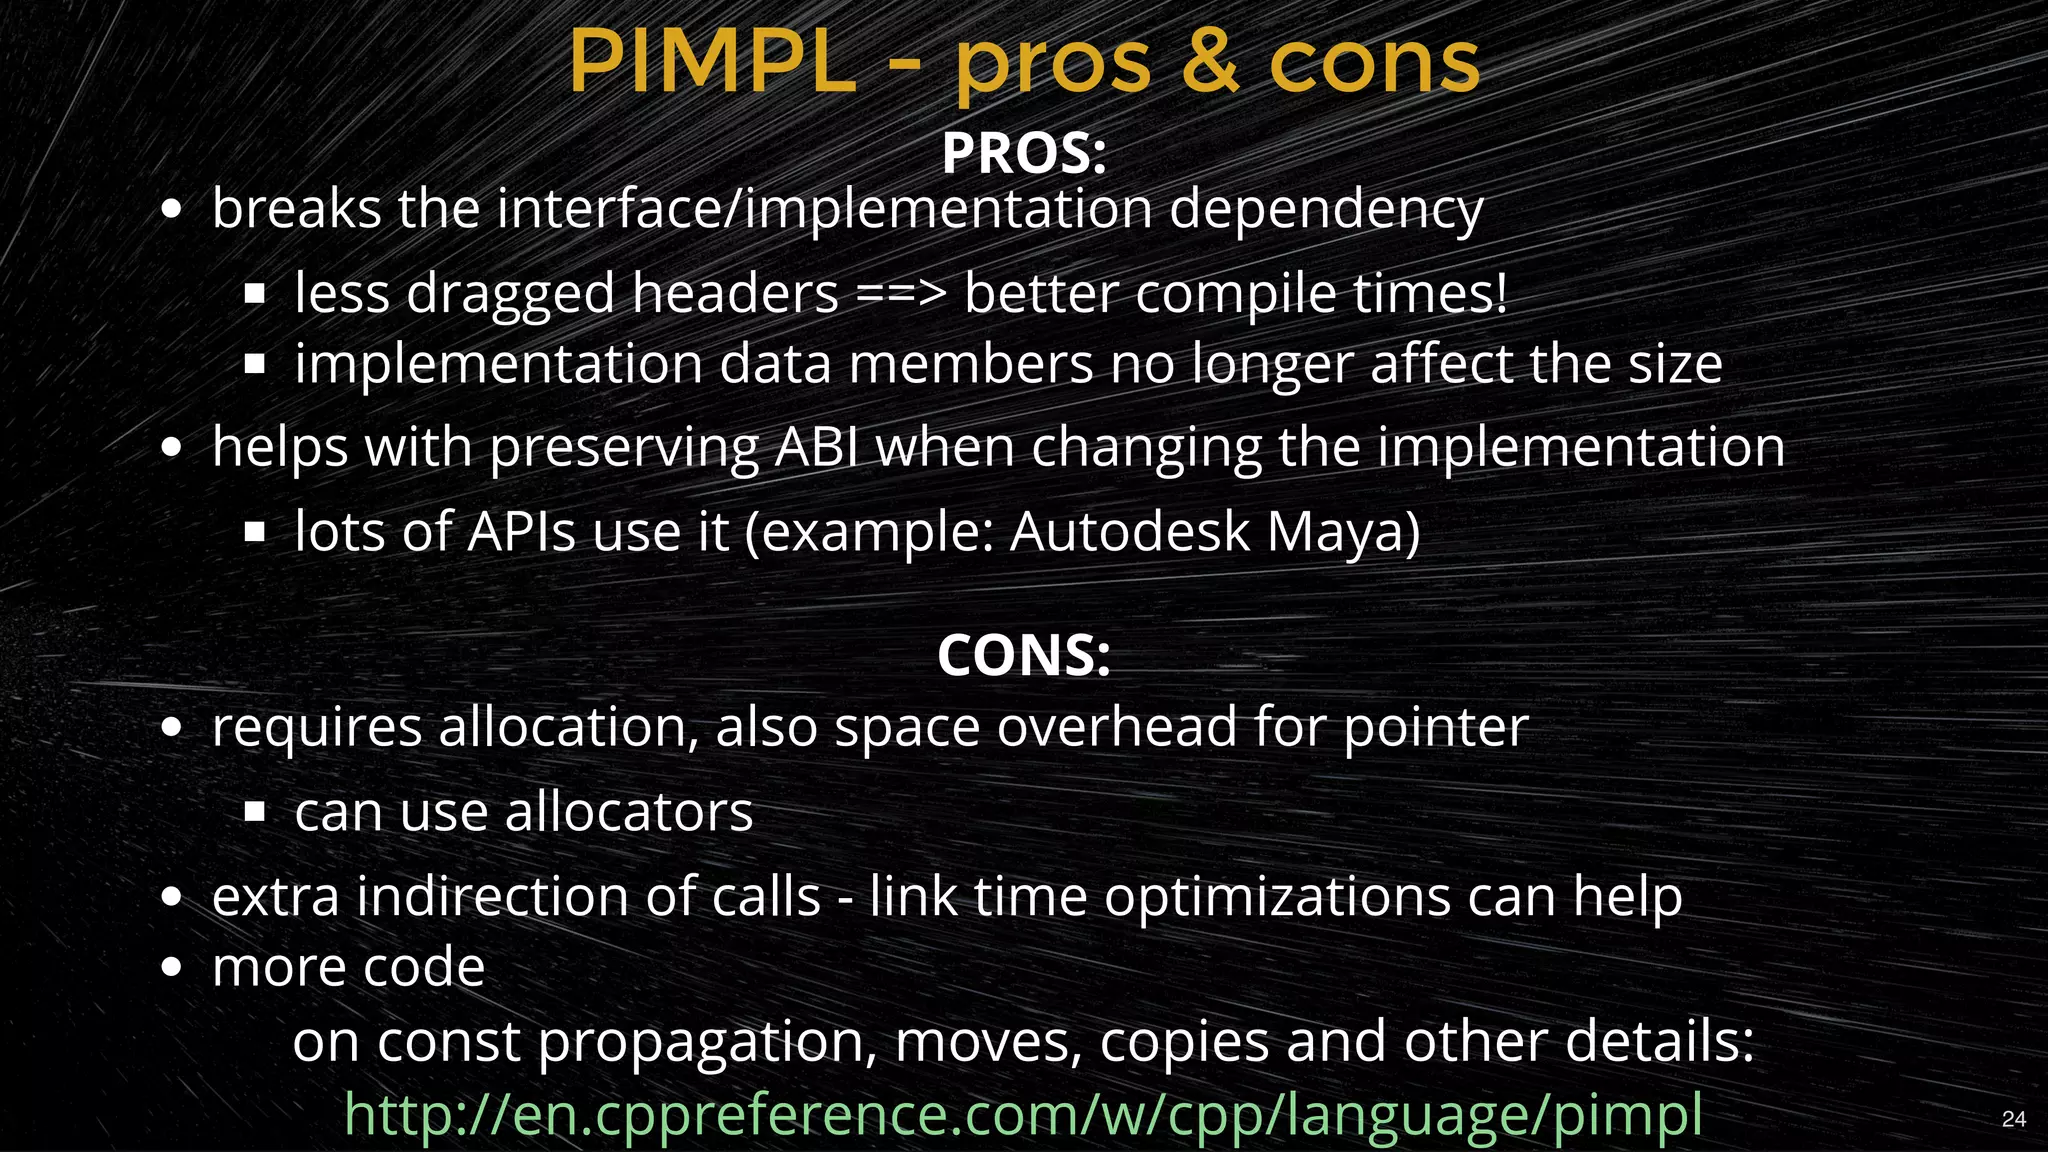
The Pointer to Implementation (PIMPL) pattern advantages and disadvantages for reducing compile times.
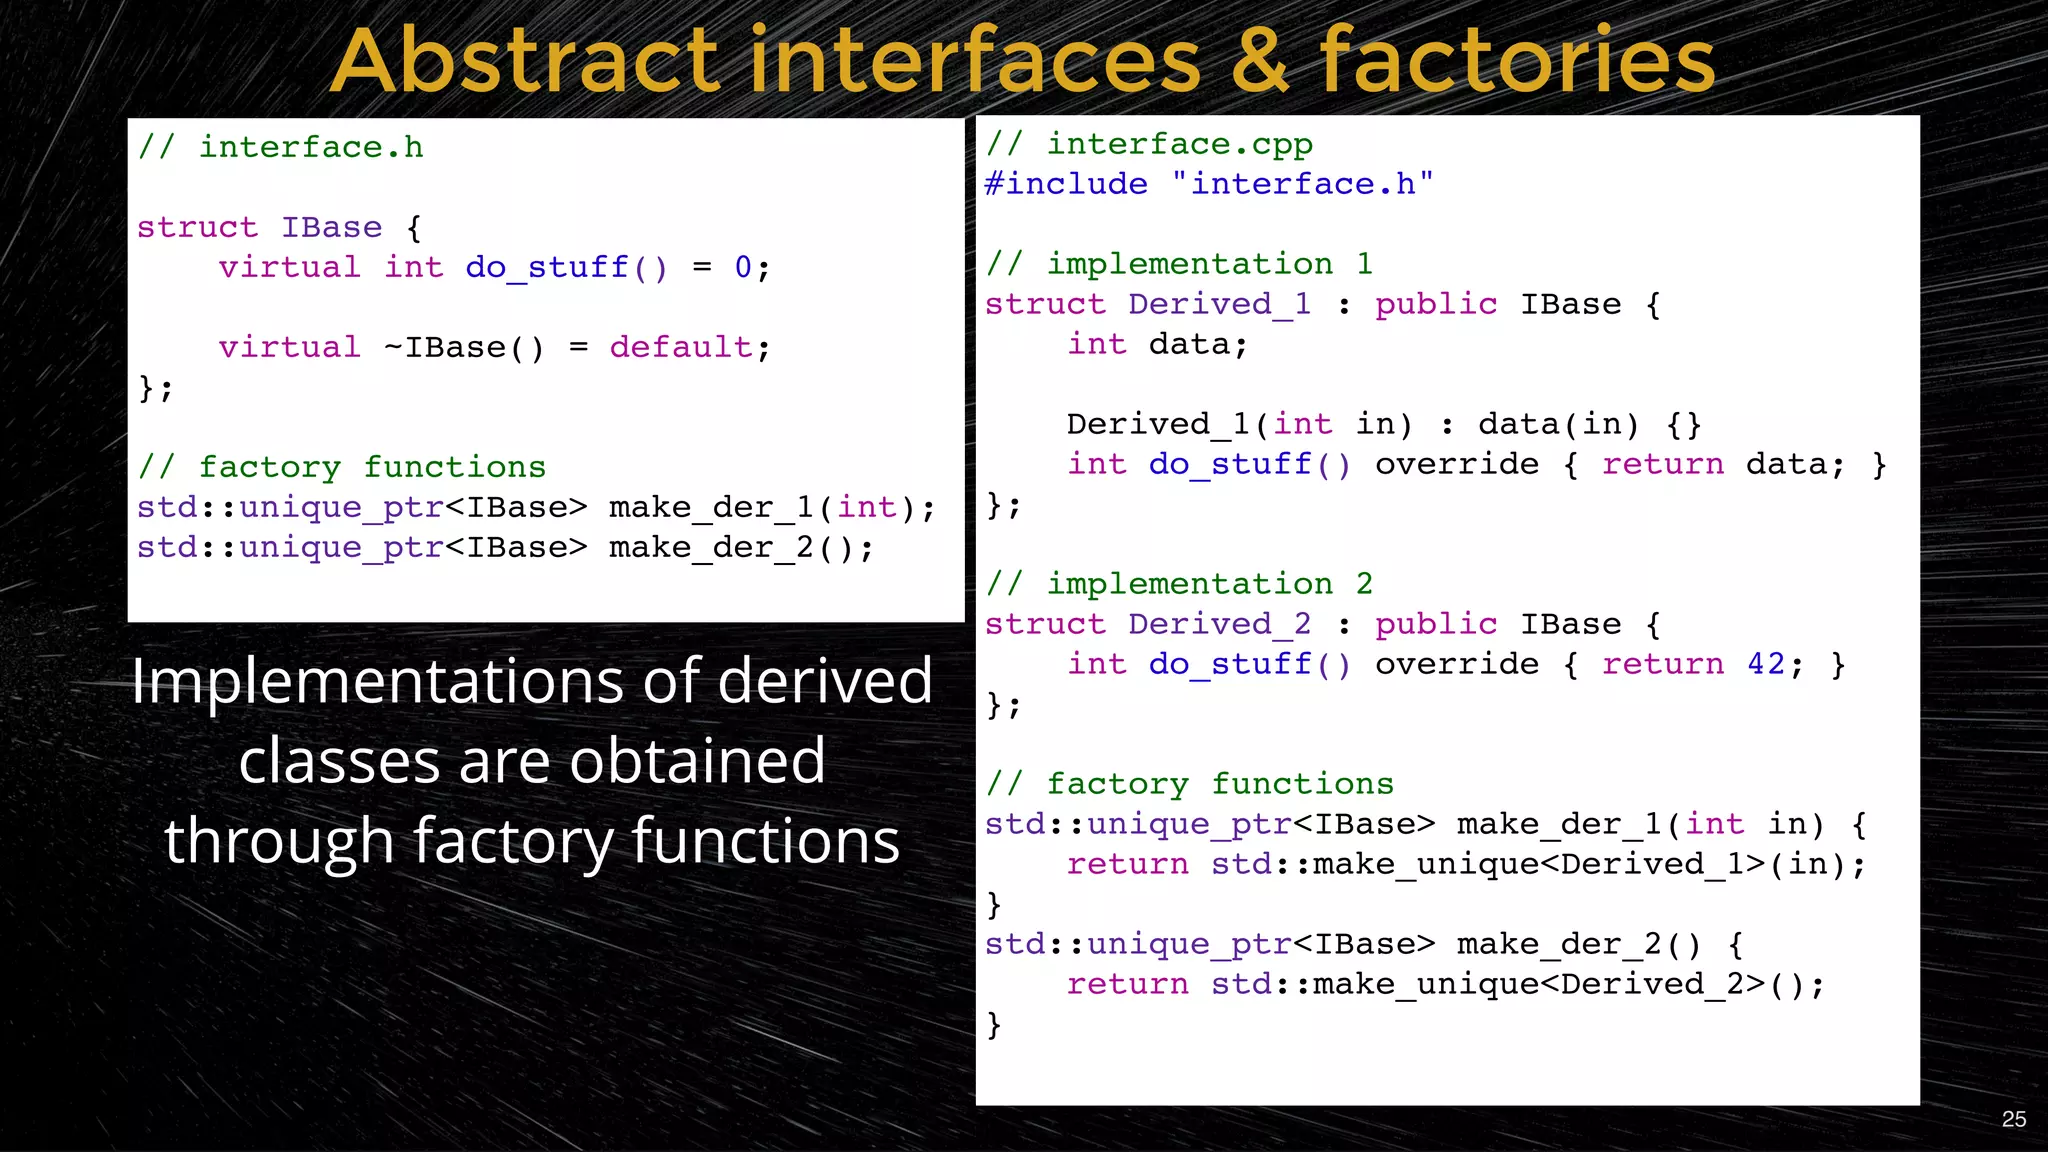
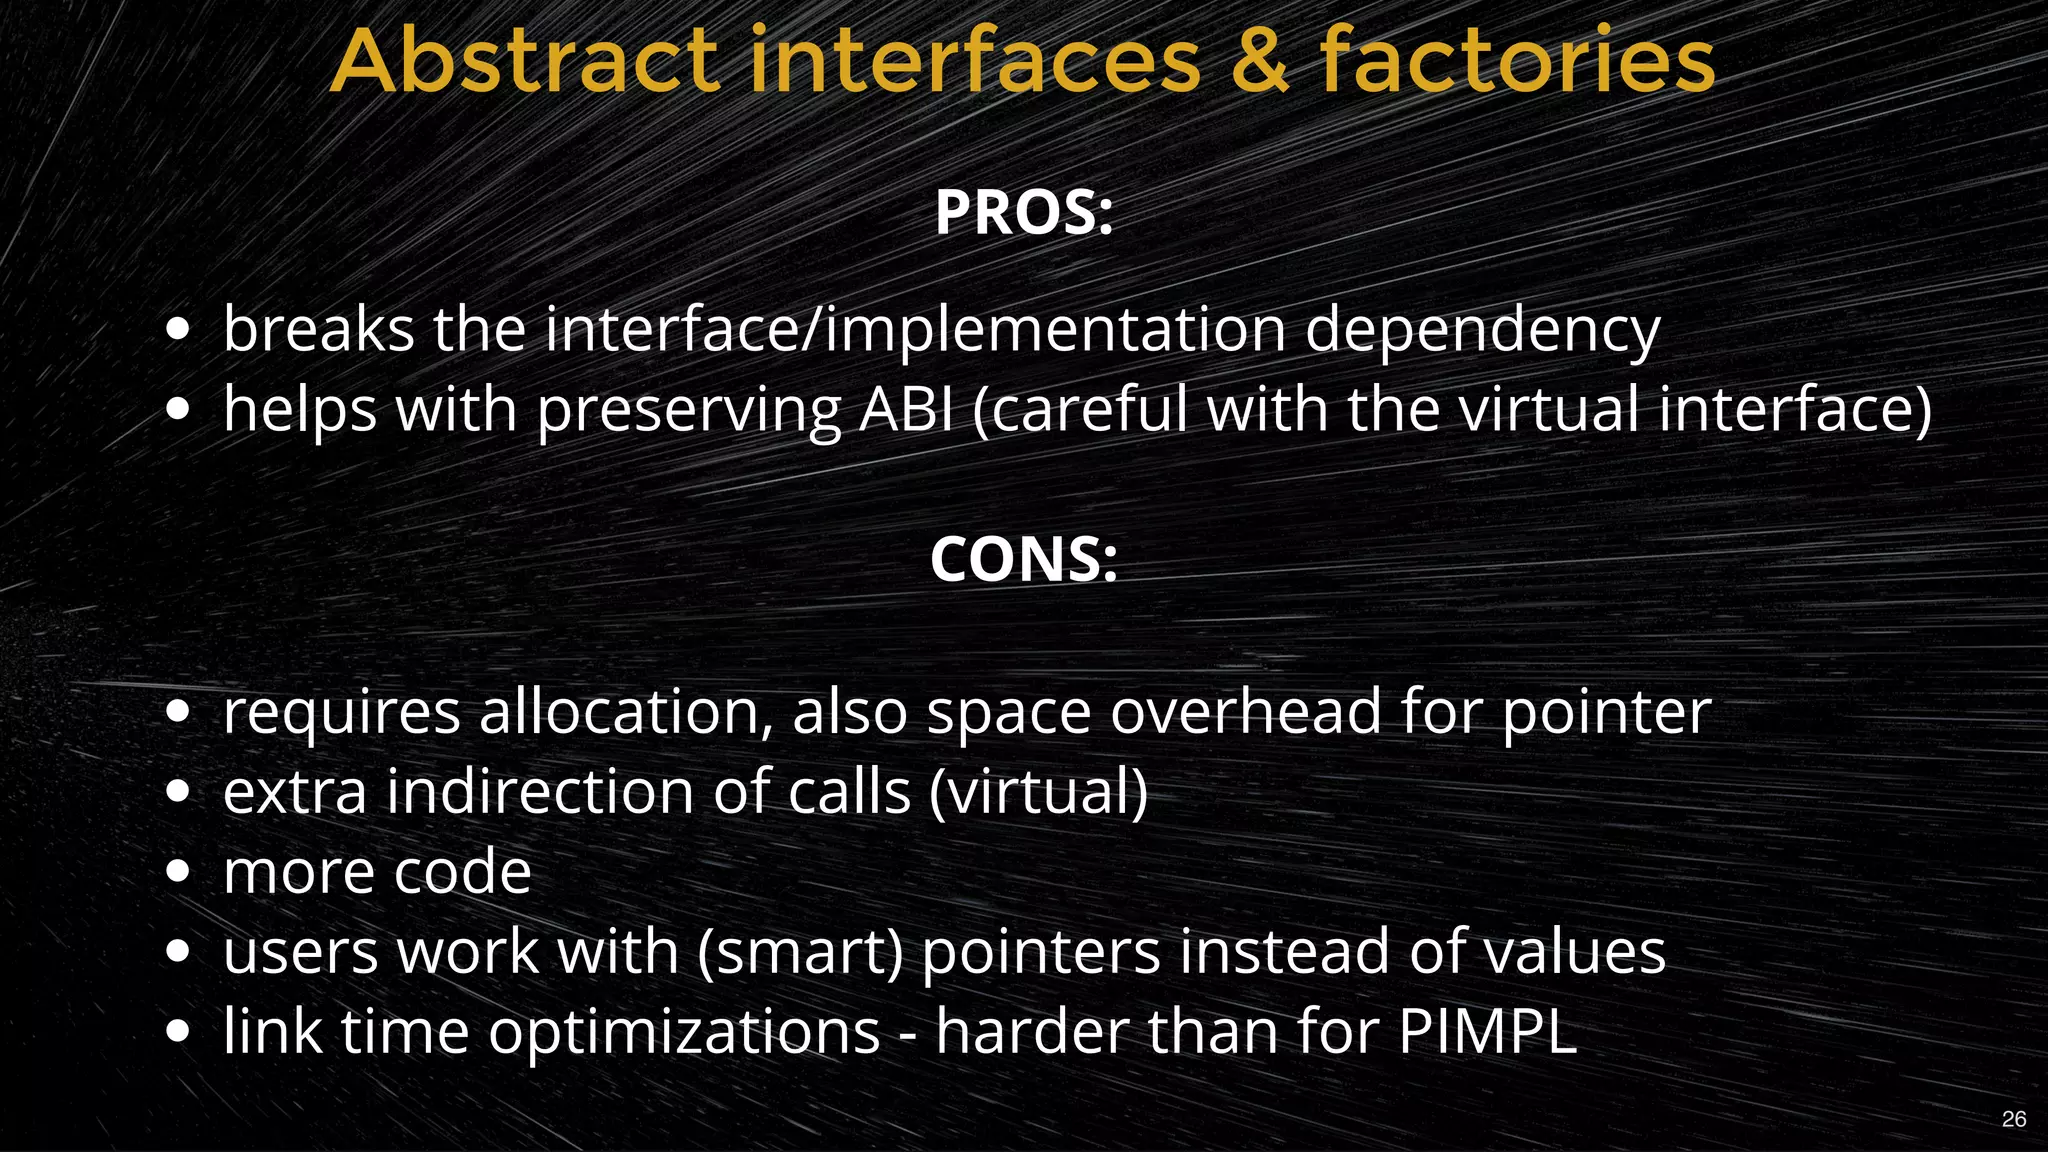
Illustration of abstract interfaces and factory patterns for better design and ABI stability.
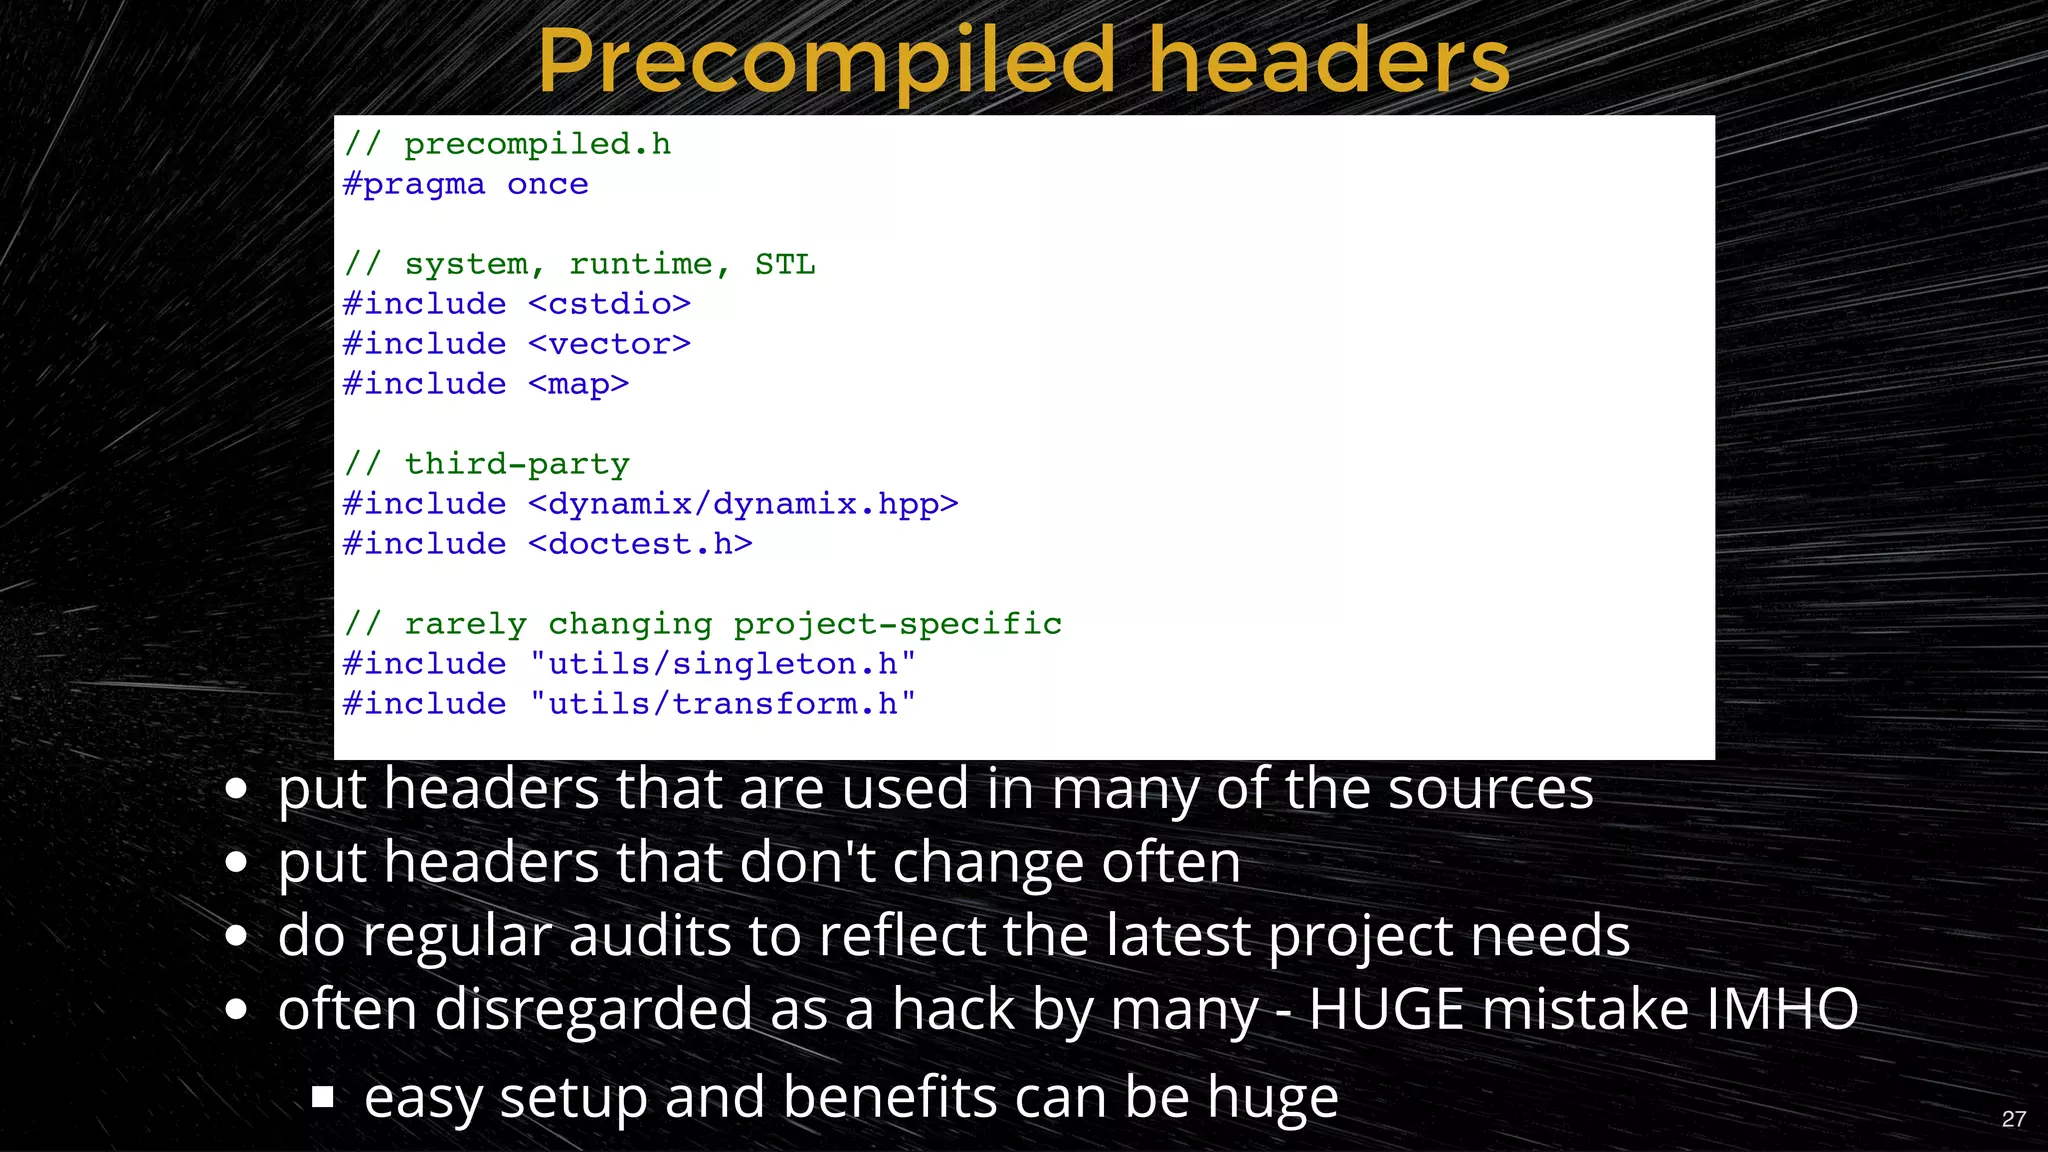
Benefits of precompiled headers to reduce compile times by auditing and using rarely changed files.
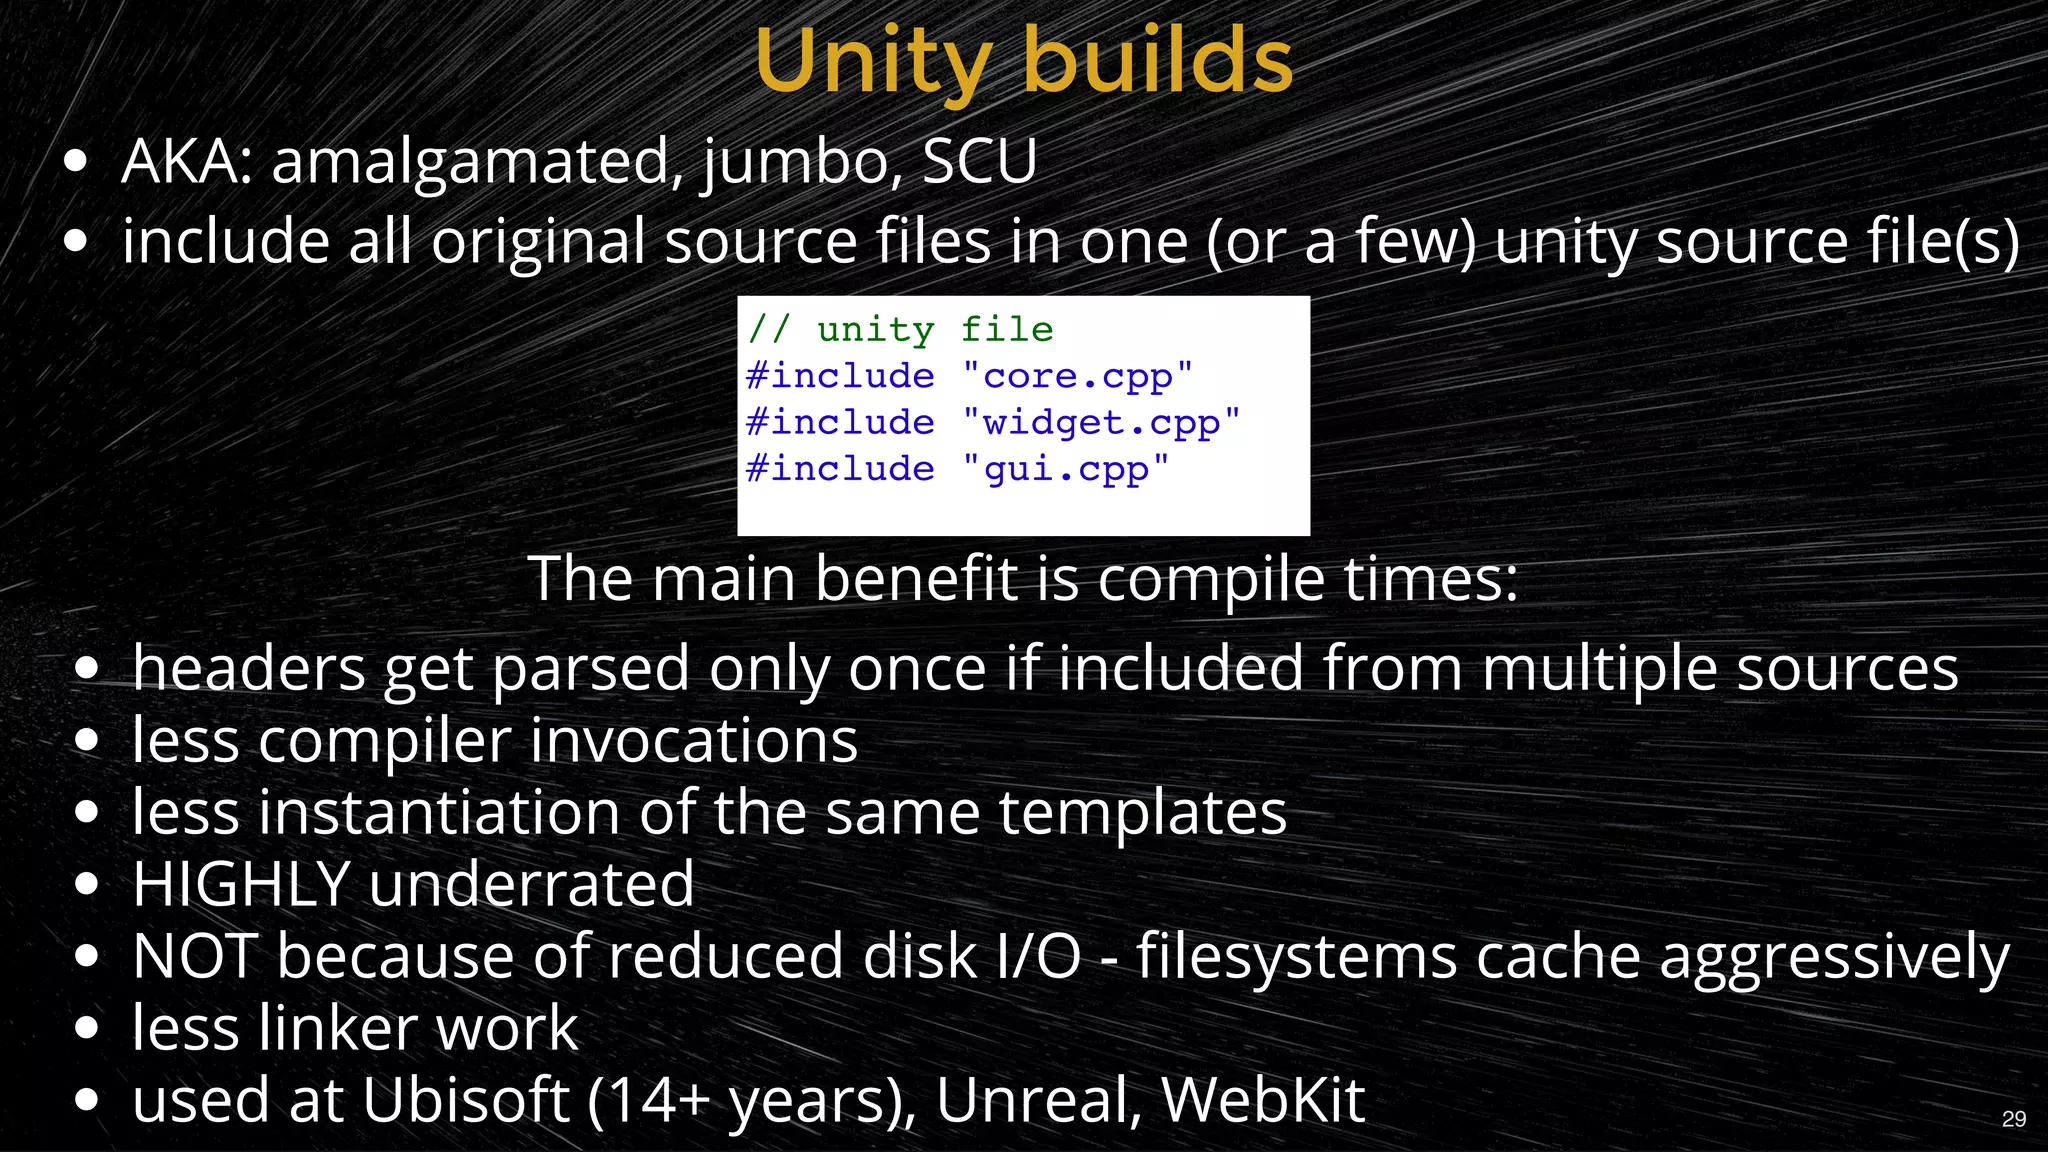
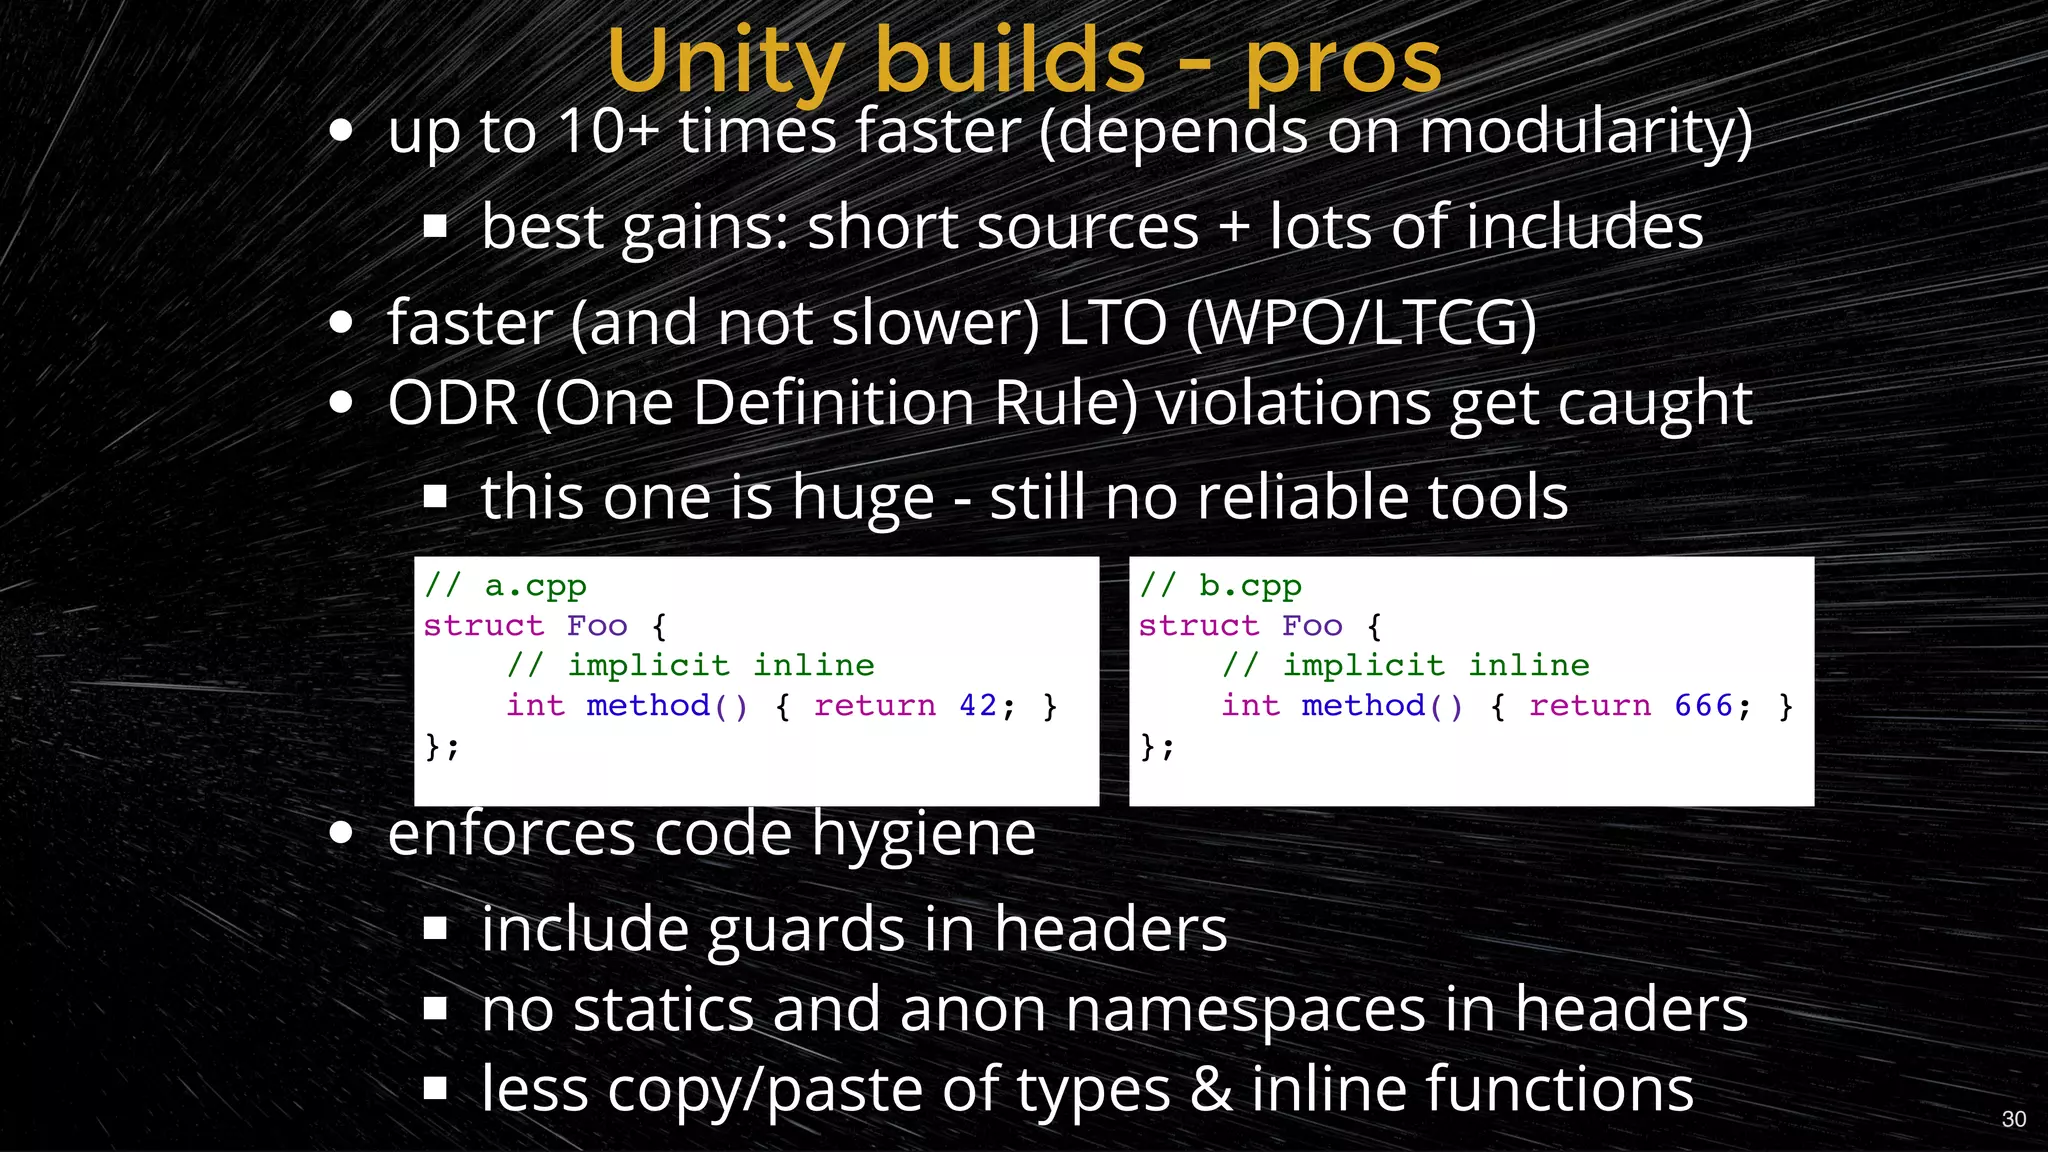
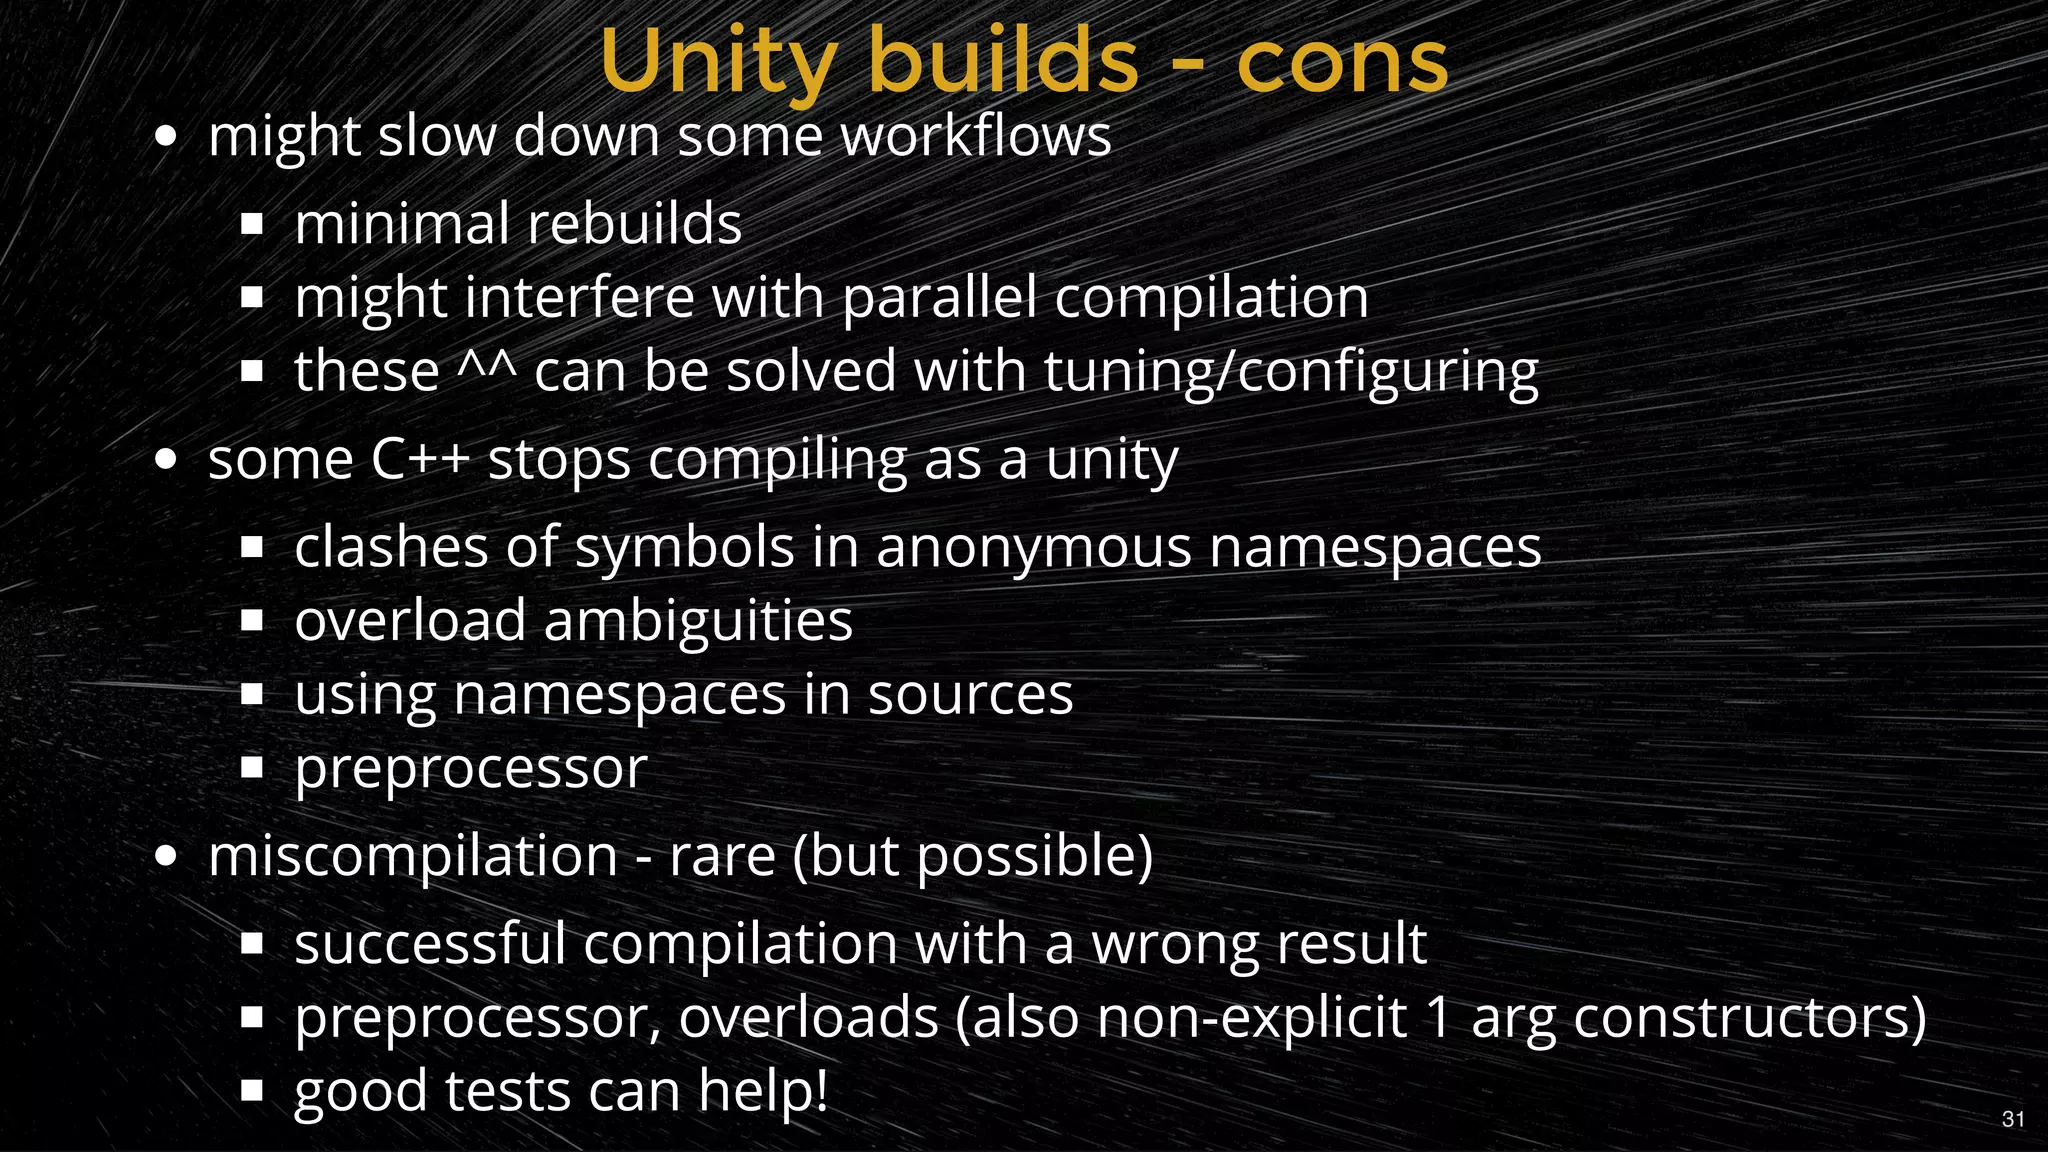
Explains unity builds, their advantages for compile times, and potential downsides.
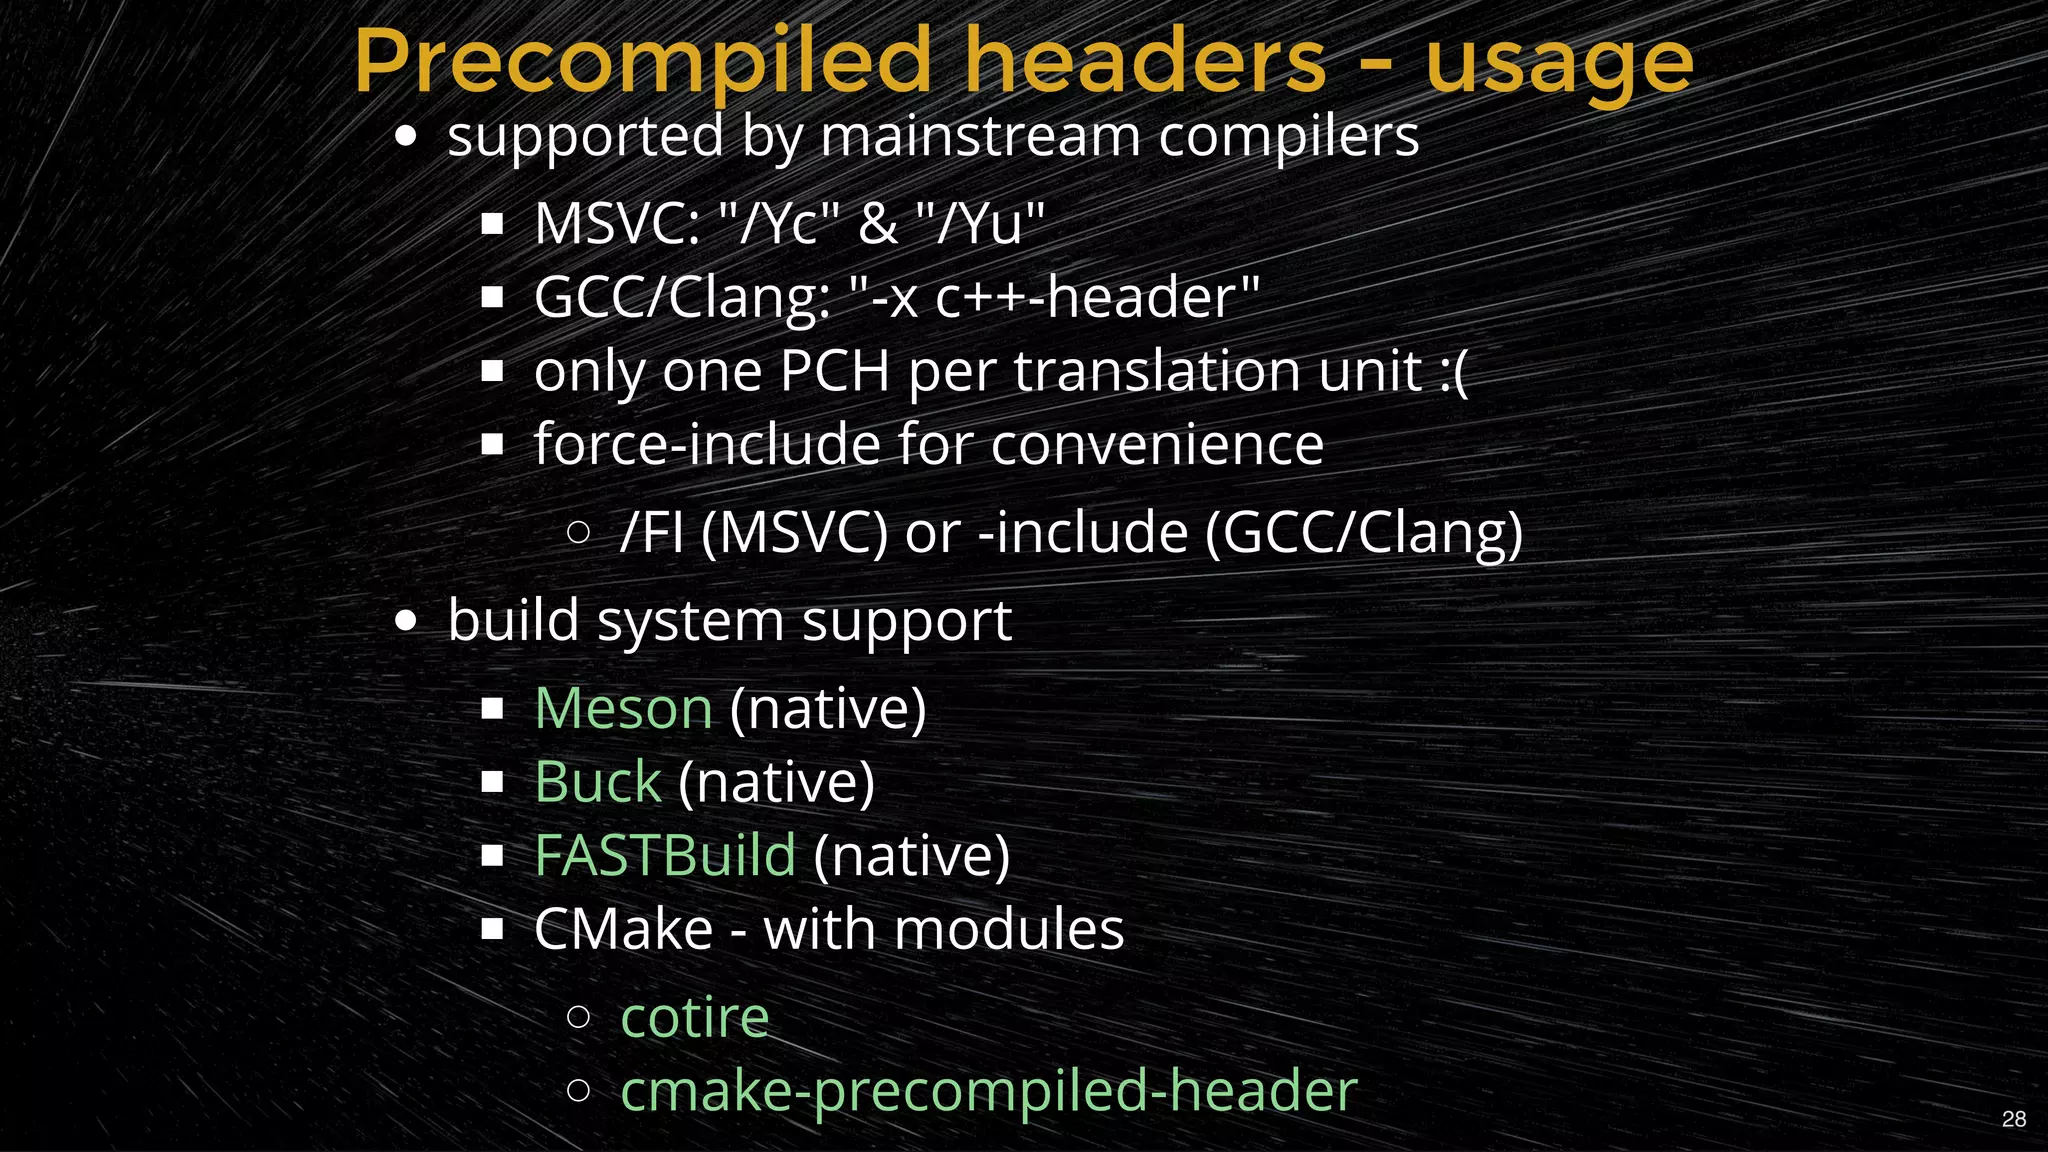
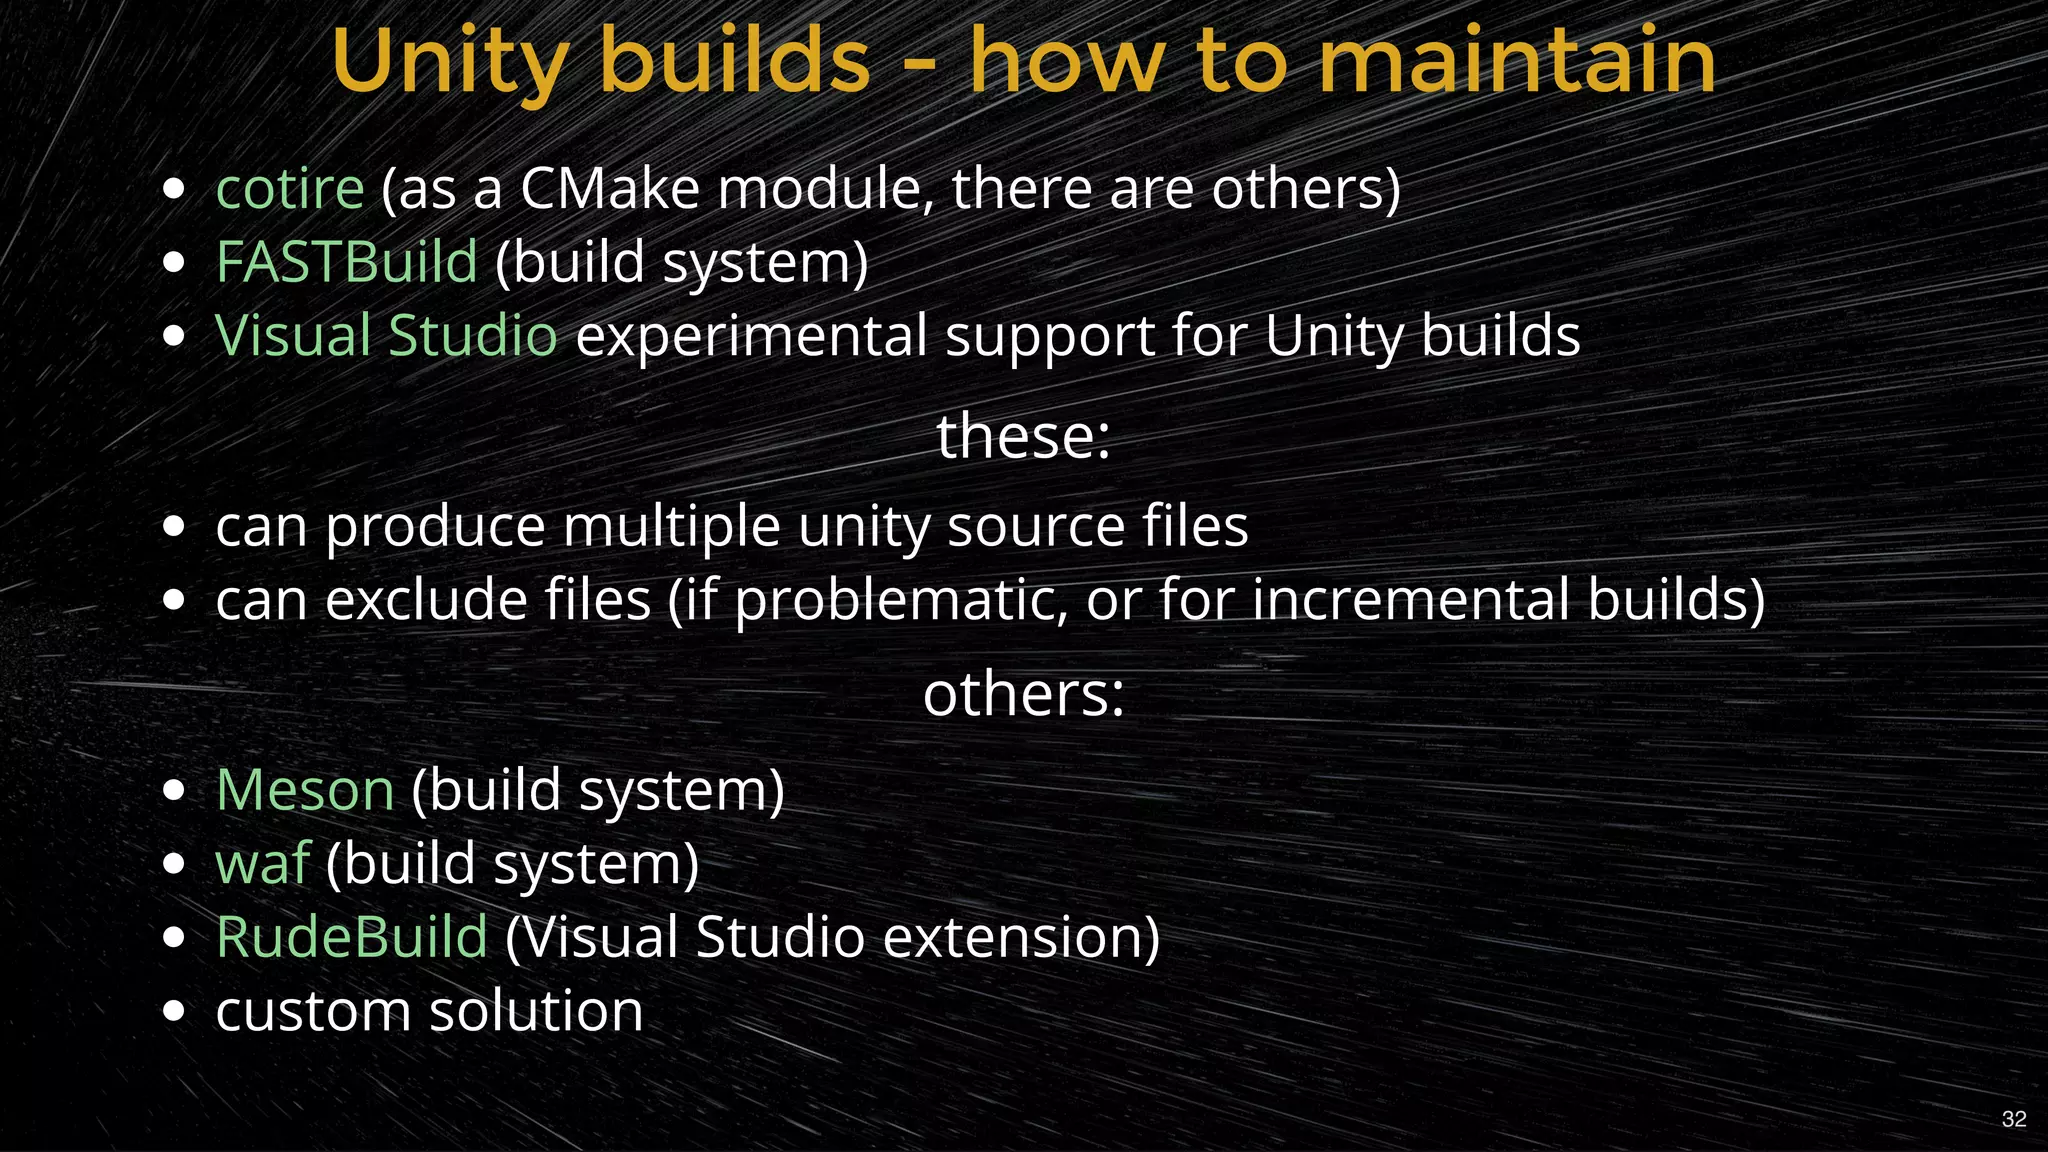
Strategies and tools for managing unity builds effectively in different environments.
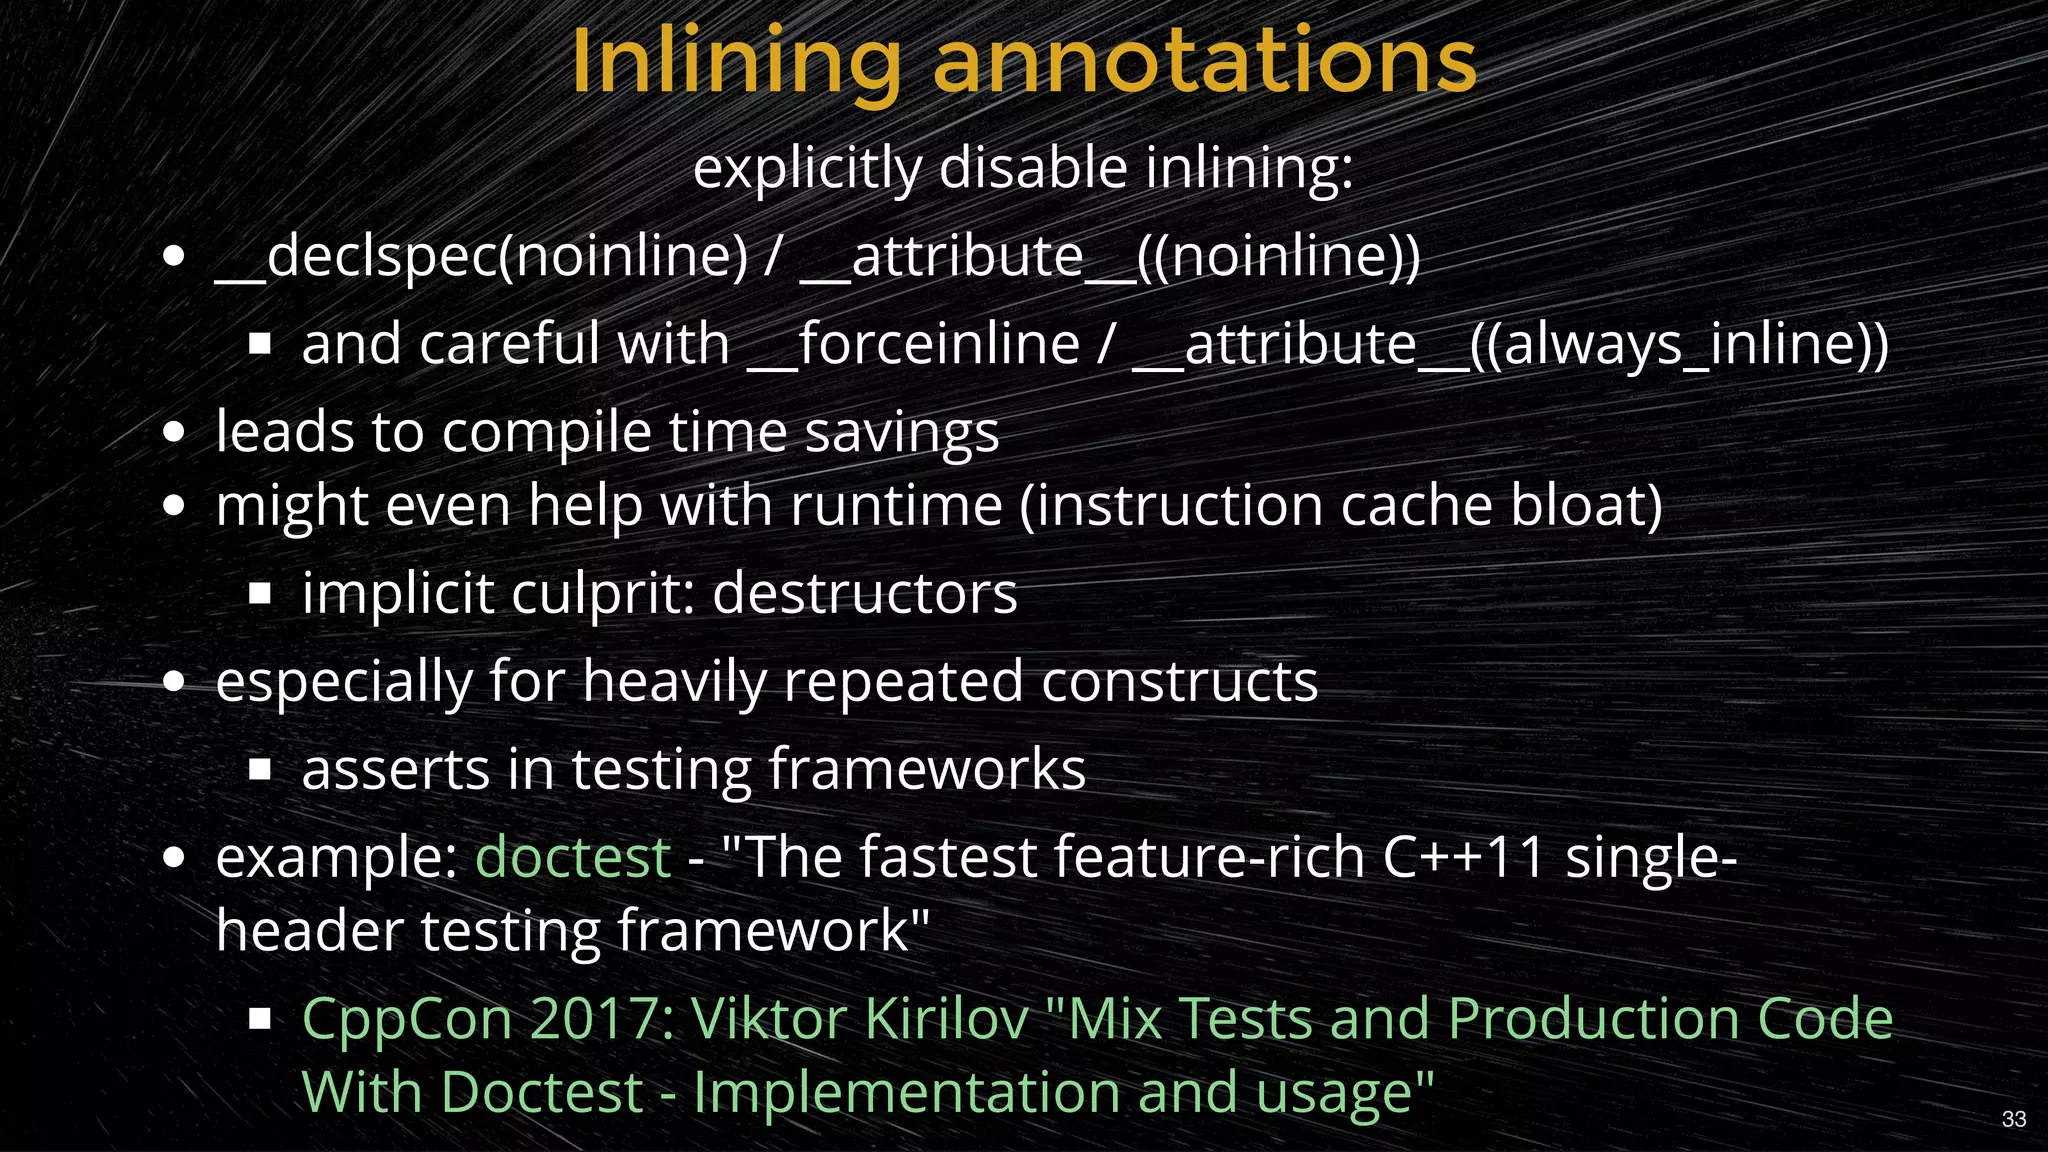
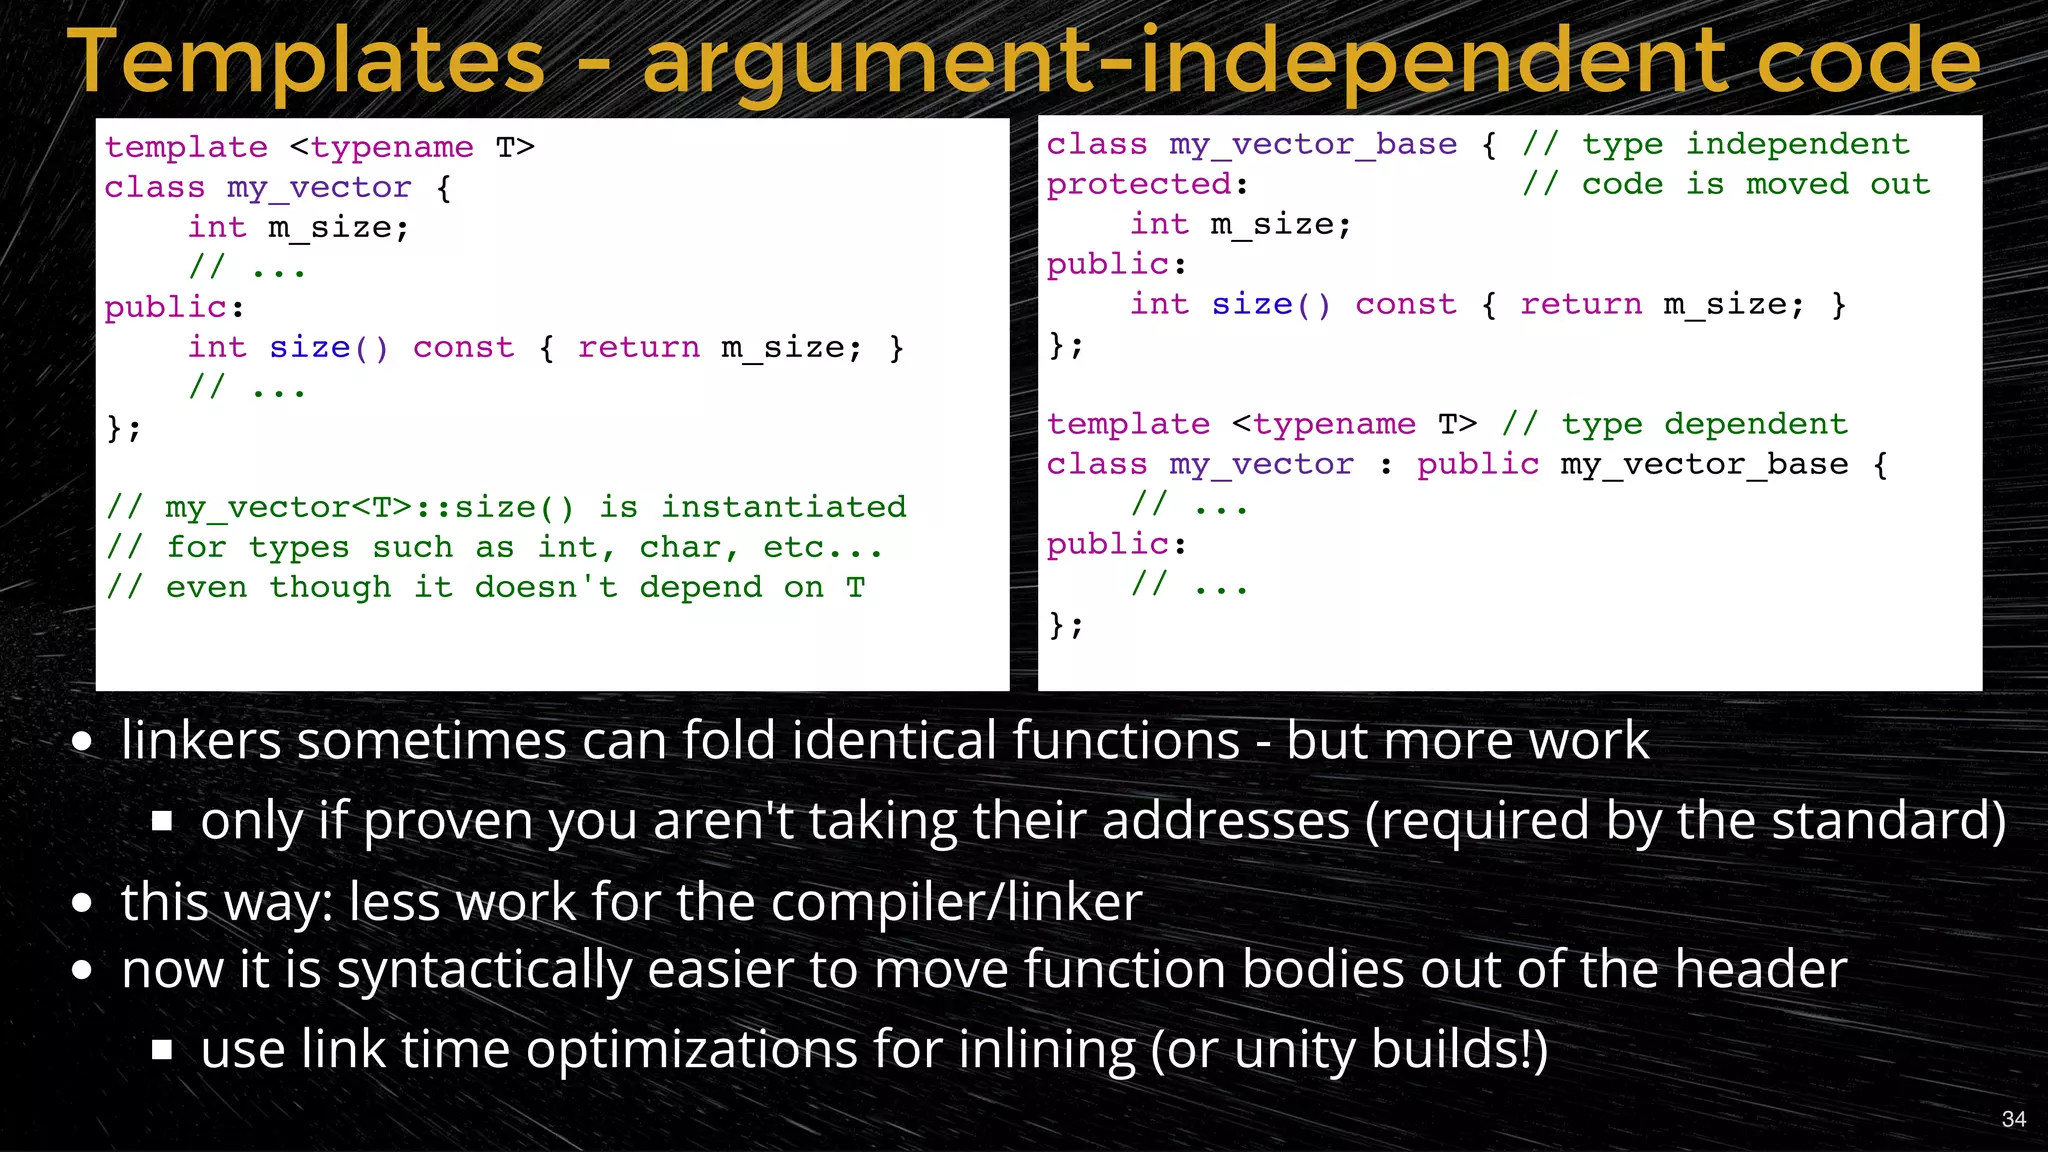
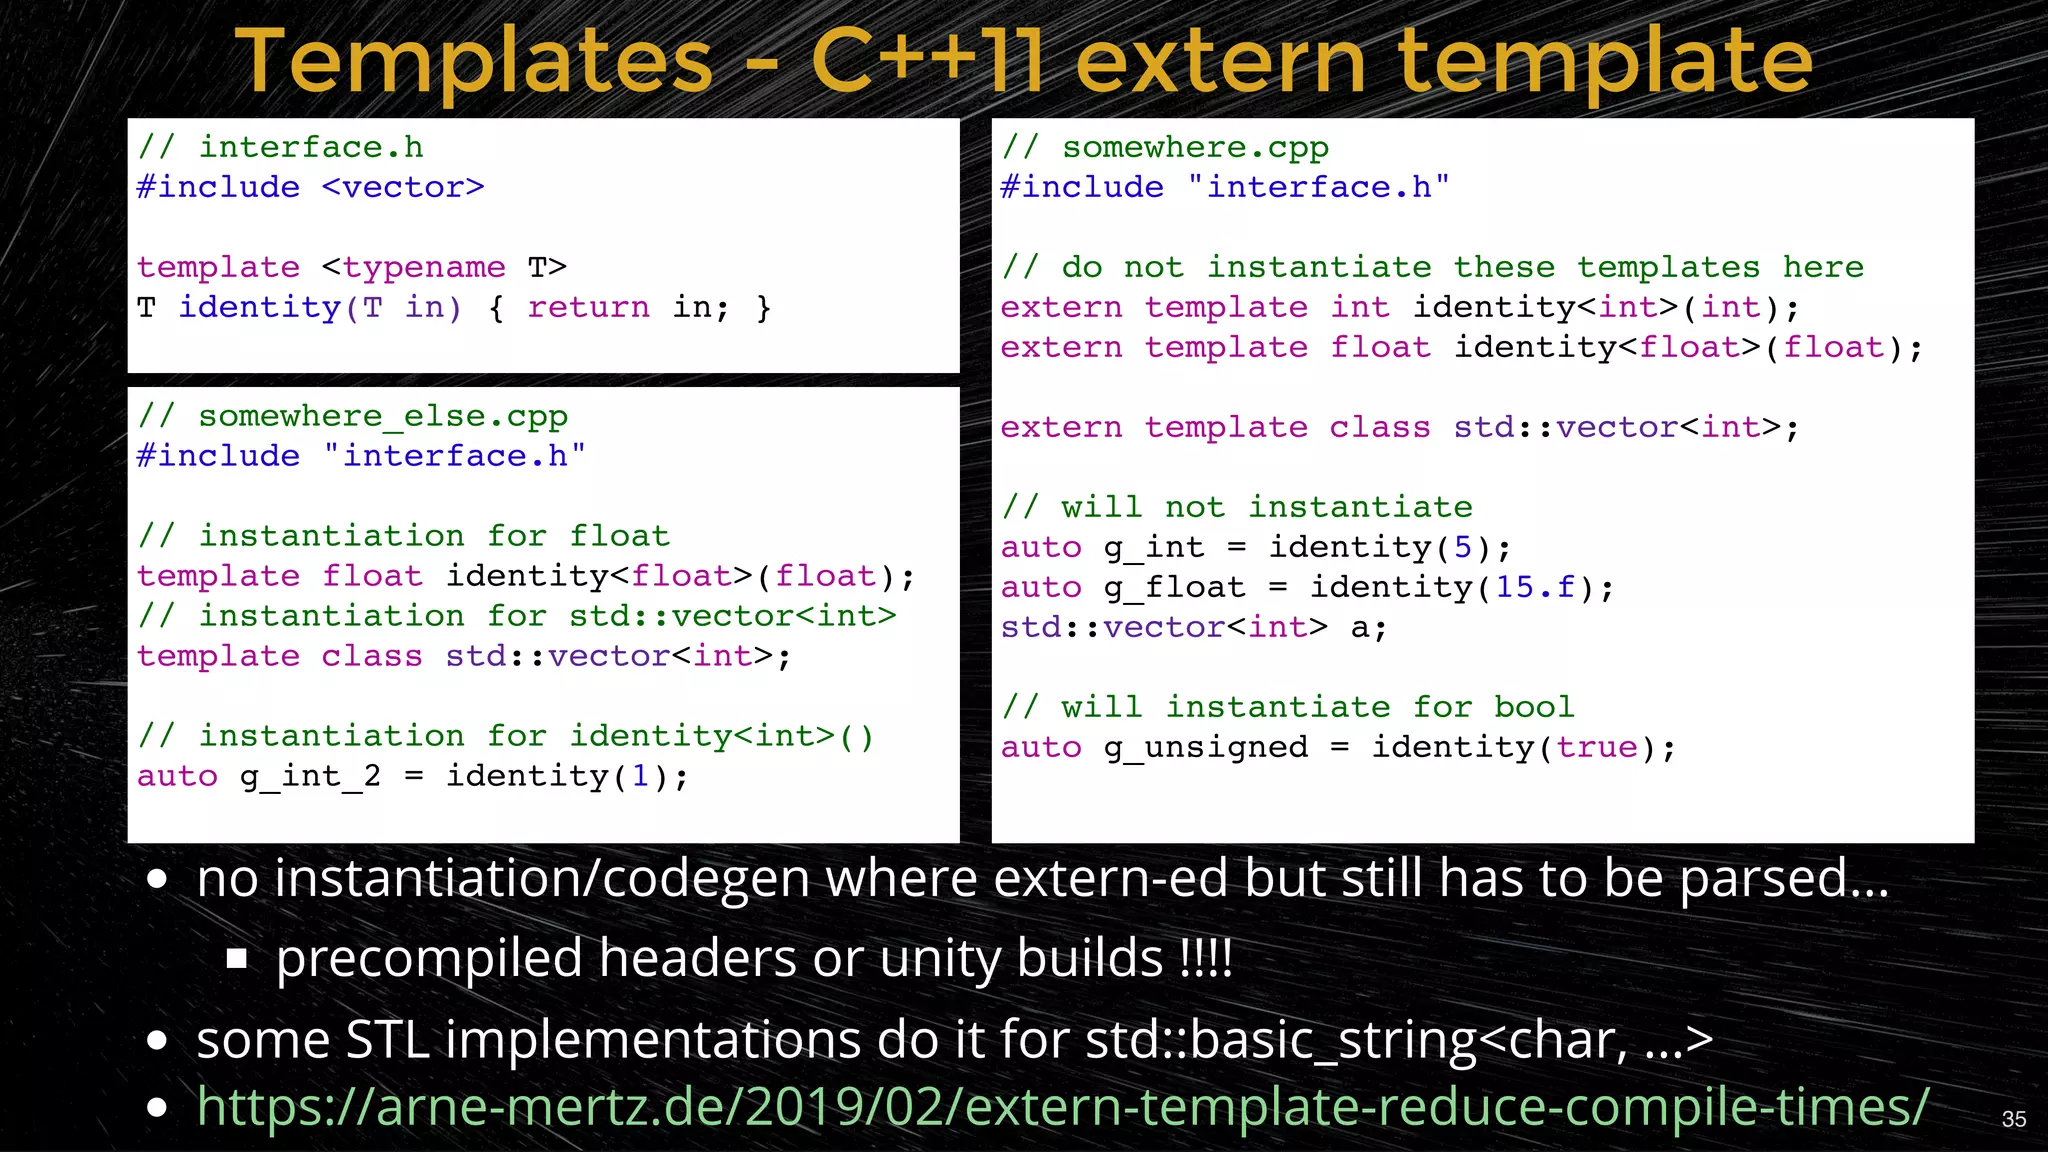
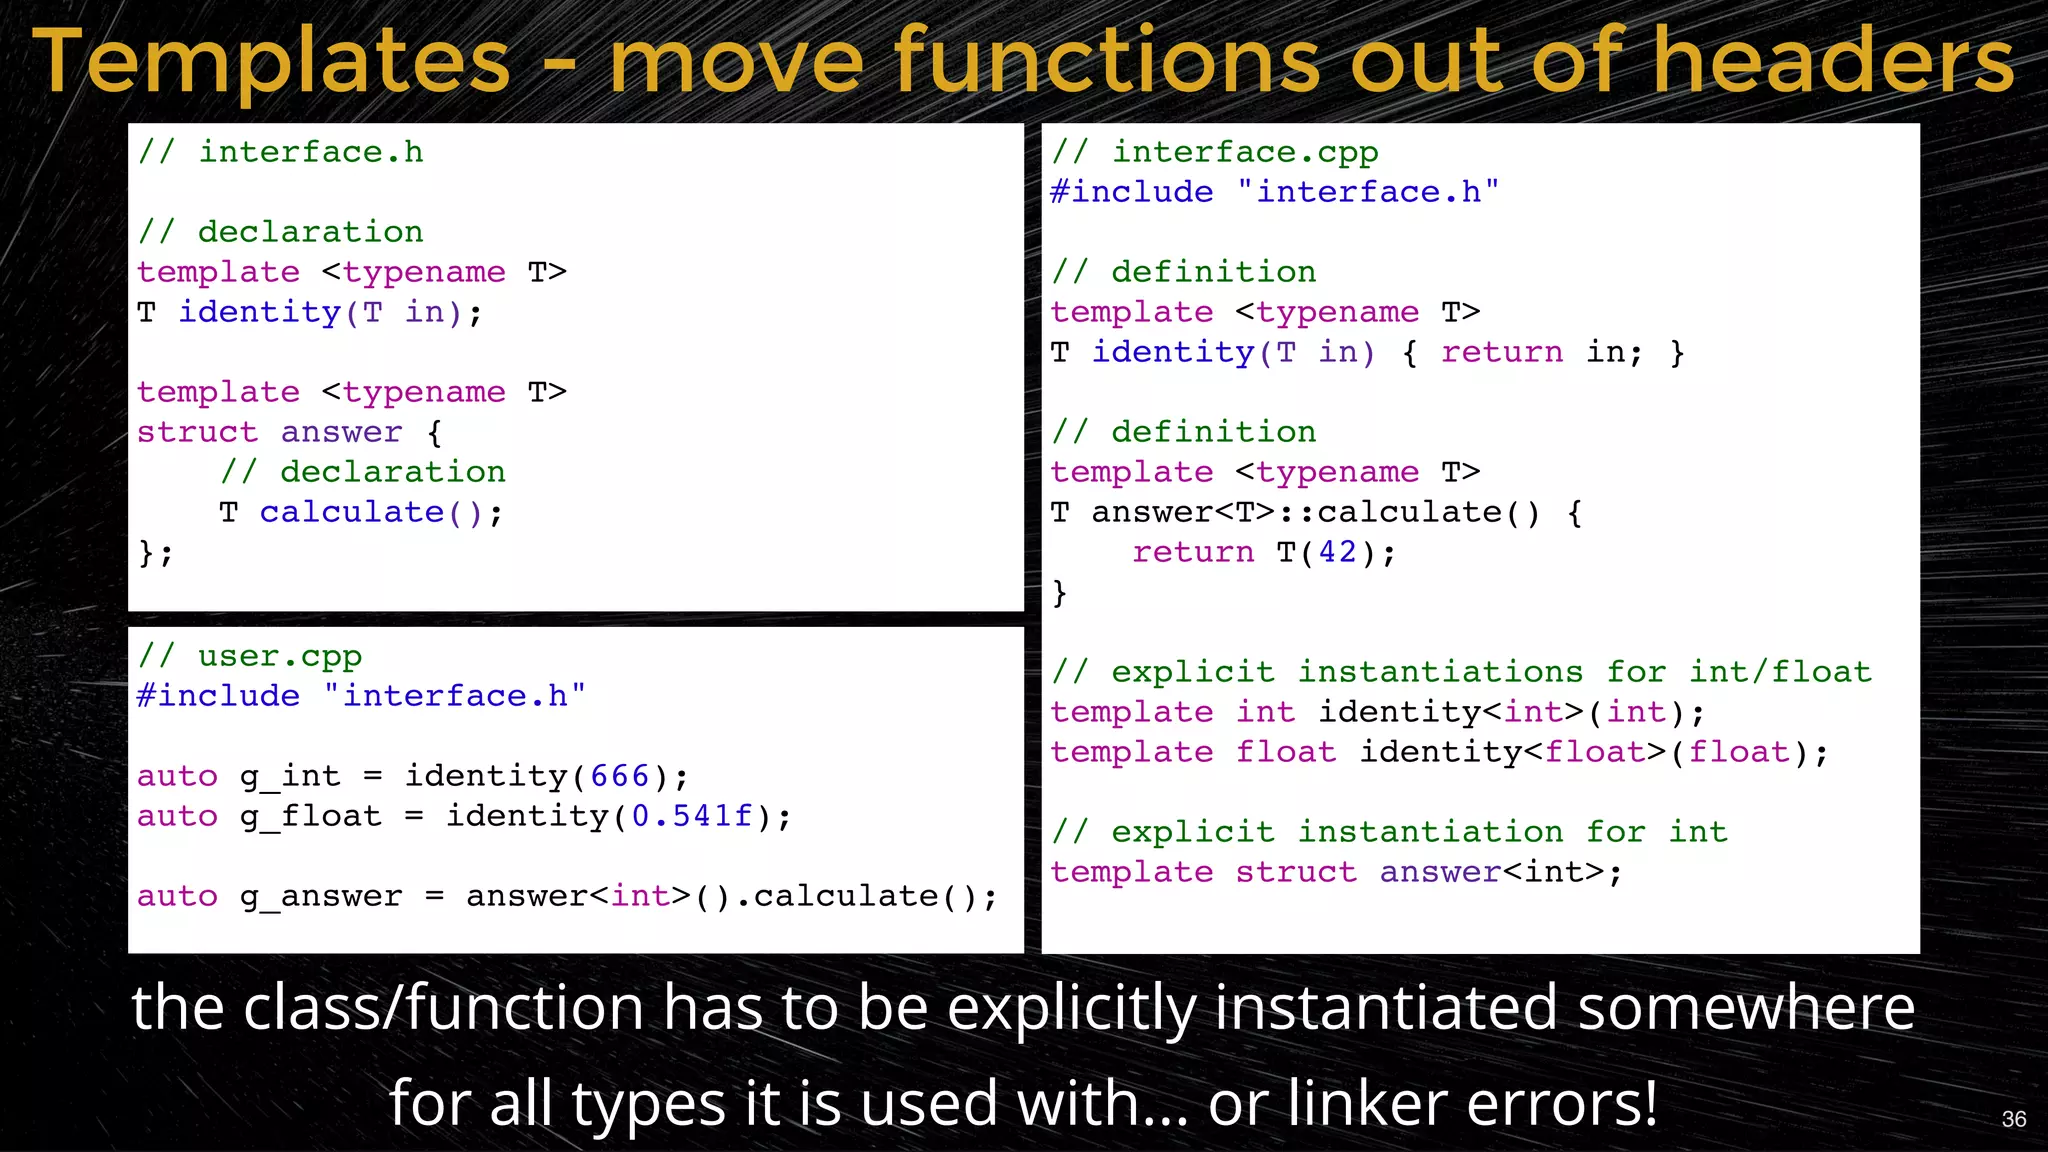
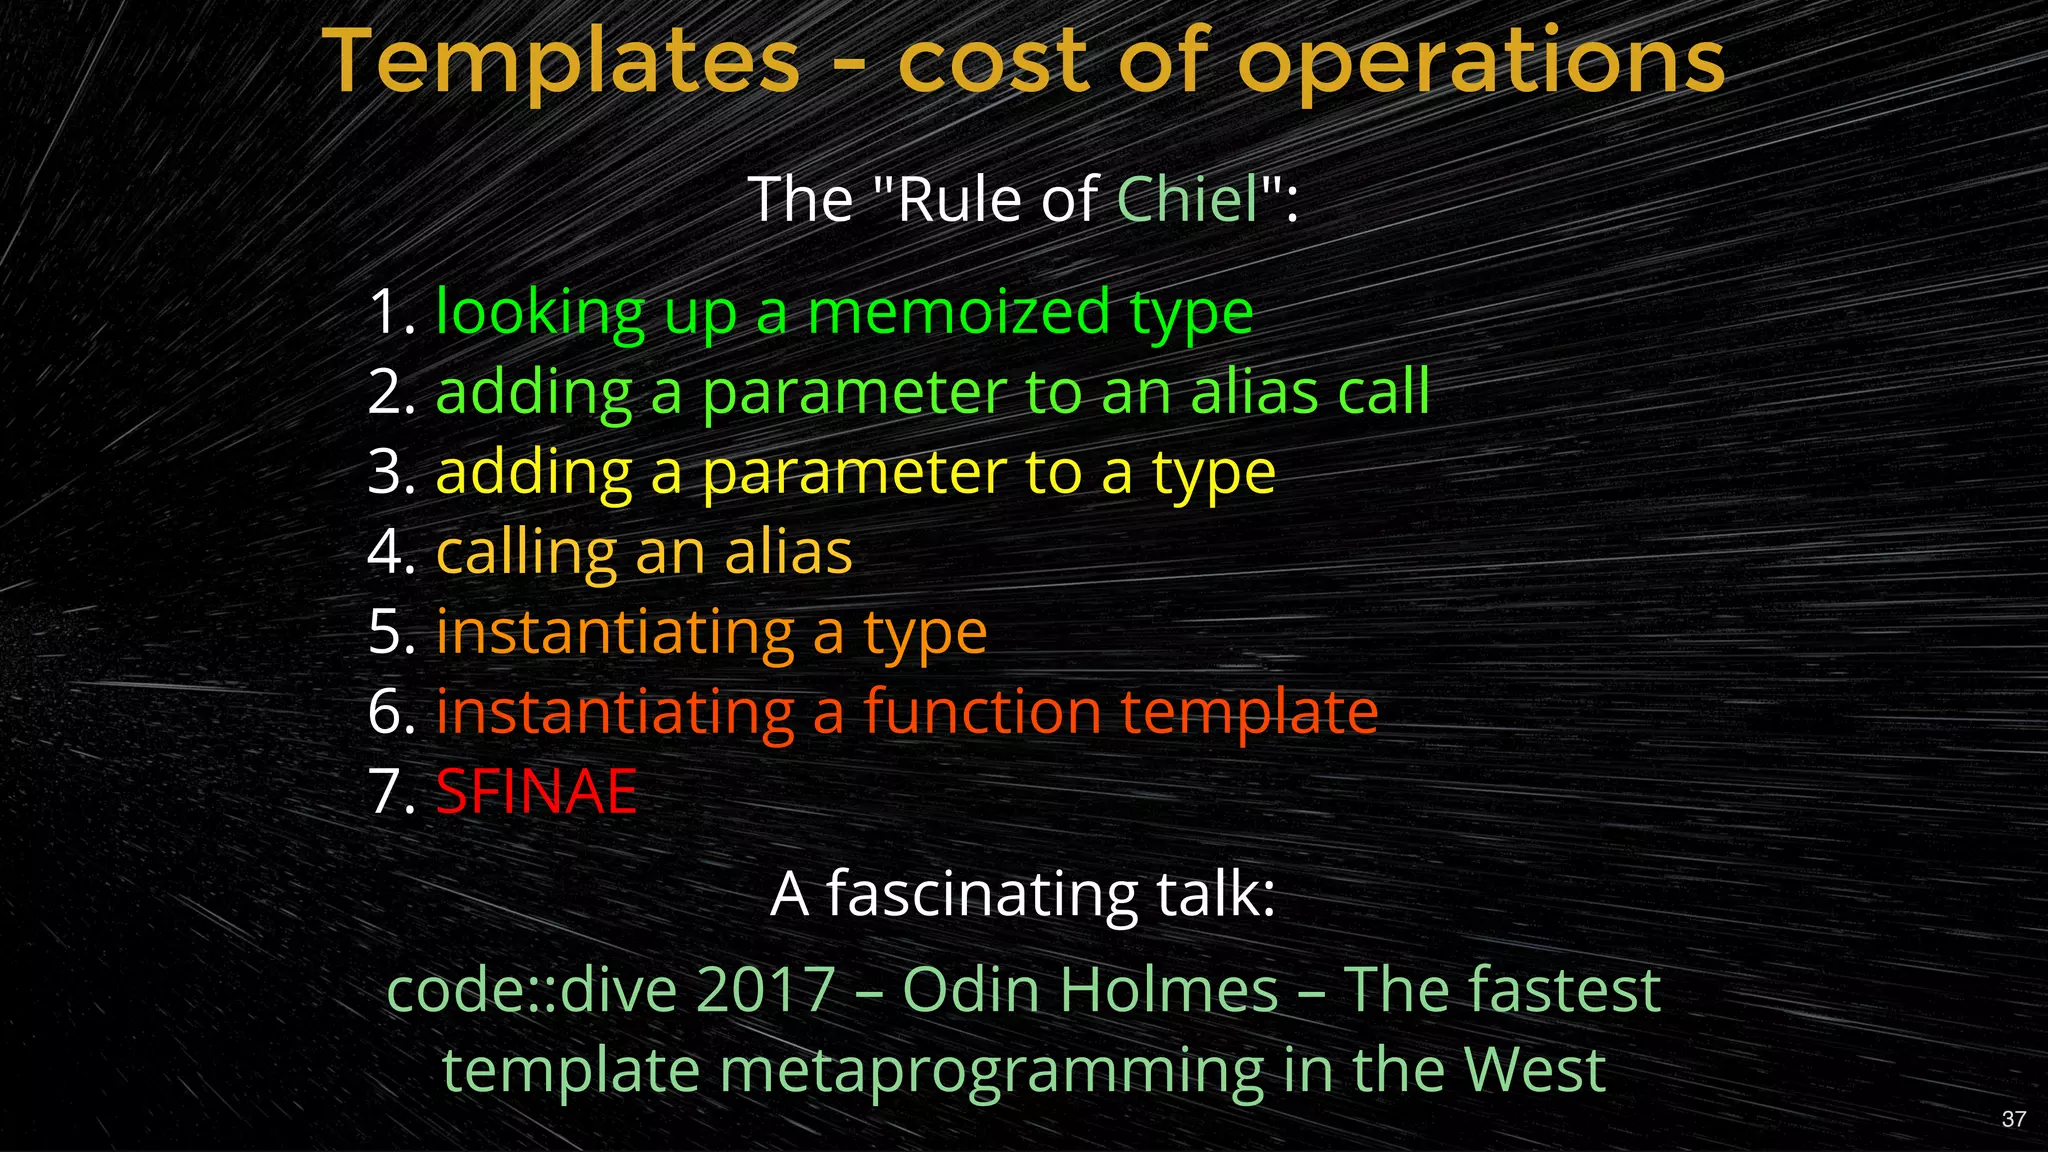
Using inline annotations and template programming to optimize compilation.
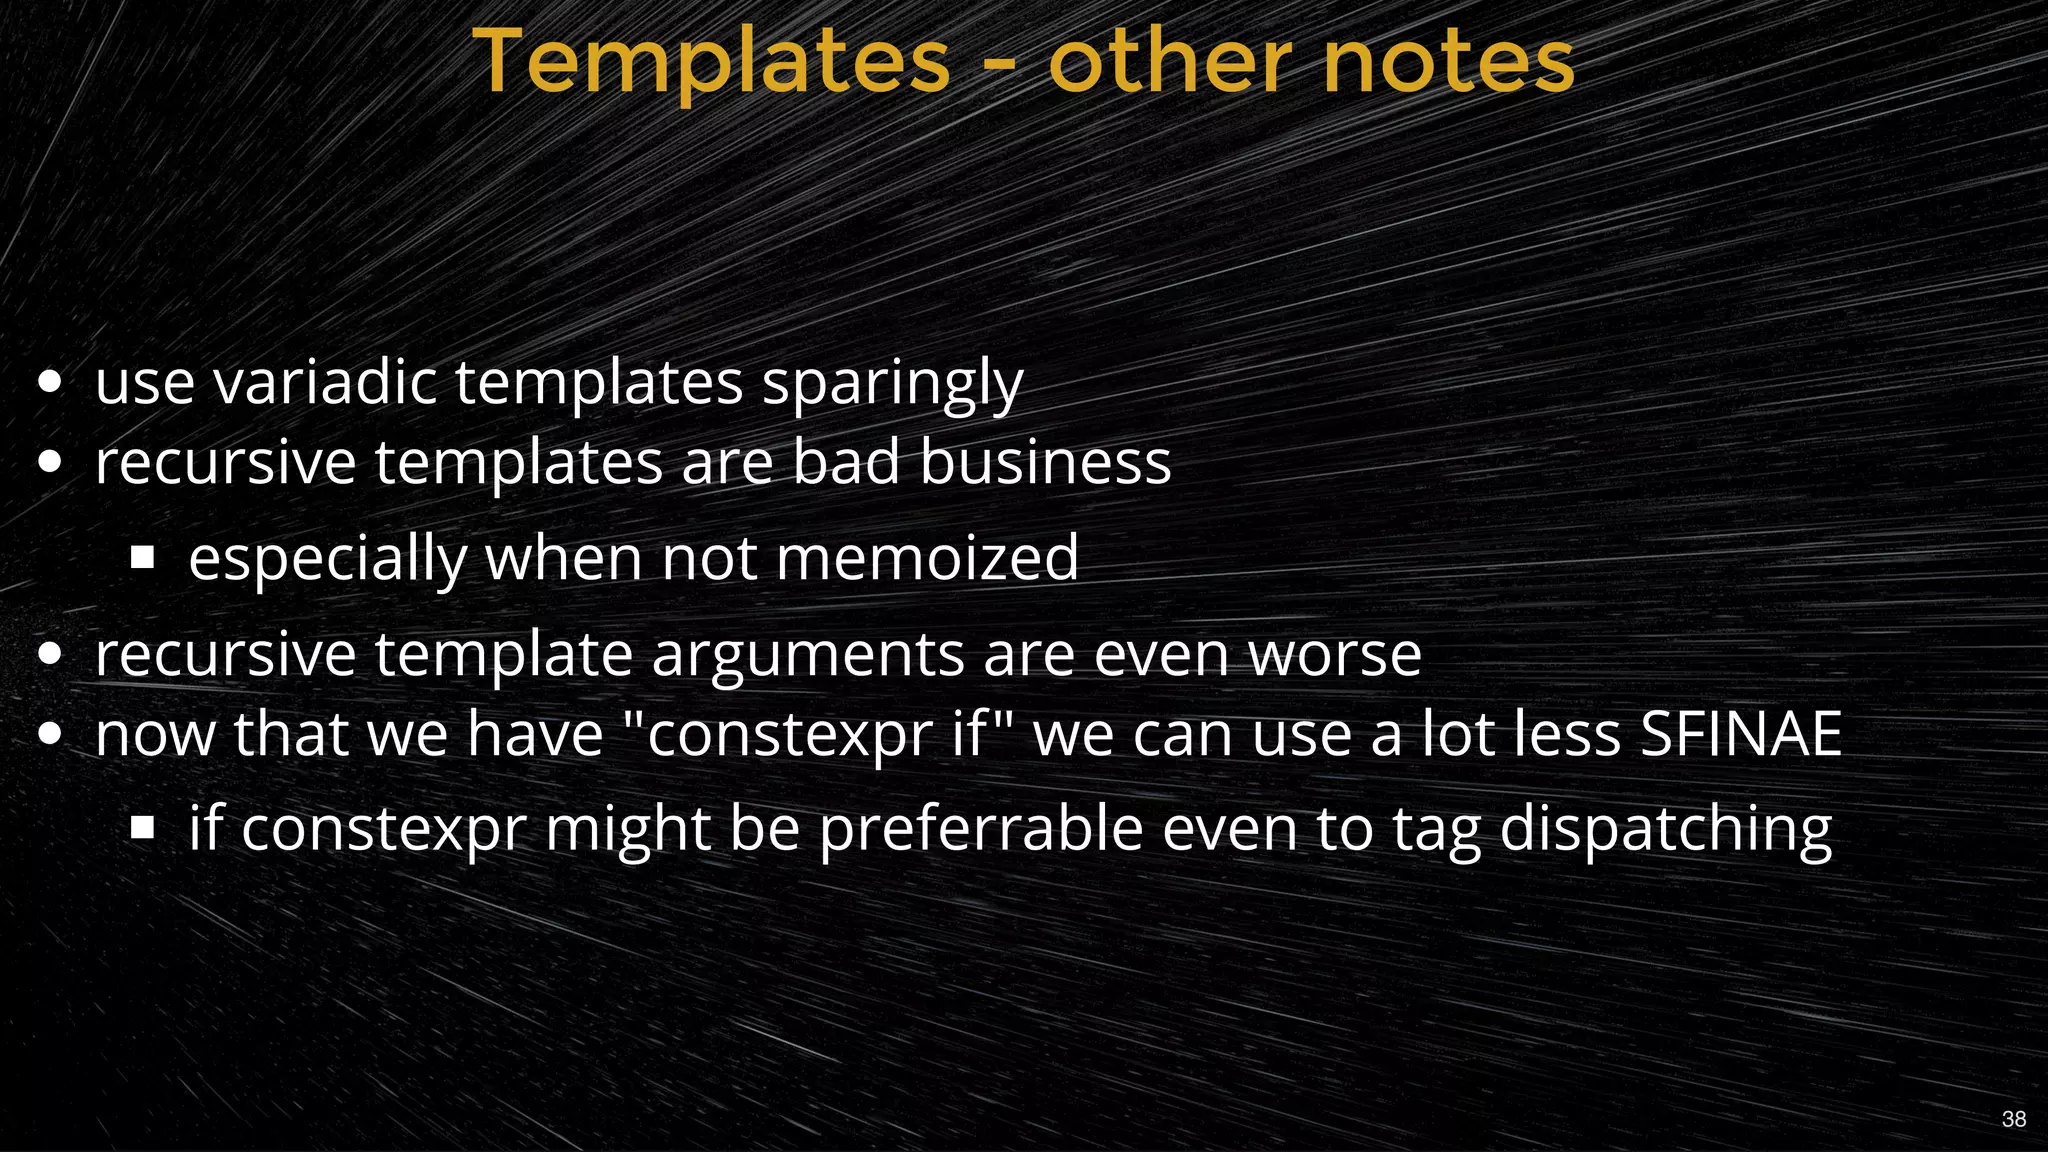
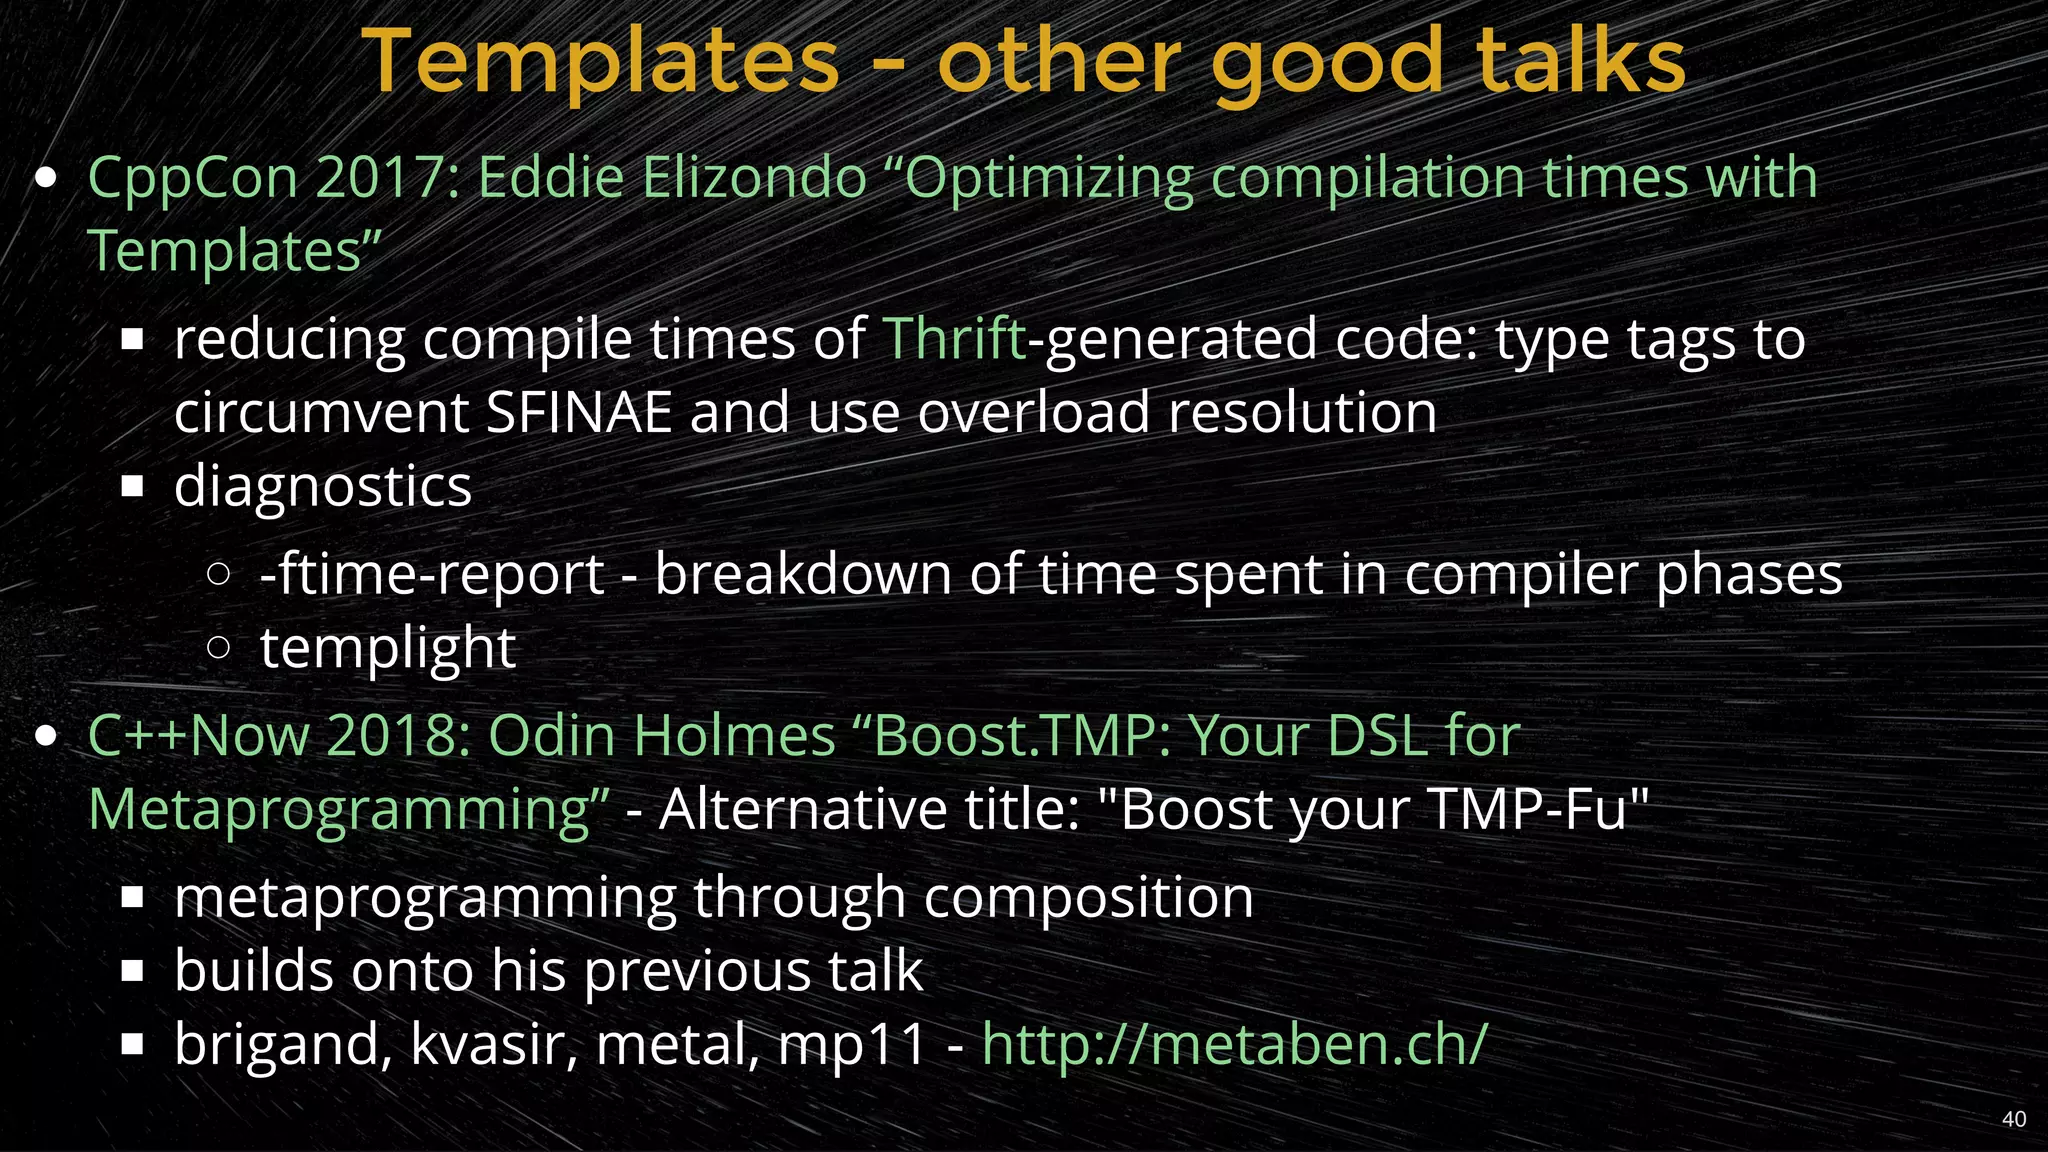
Best practices for managing templates in C++ to reduce compile times and complexity.
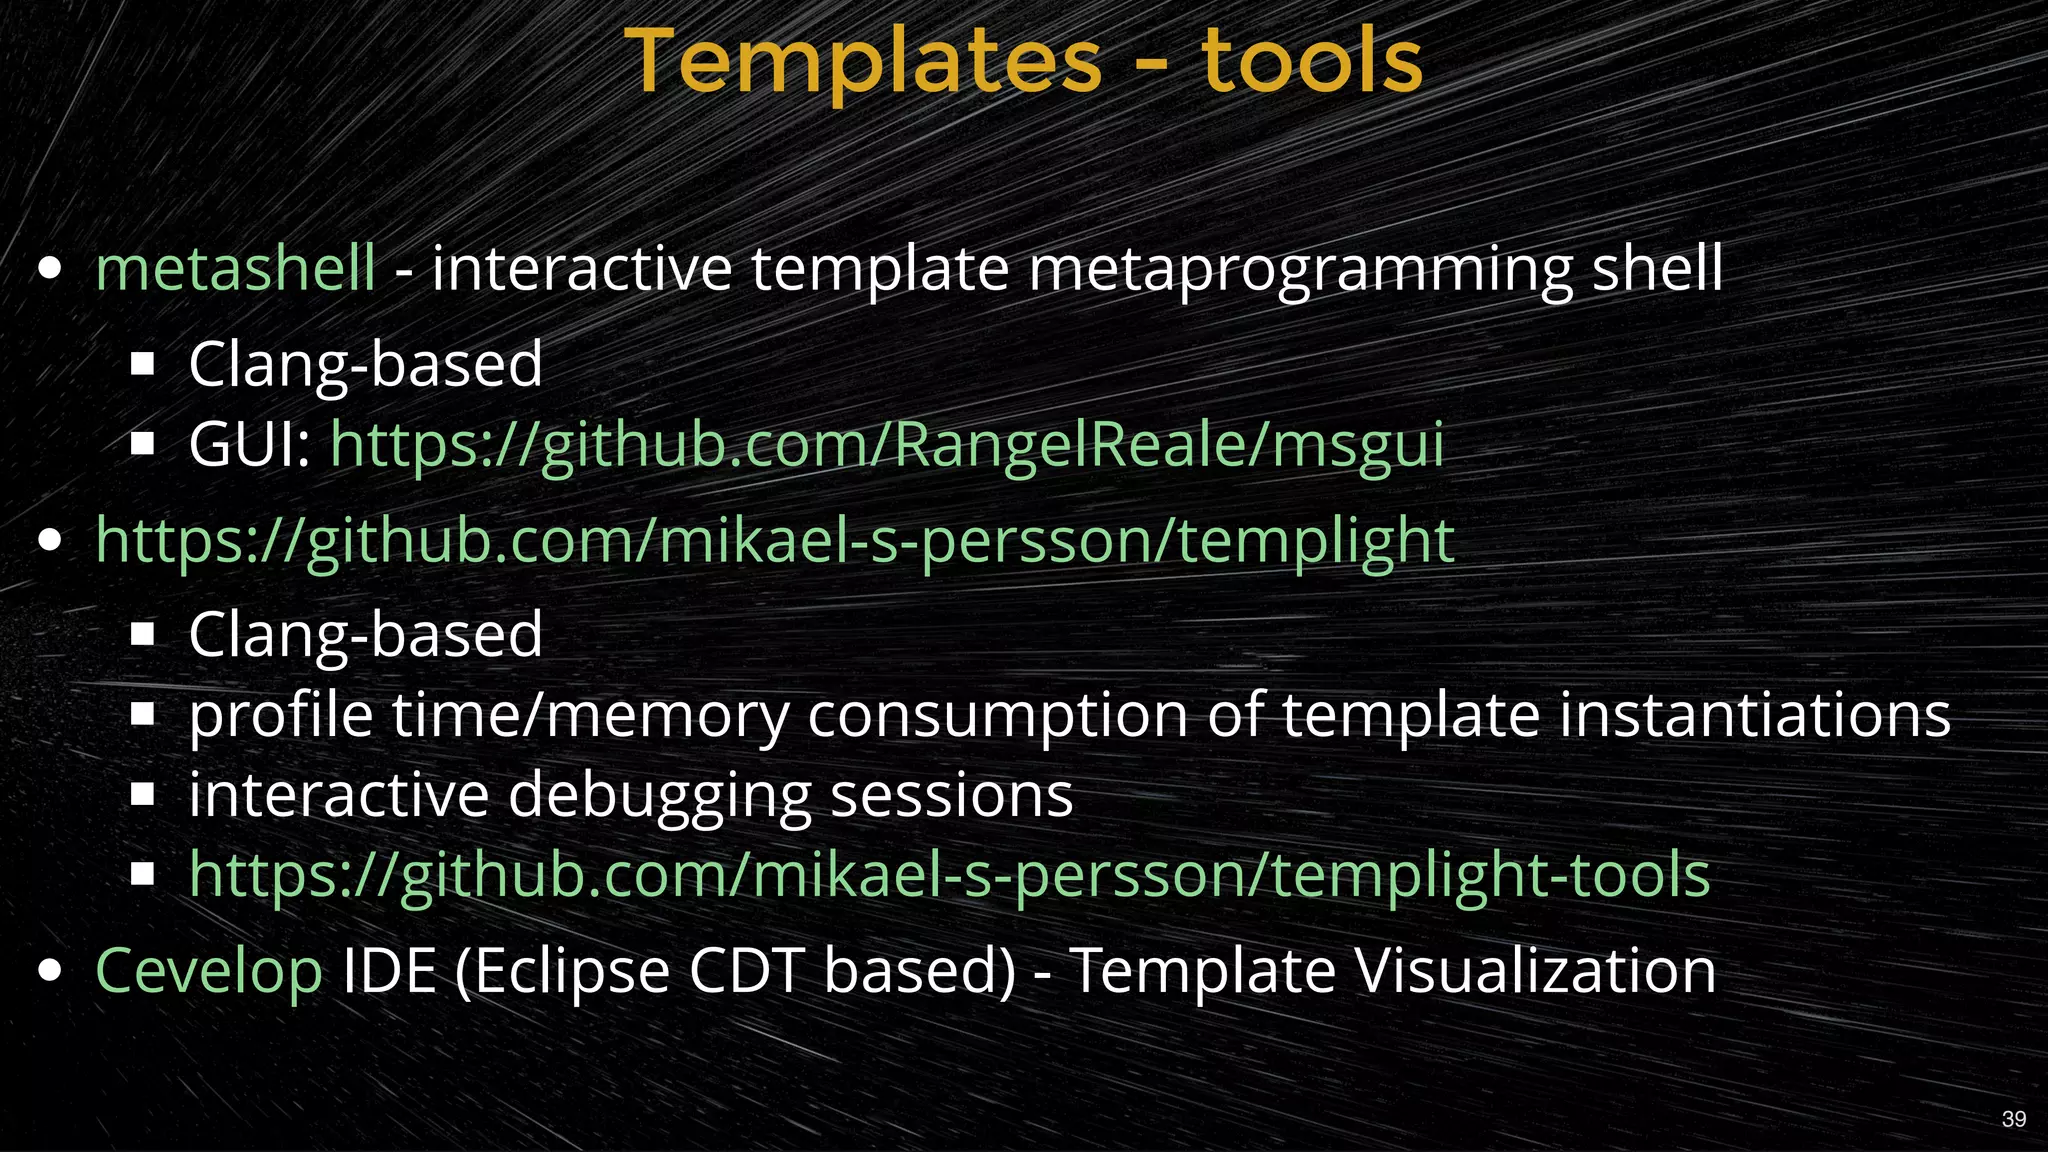
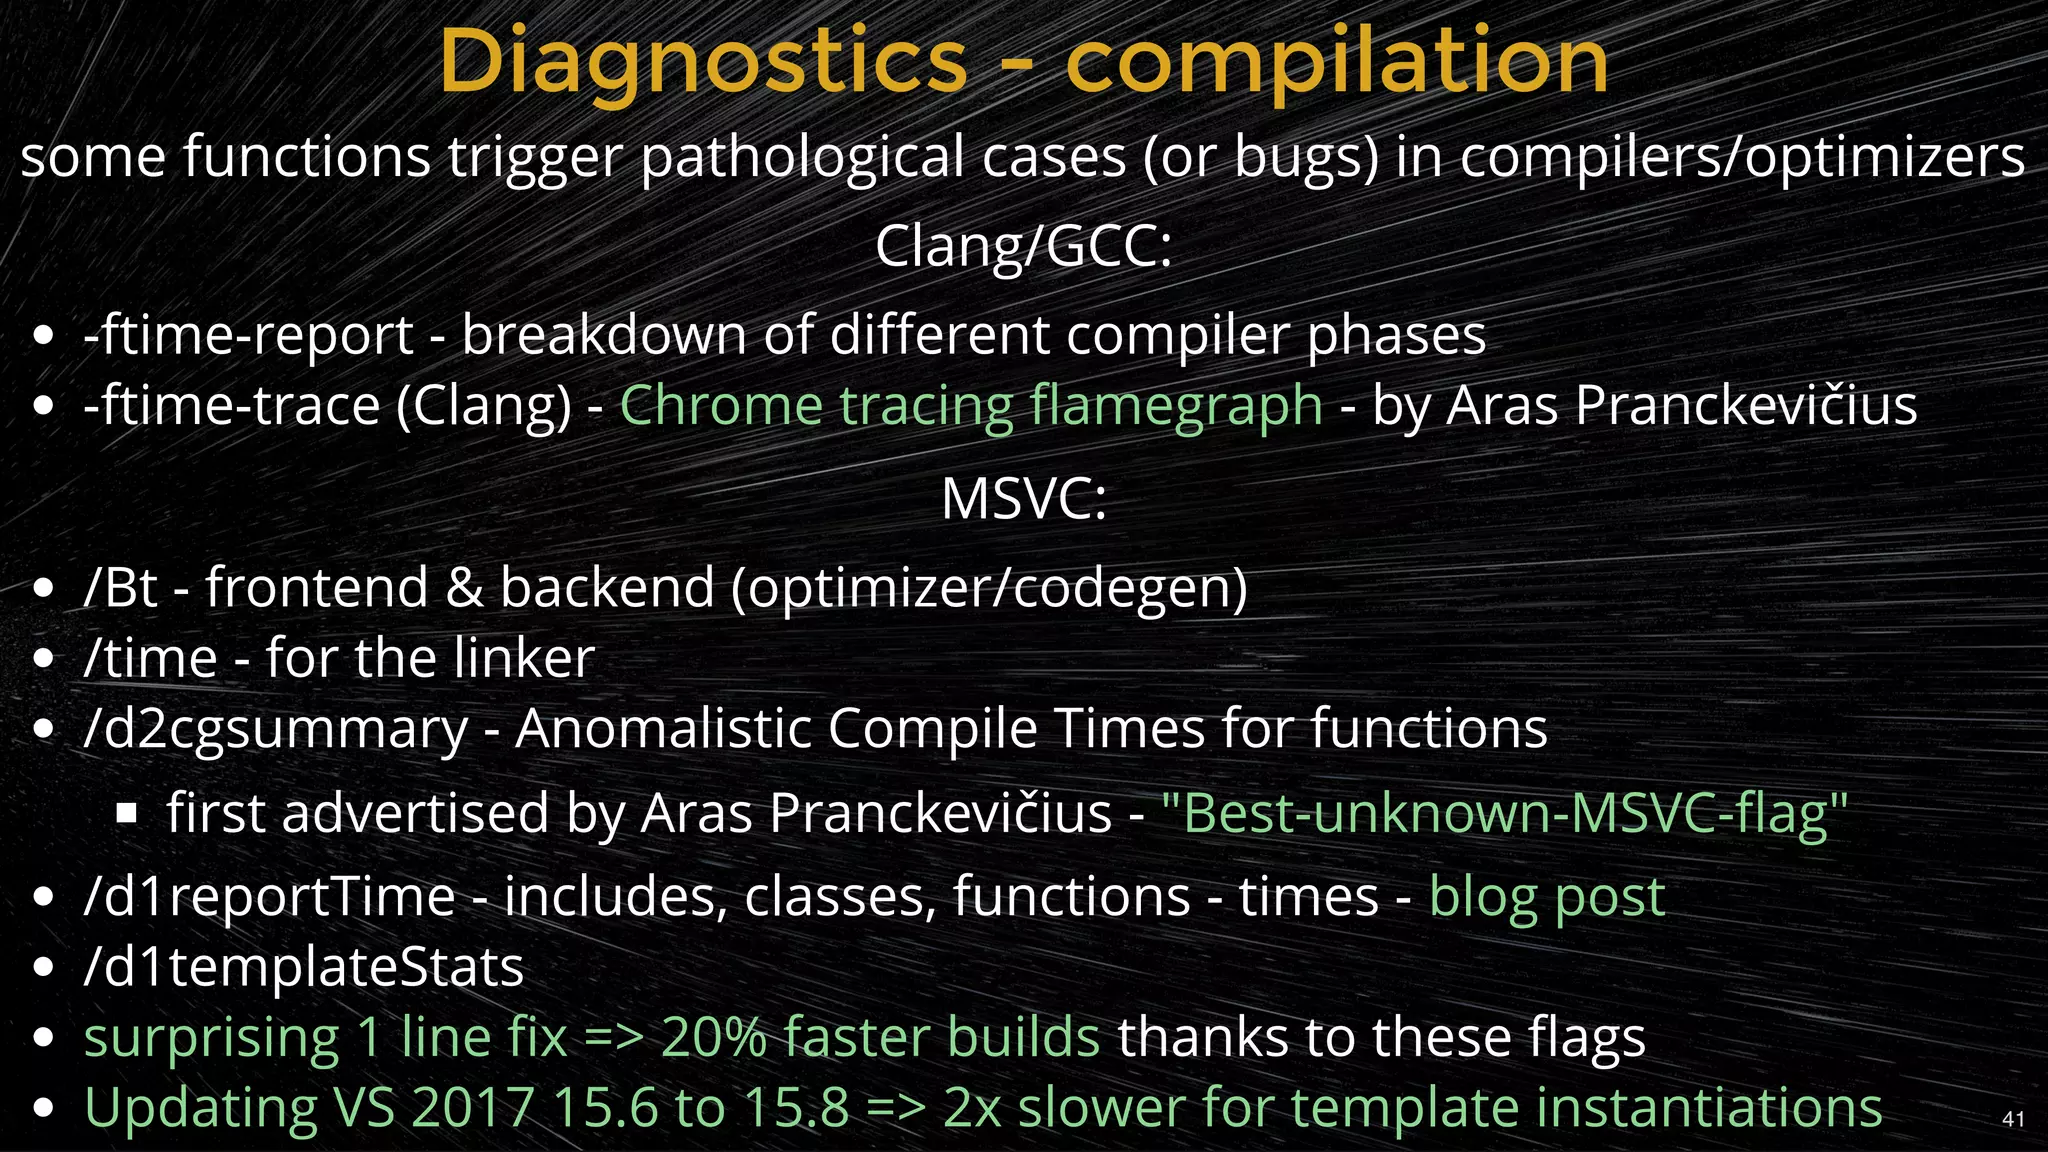
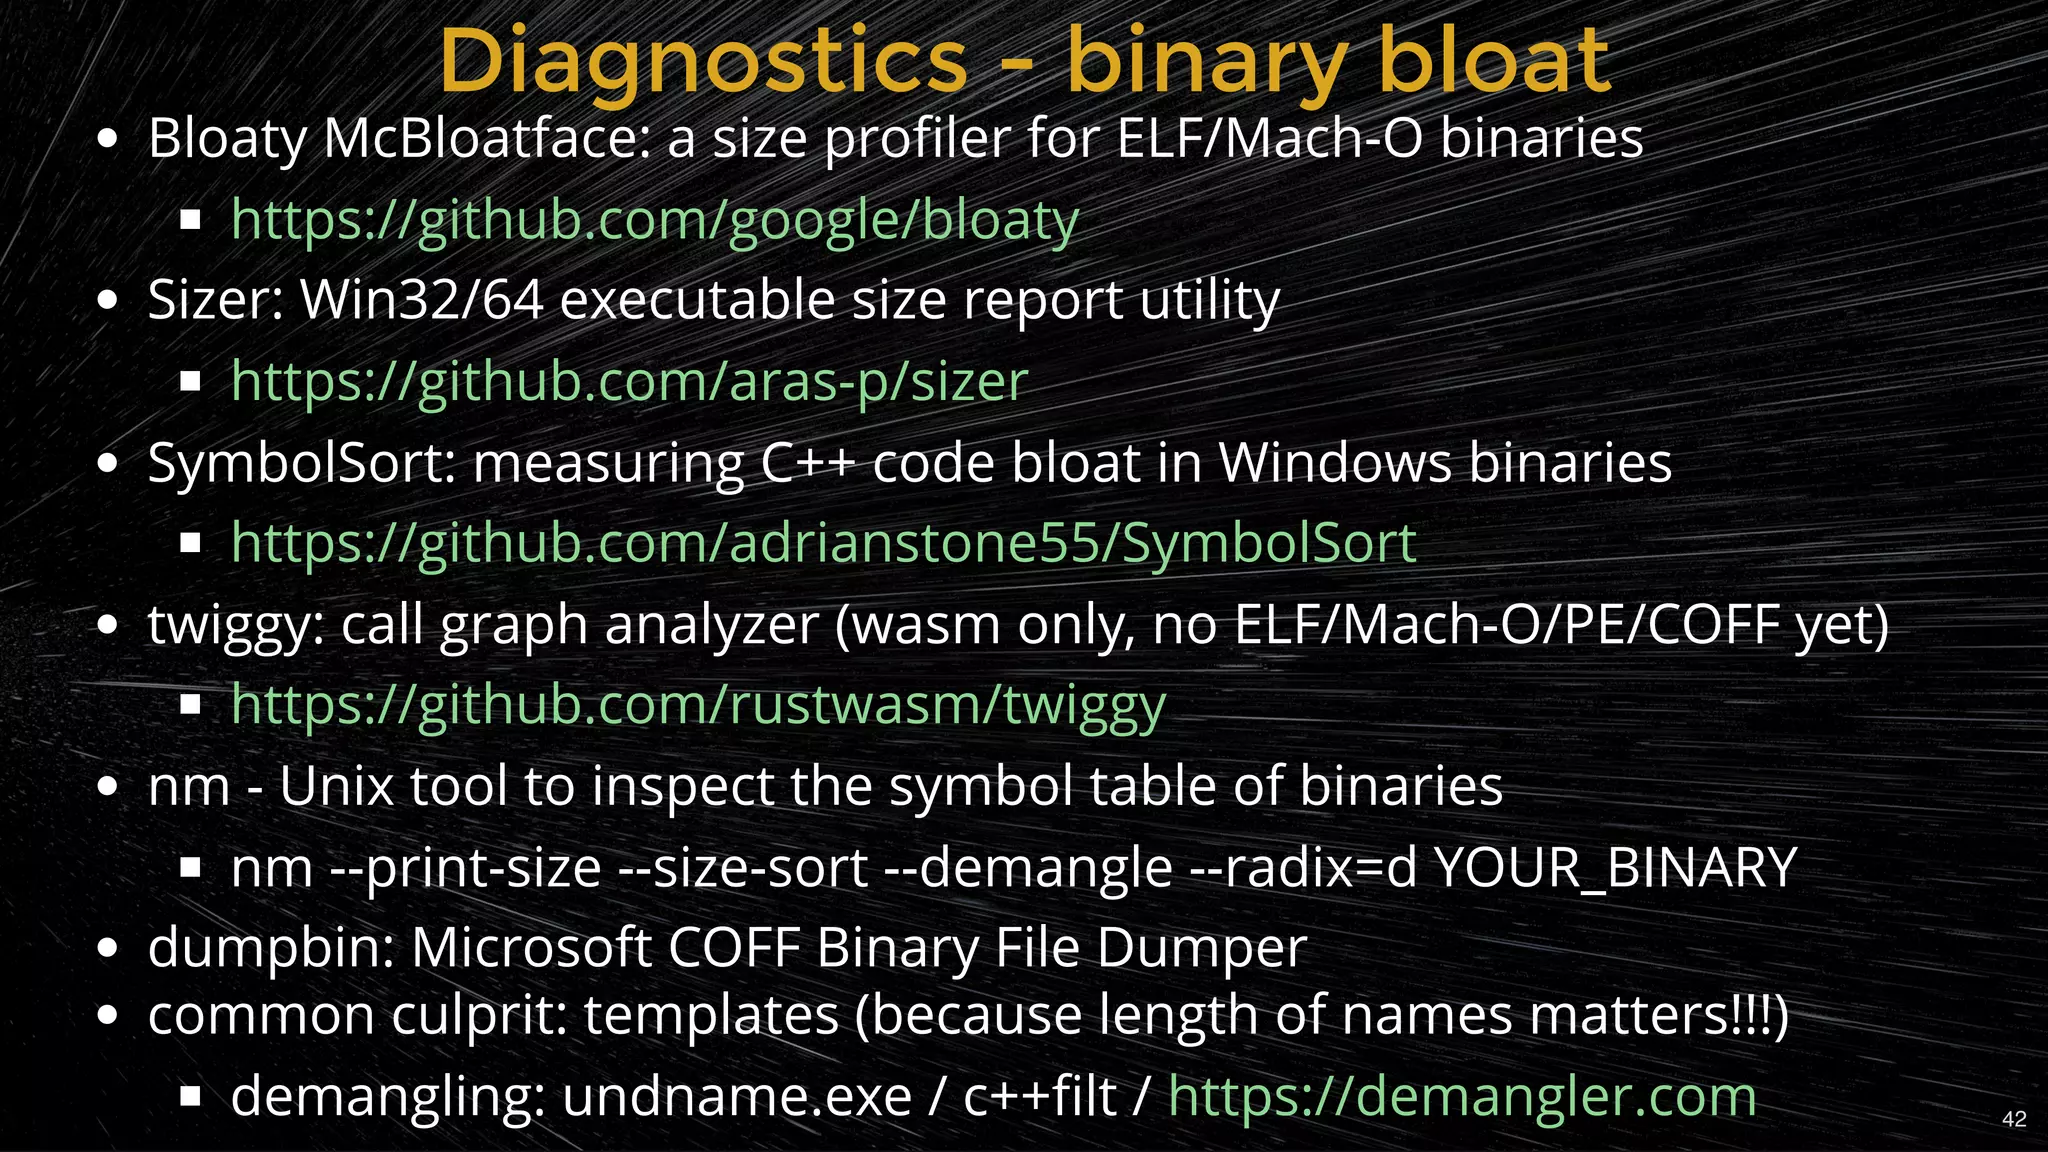
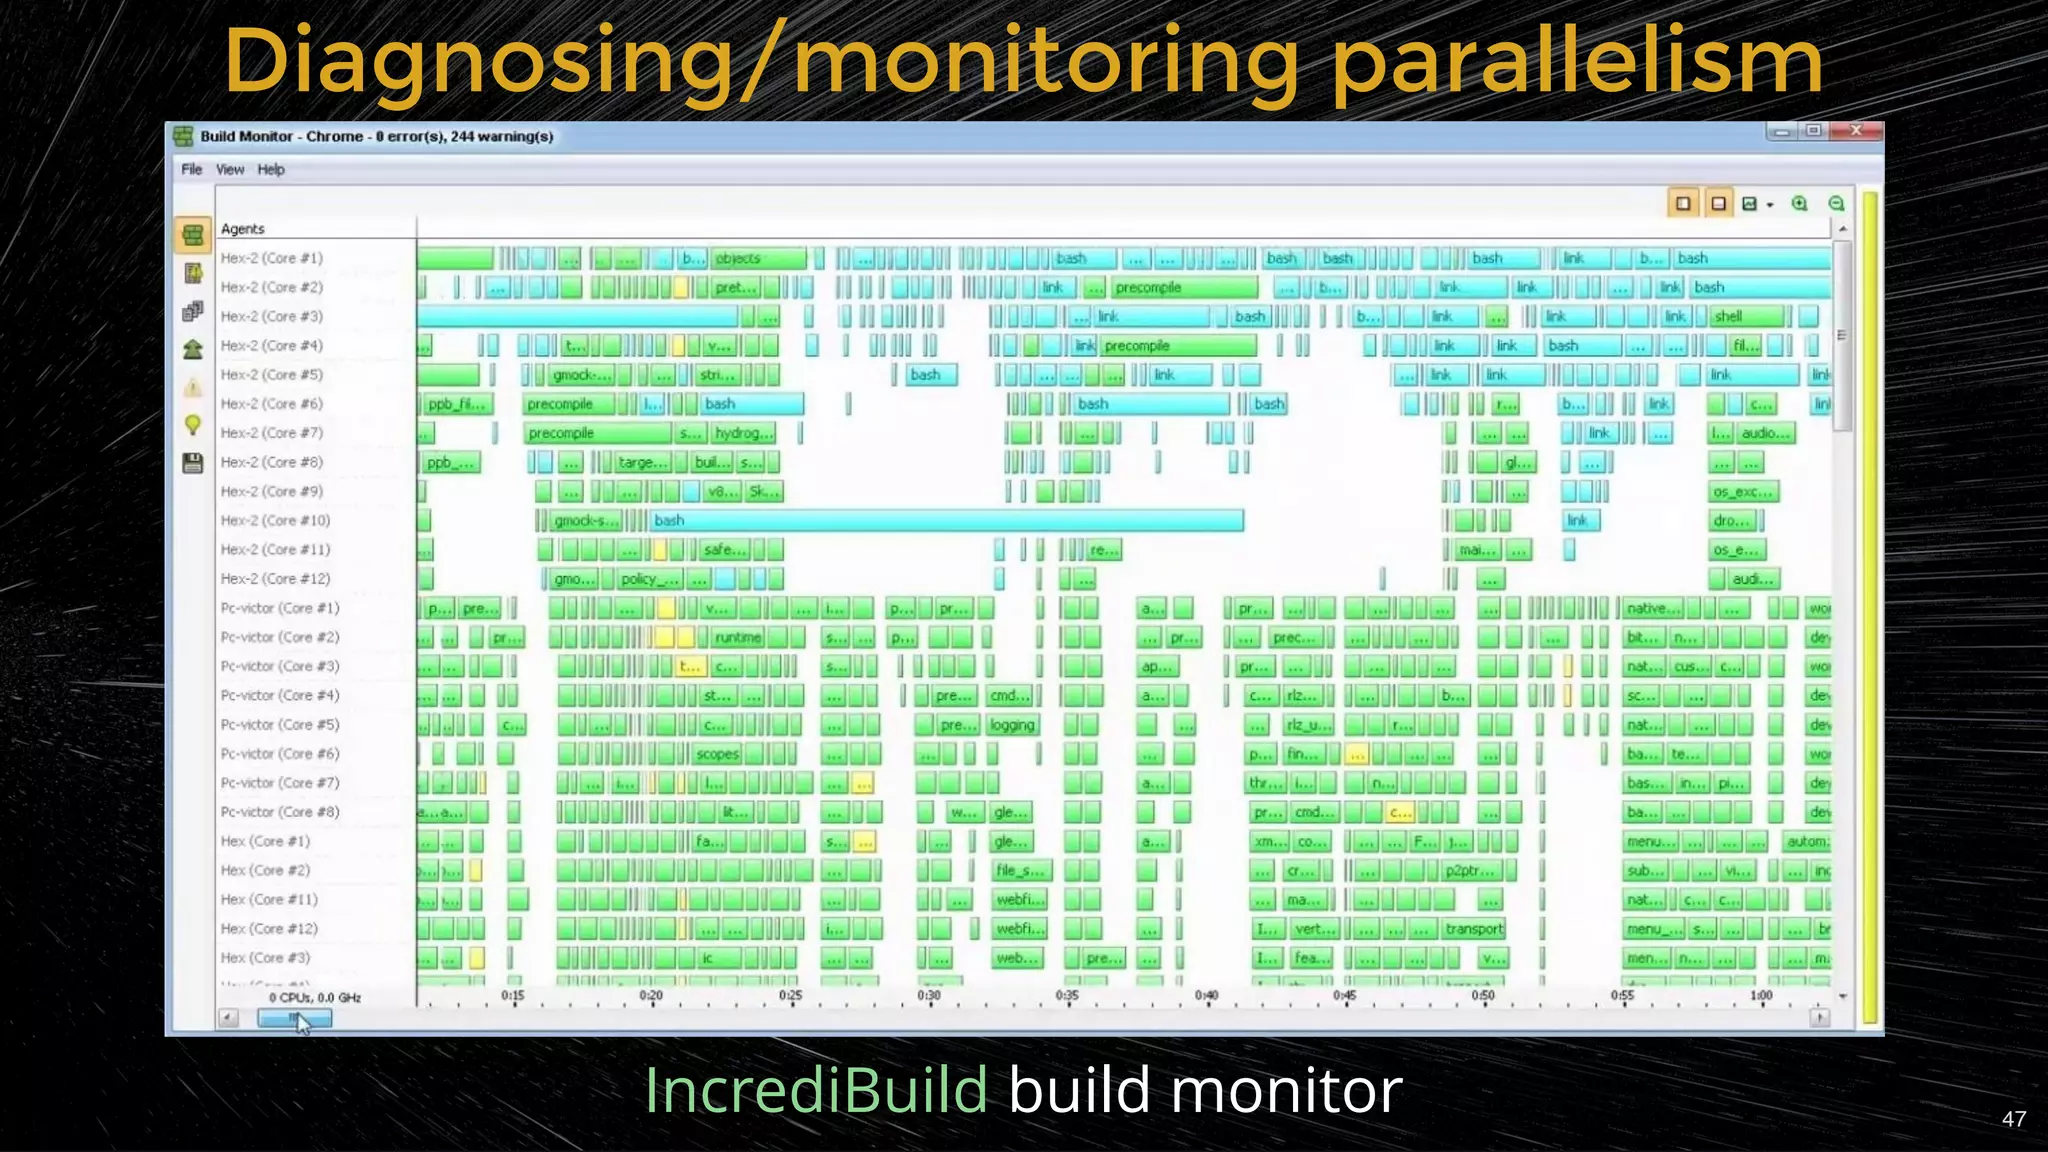
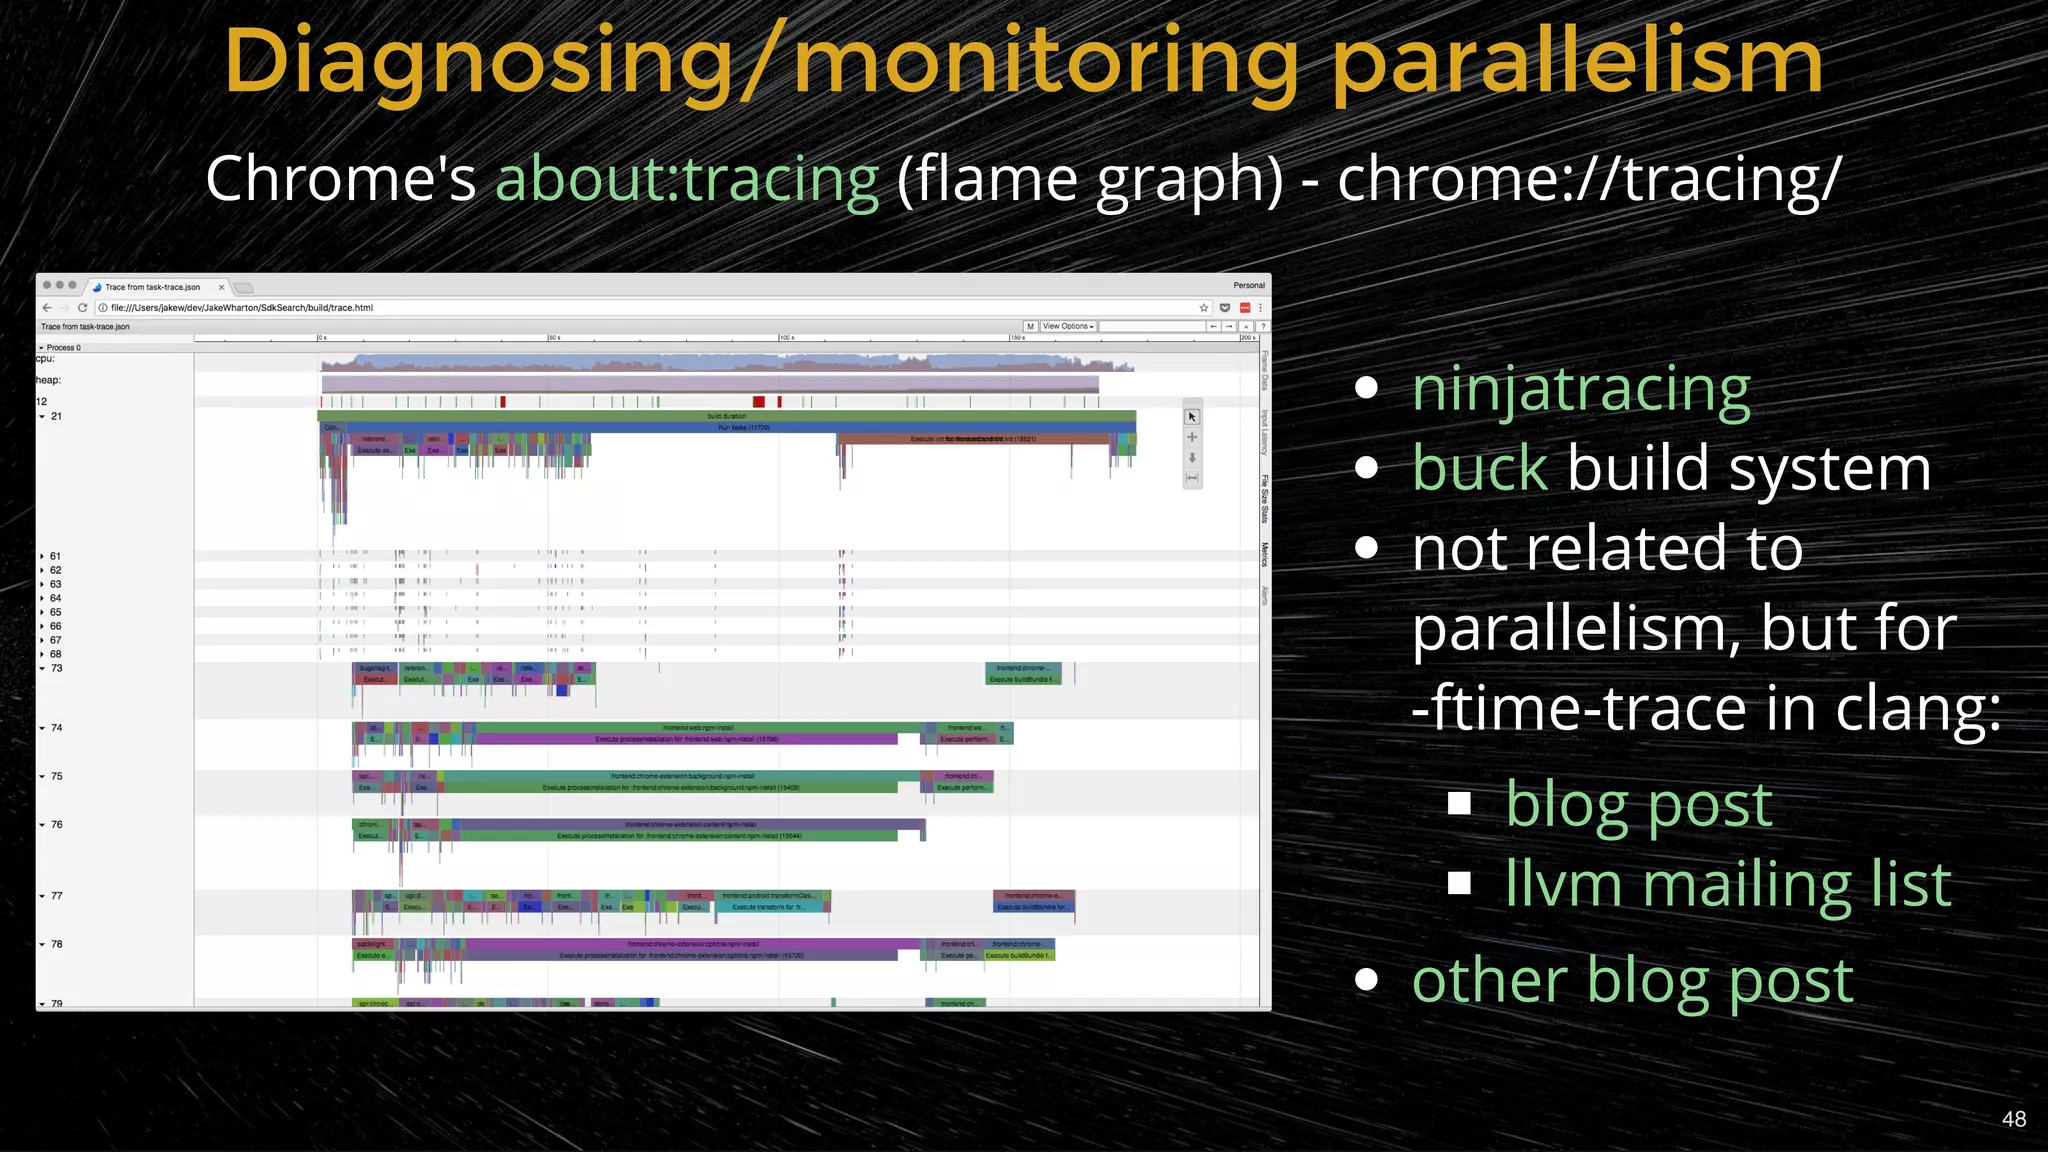
Tools and techniques for diagnosing slow compilation and improving efficiency.
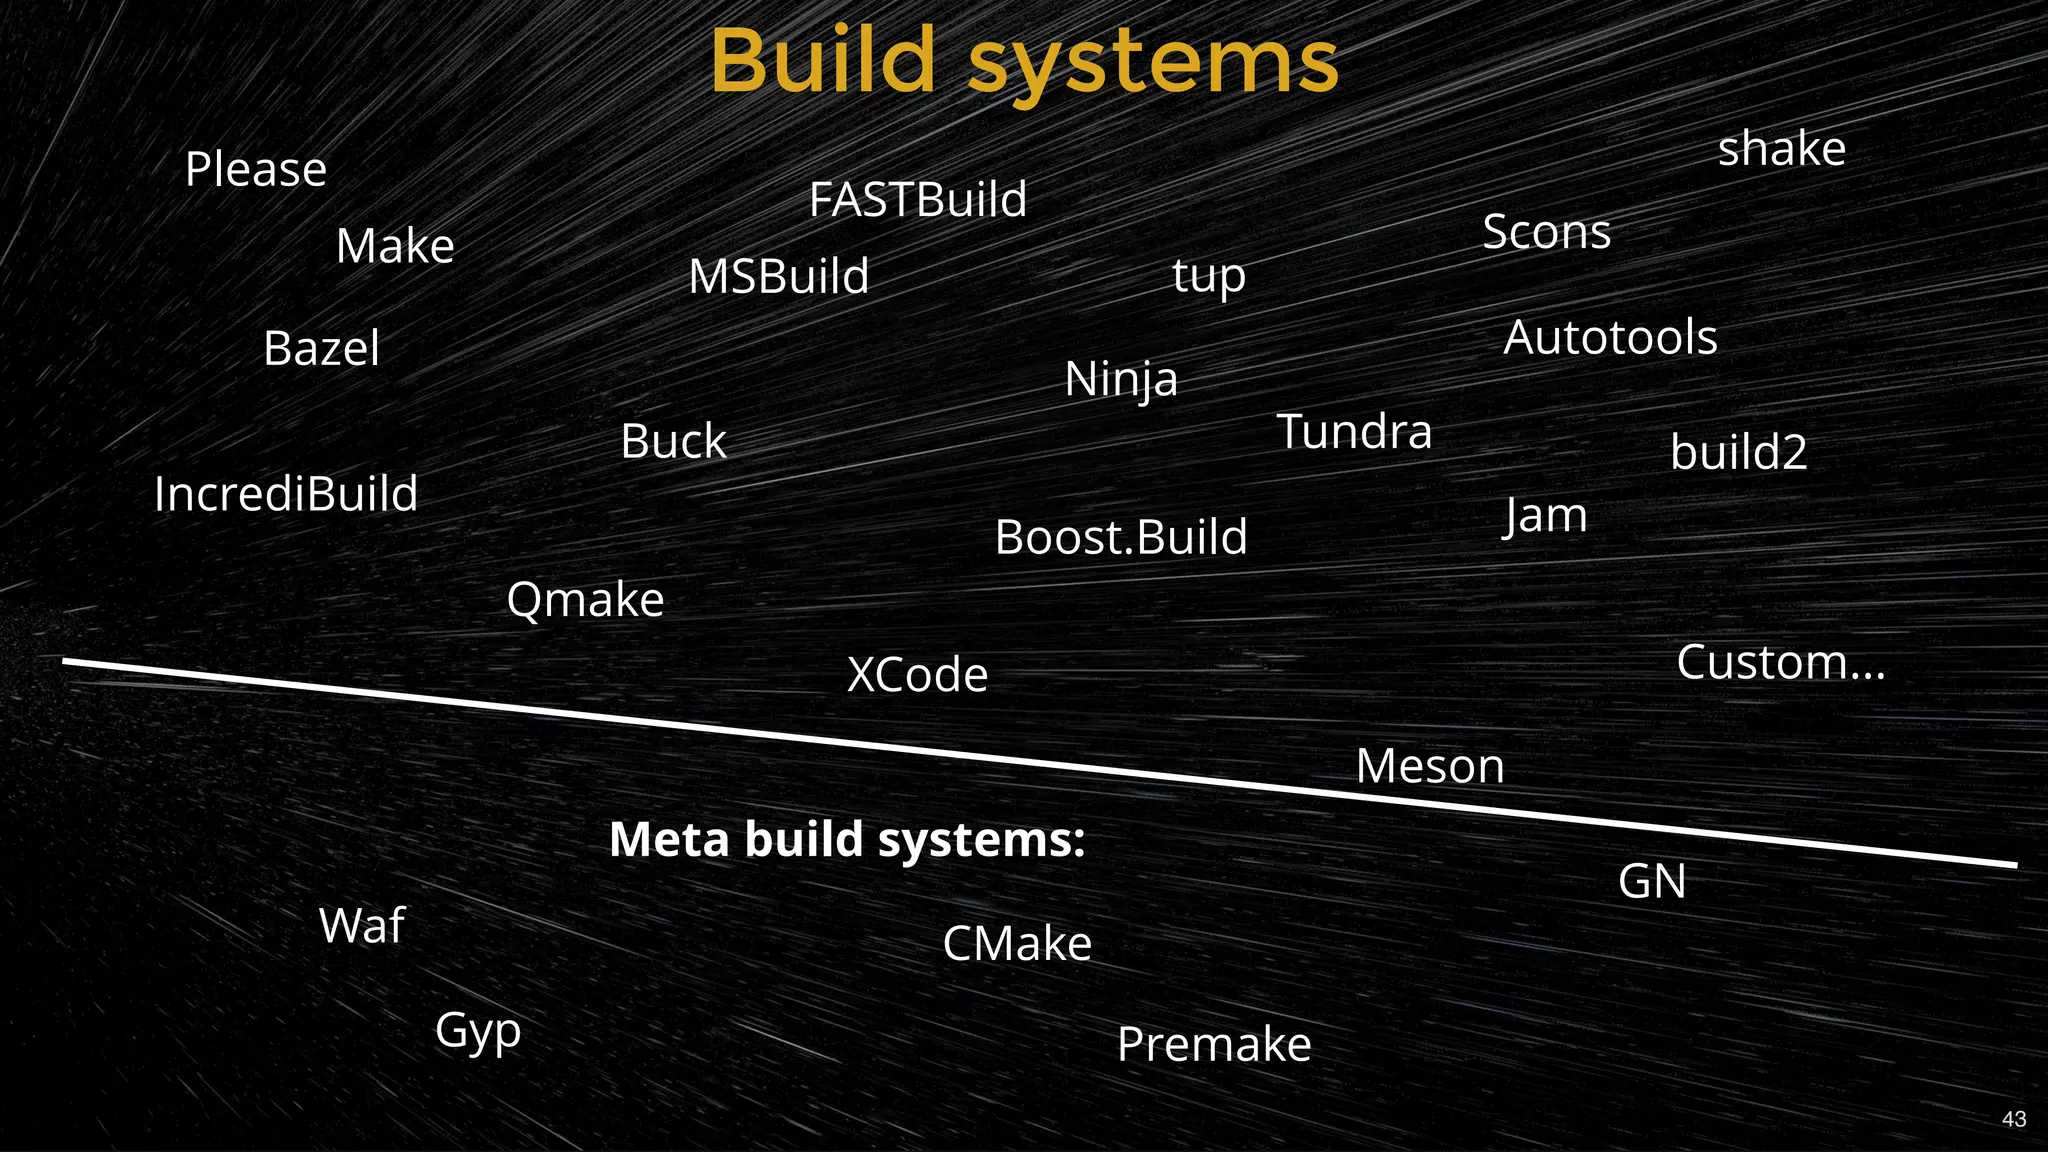
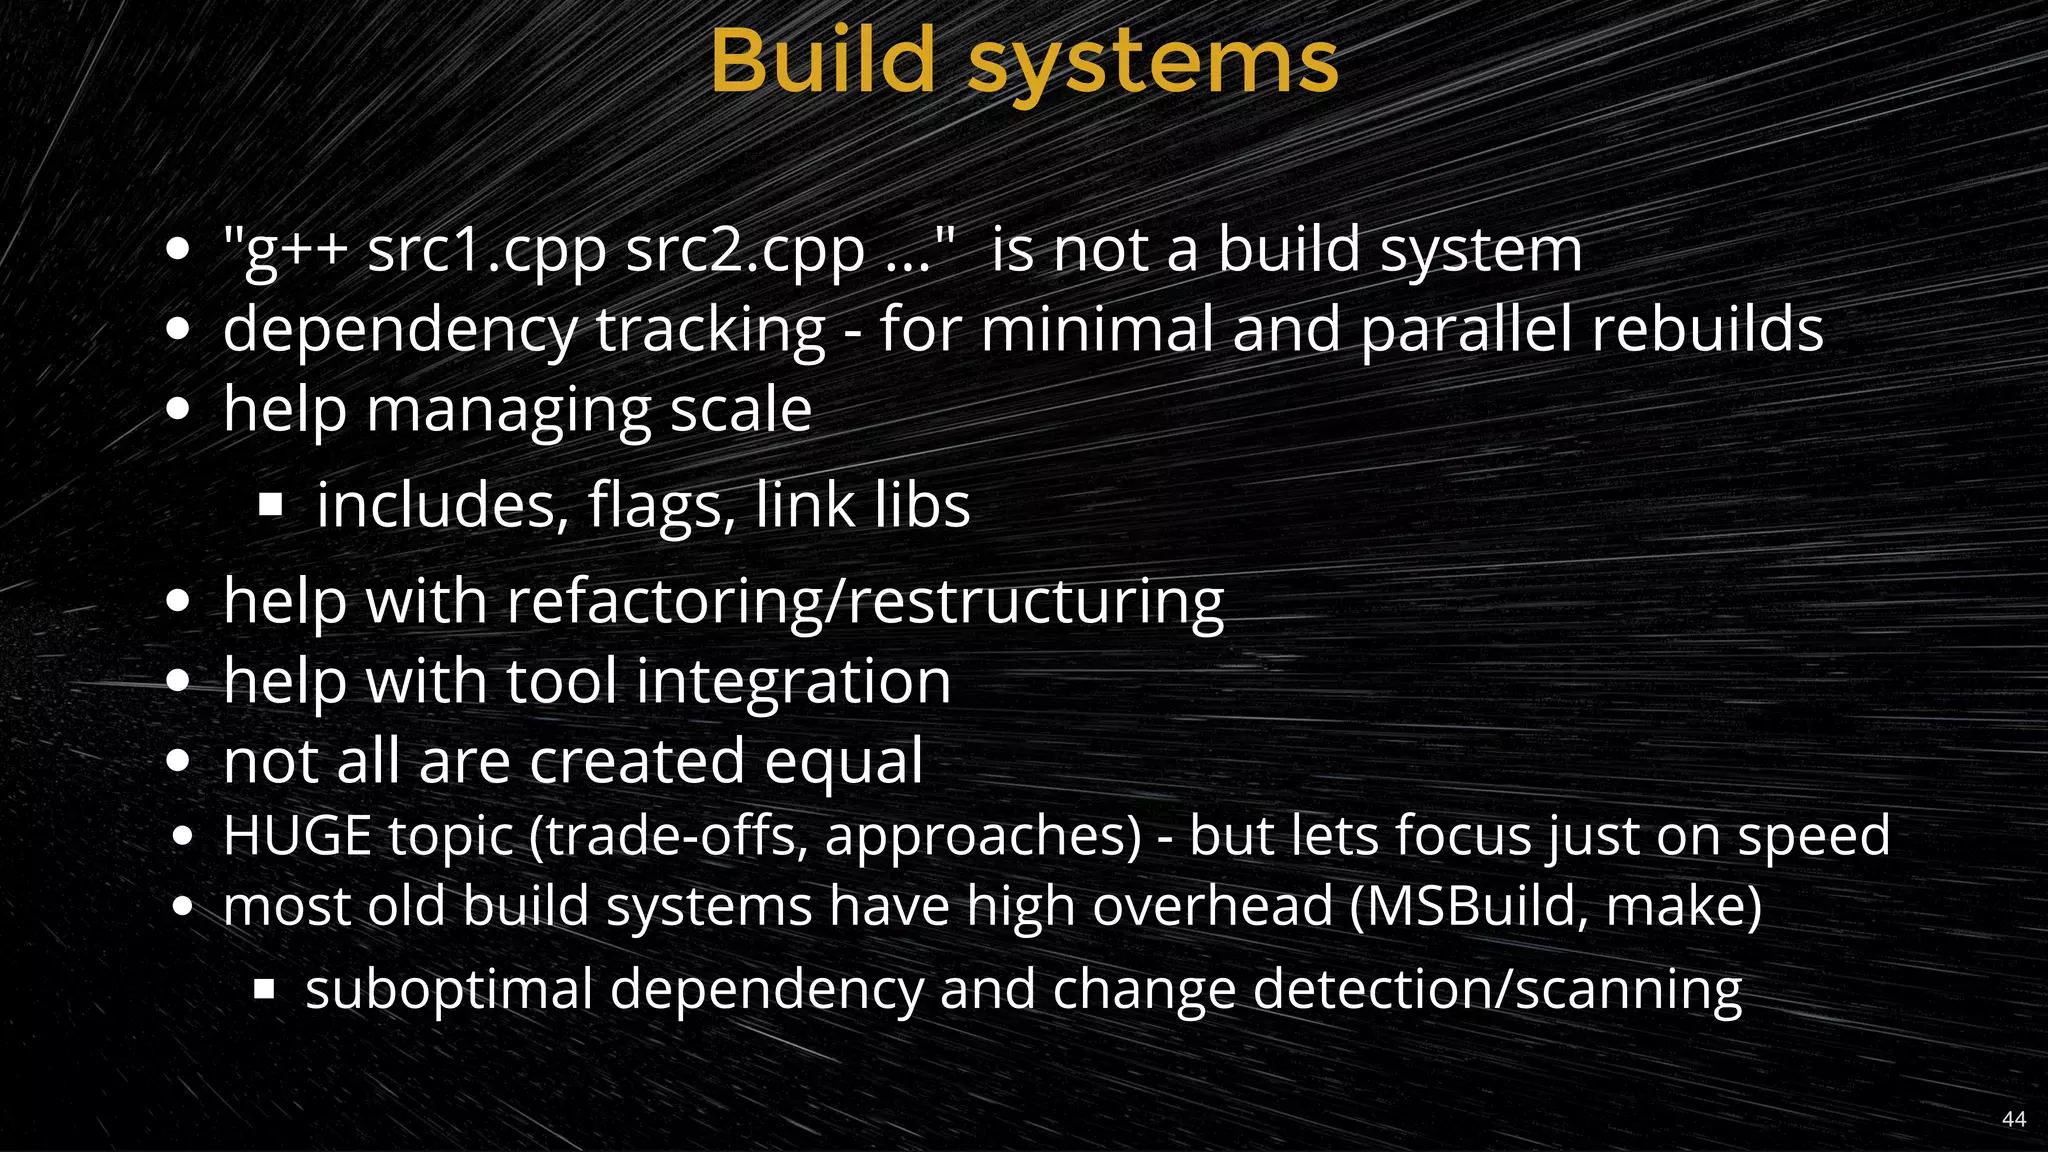
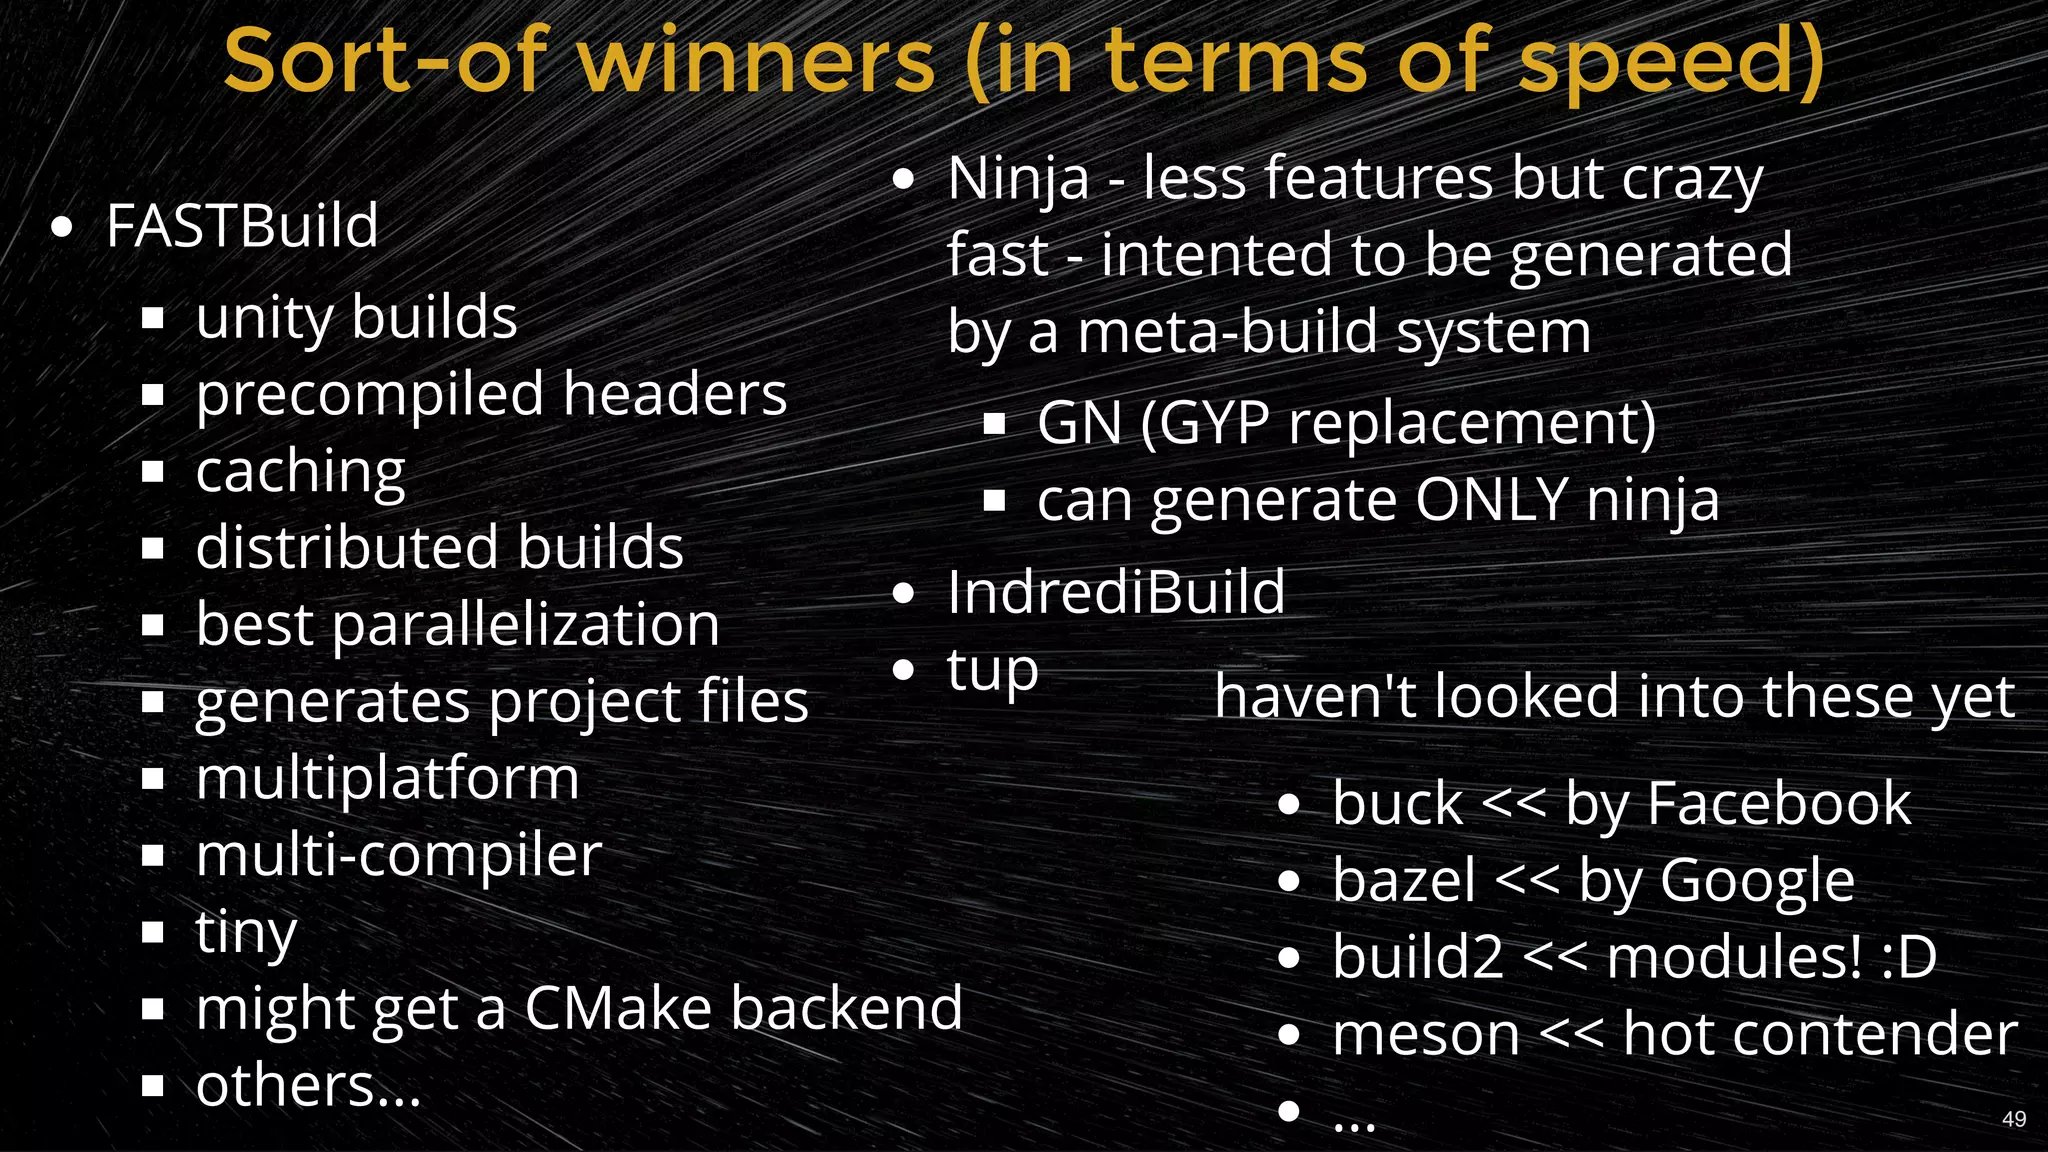
Overview of various build systems and their trade-offs, with a focus on compile speed.
Best practices and tools for achieving efficient parallel builds in C++ projects.
Strategies for increasing performance through static vs dynamic linking.
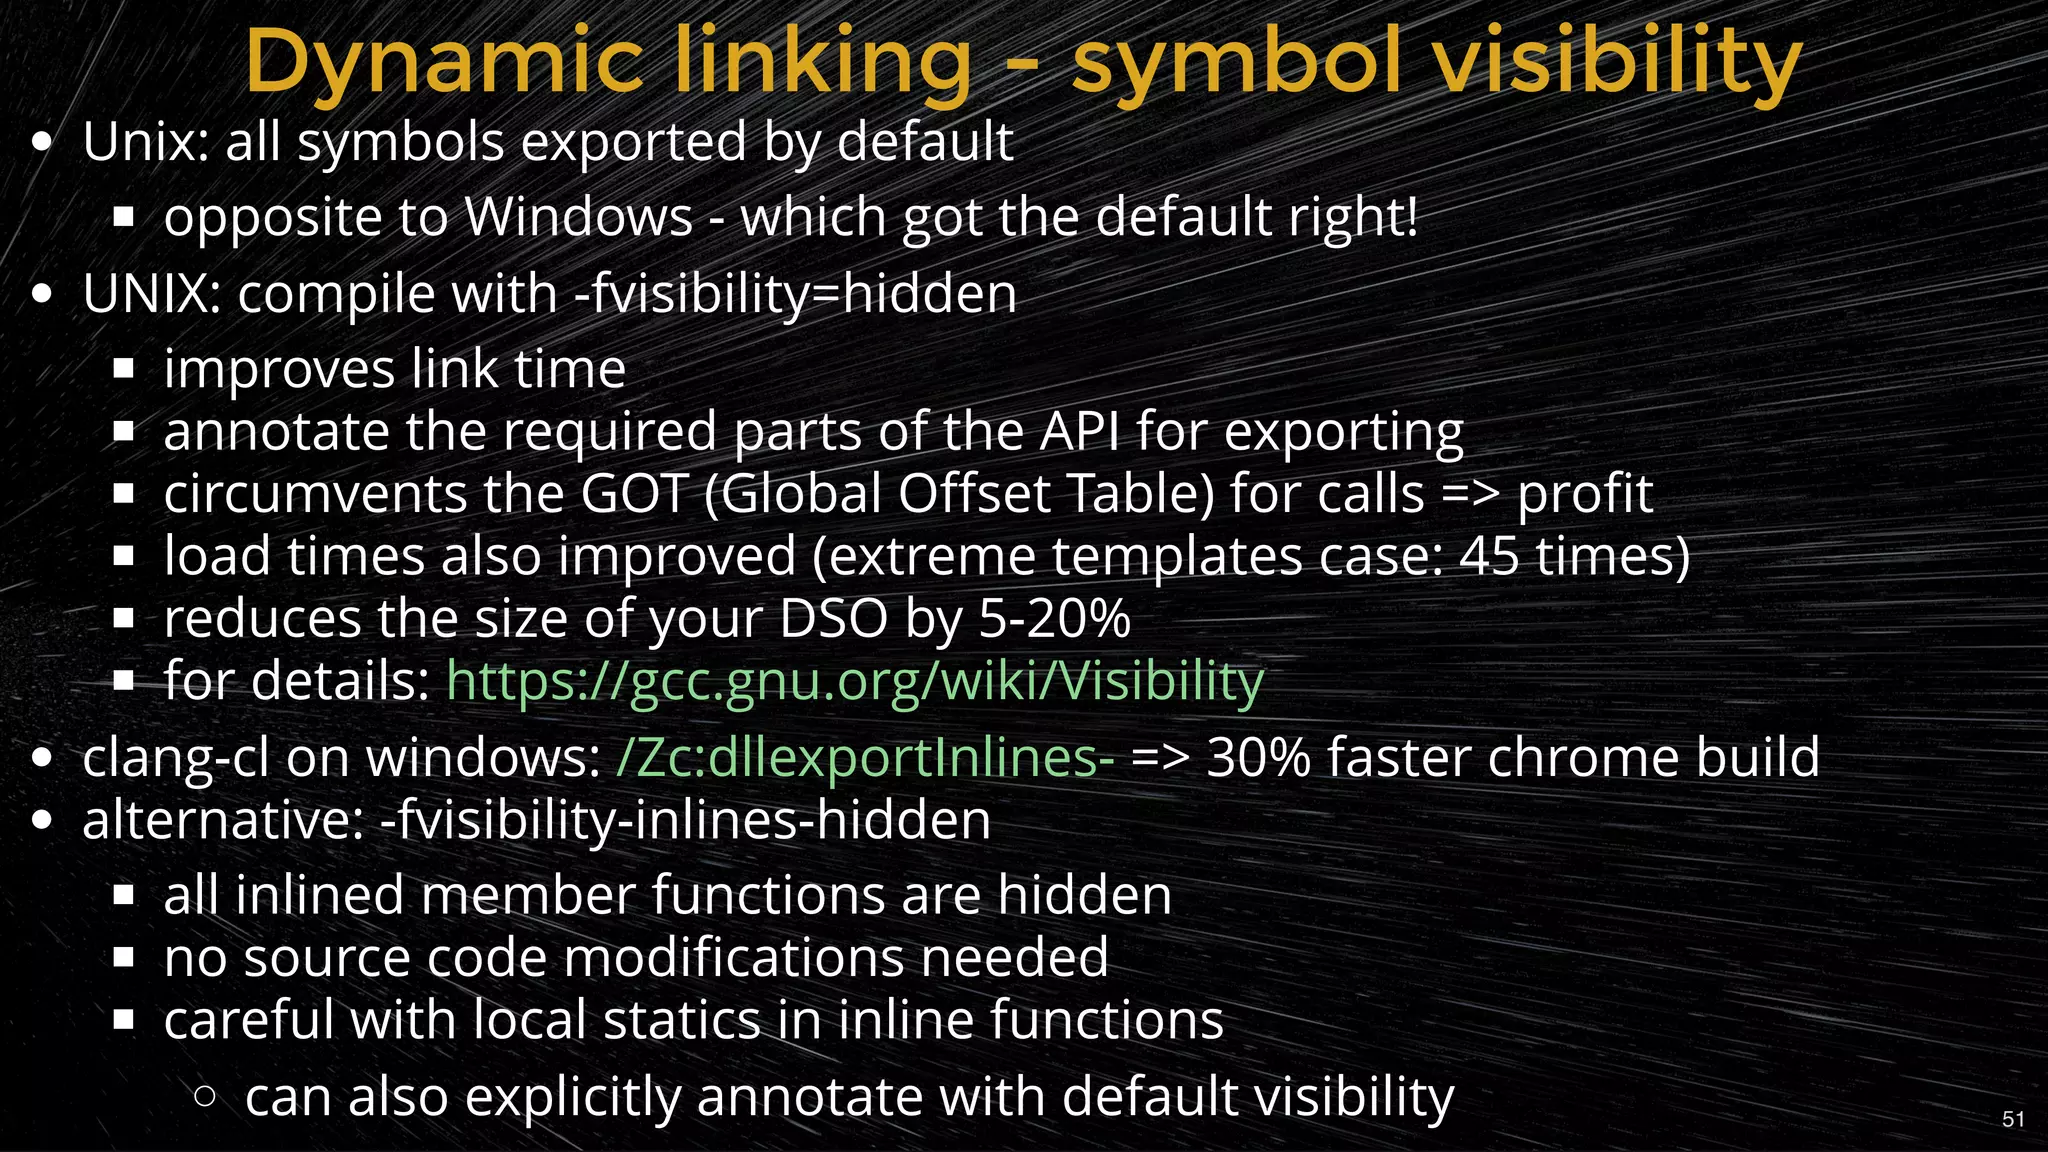
Impact of symbol visibility settings on link times and code size in dynamic libraries.
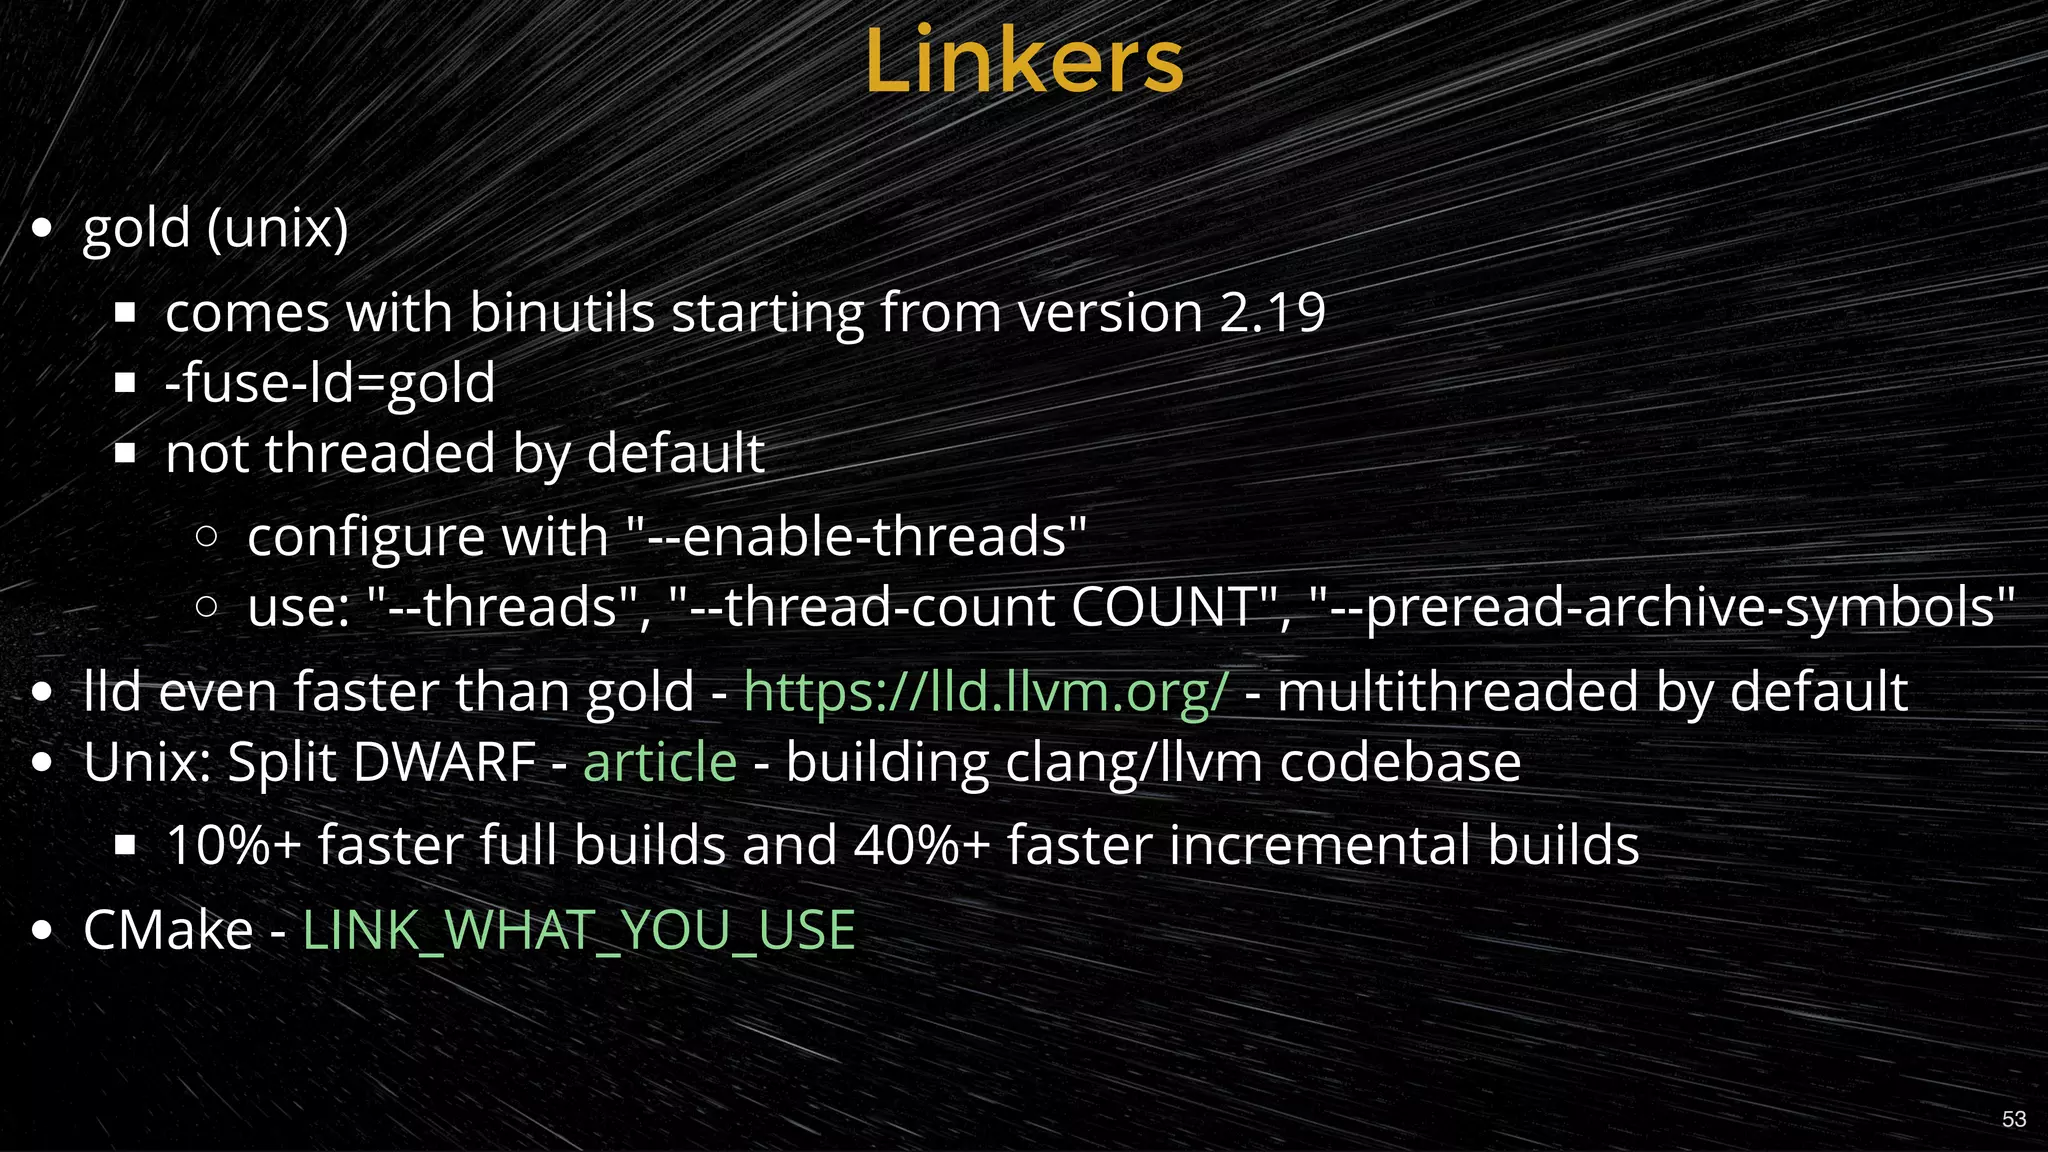
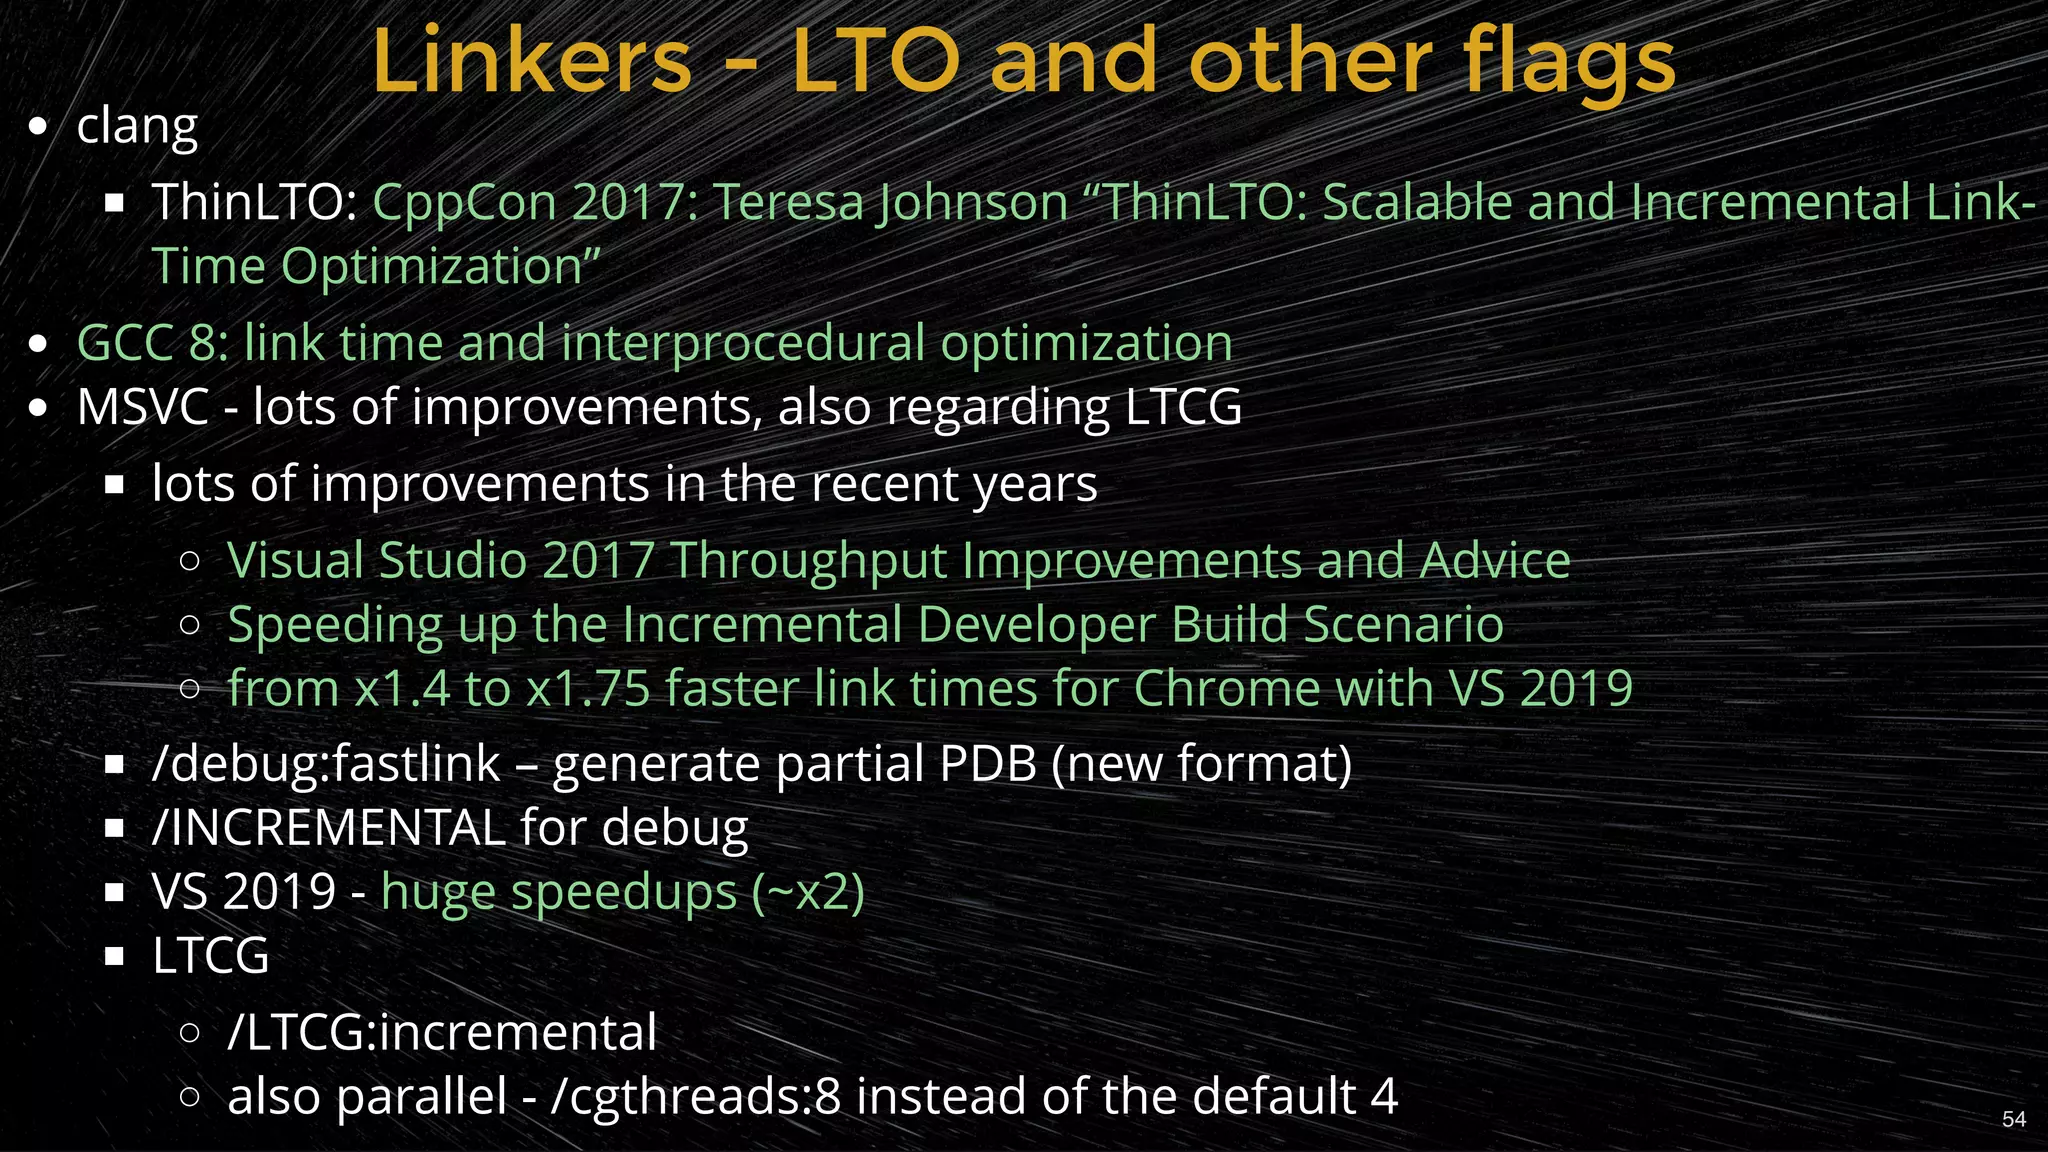
Modern linker techniques like LTO to enhance build performance.
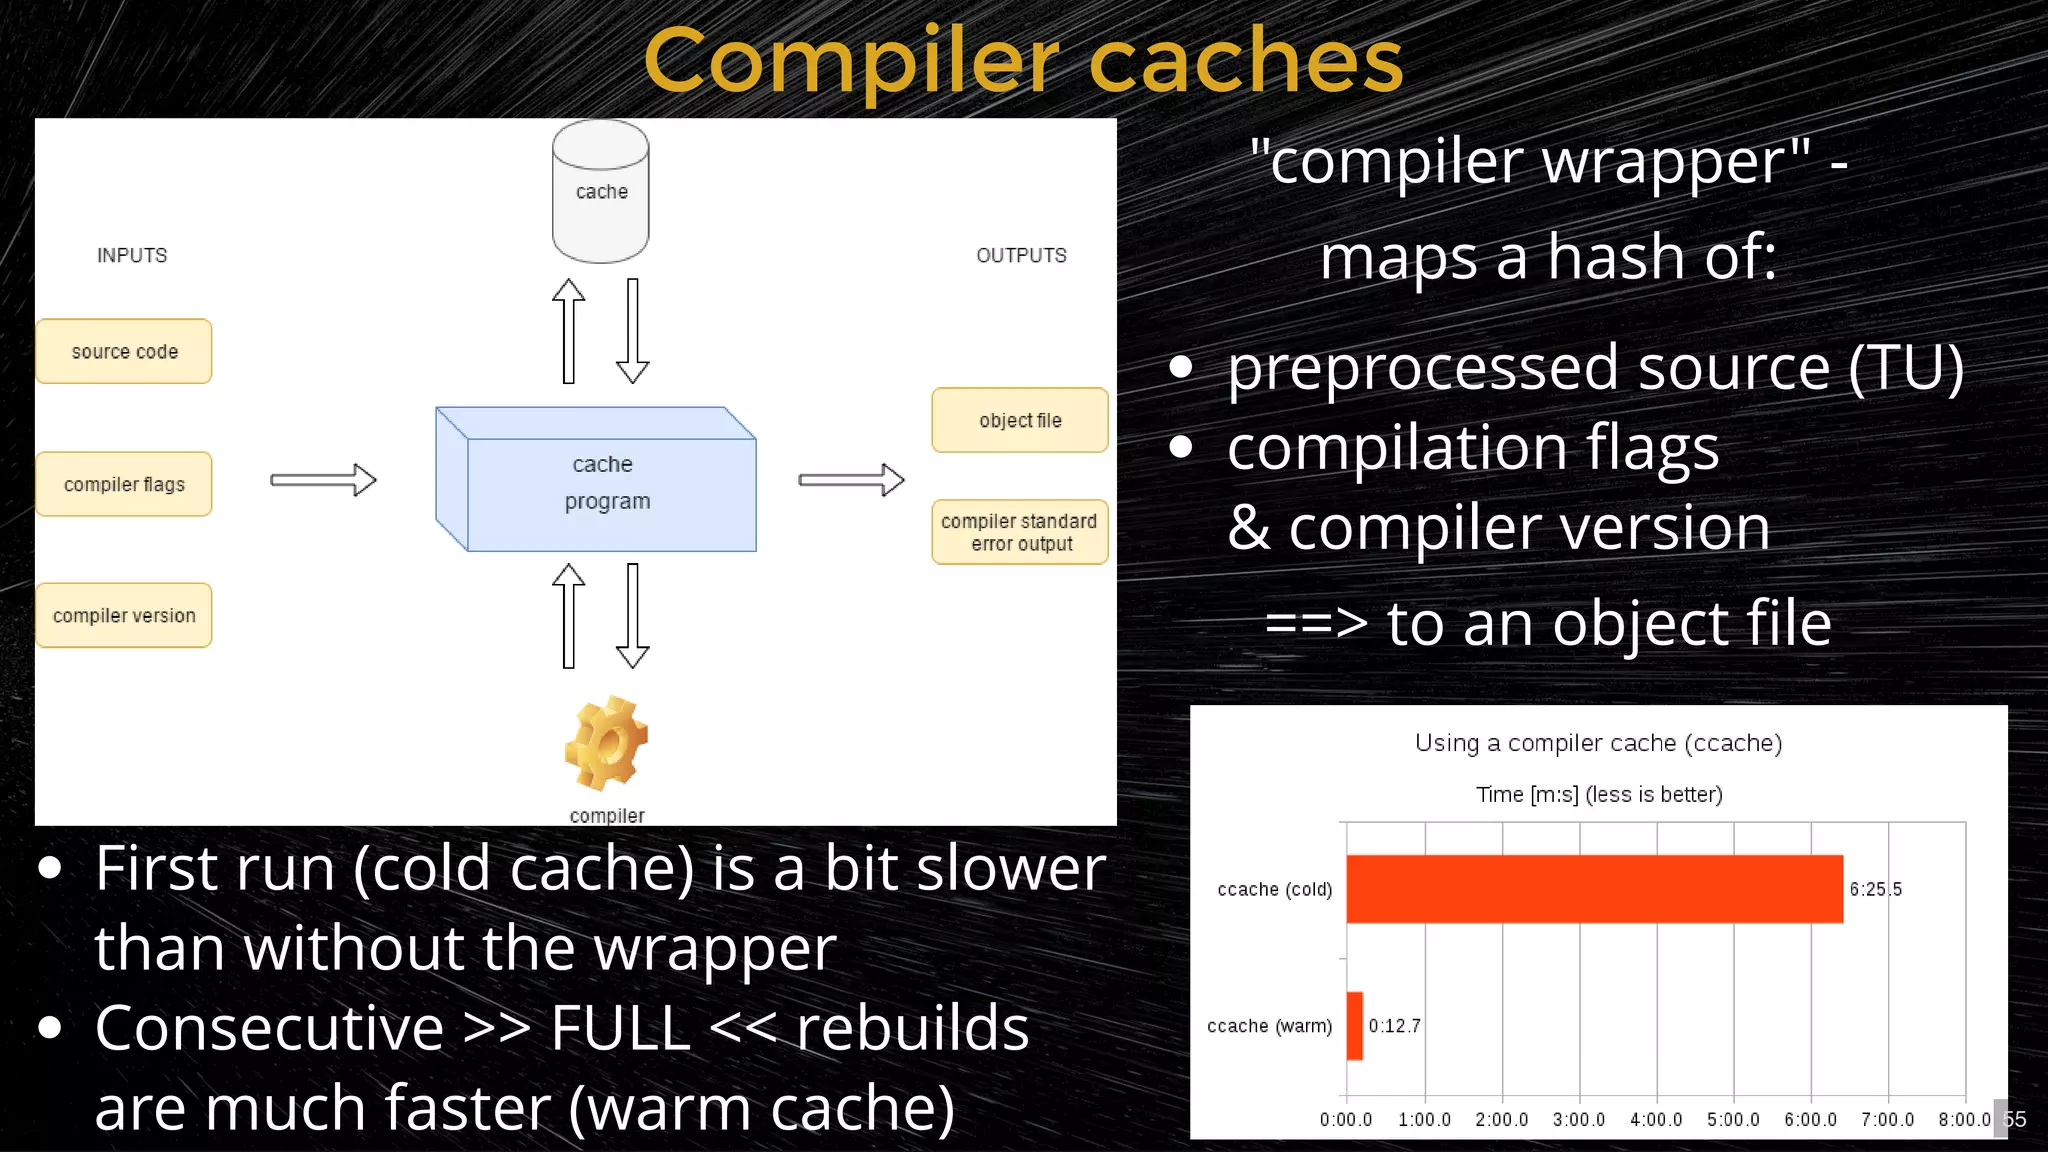
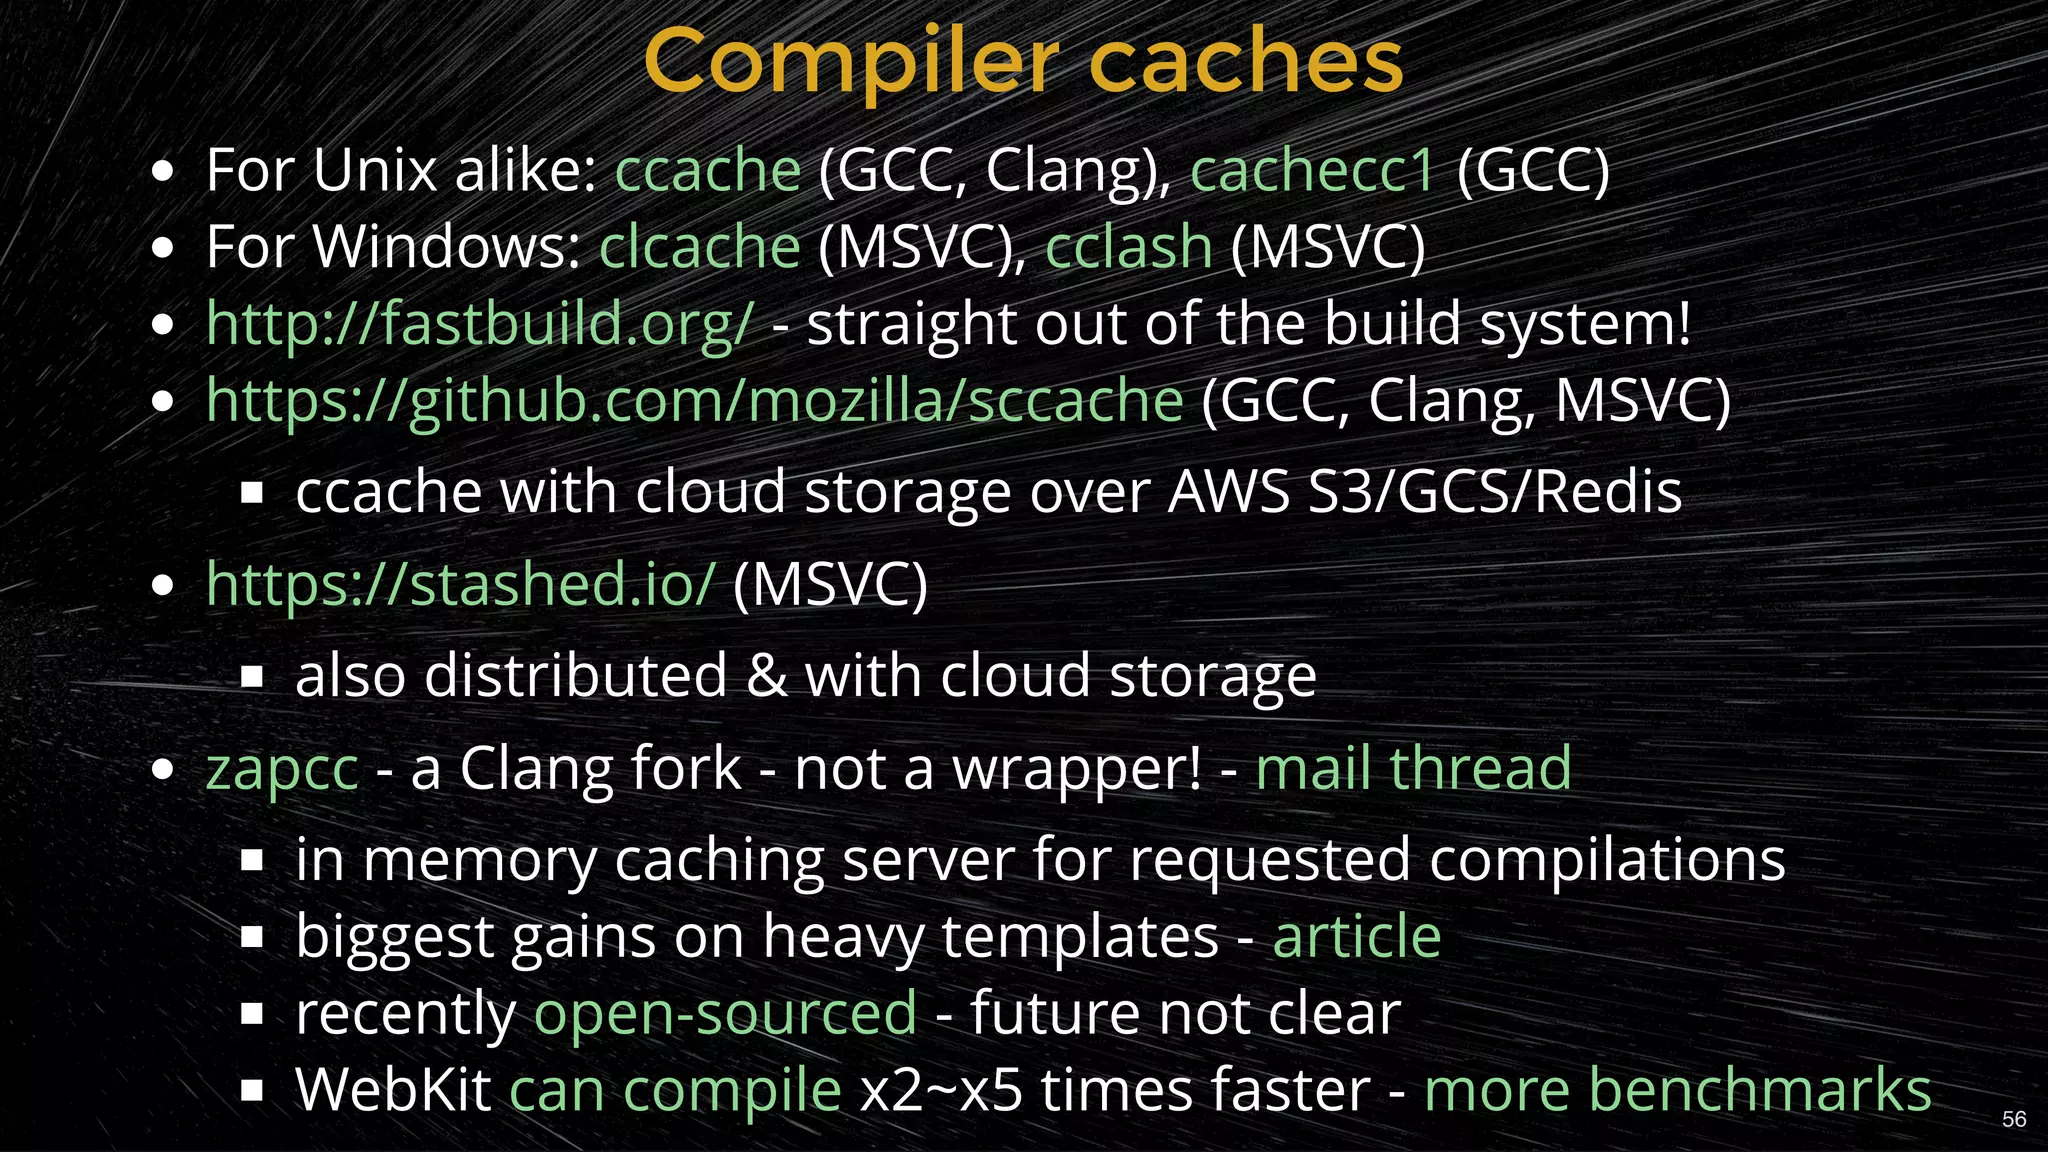
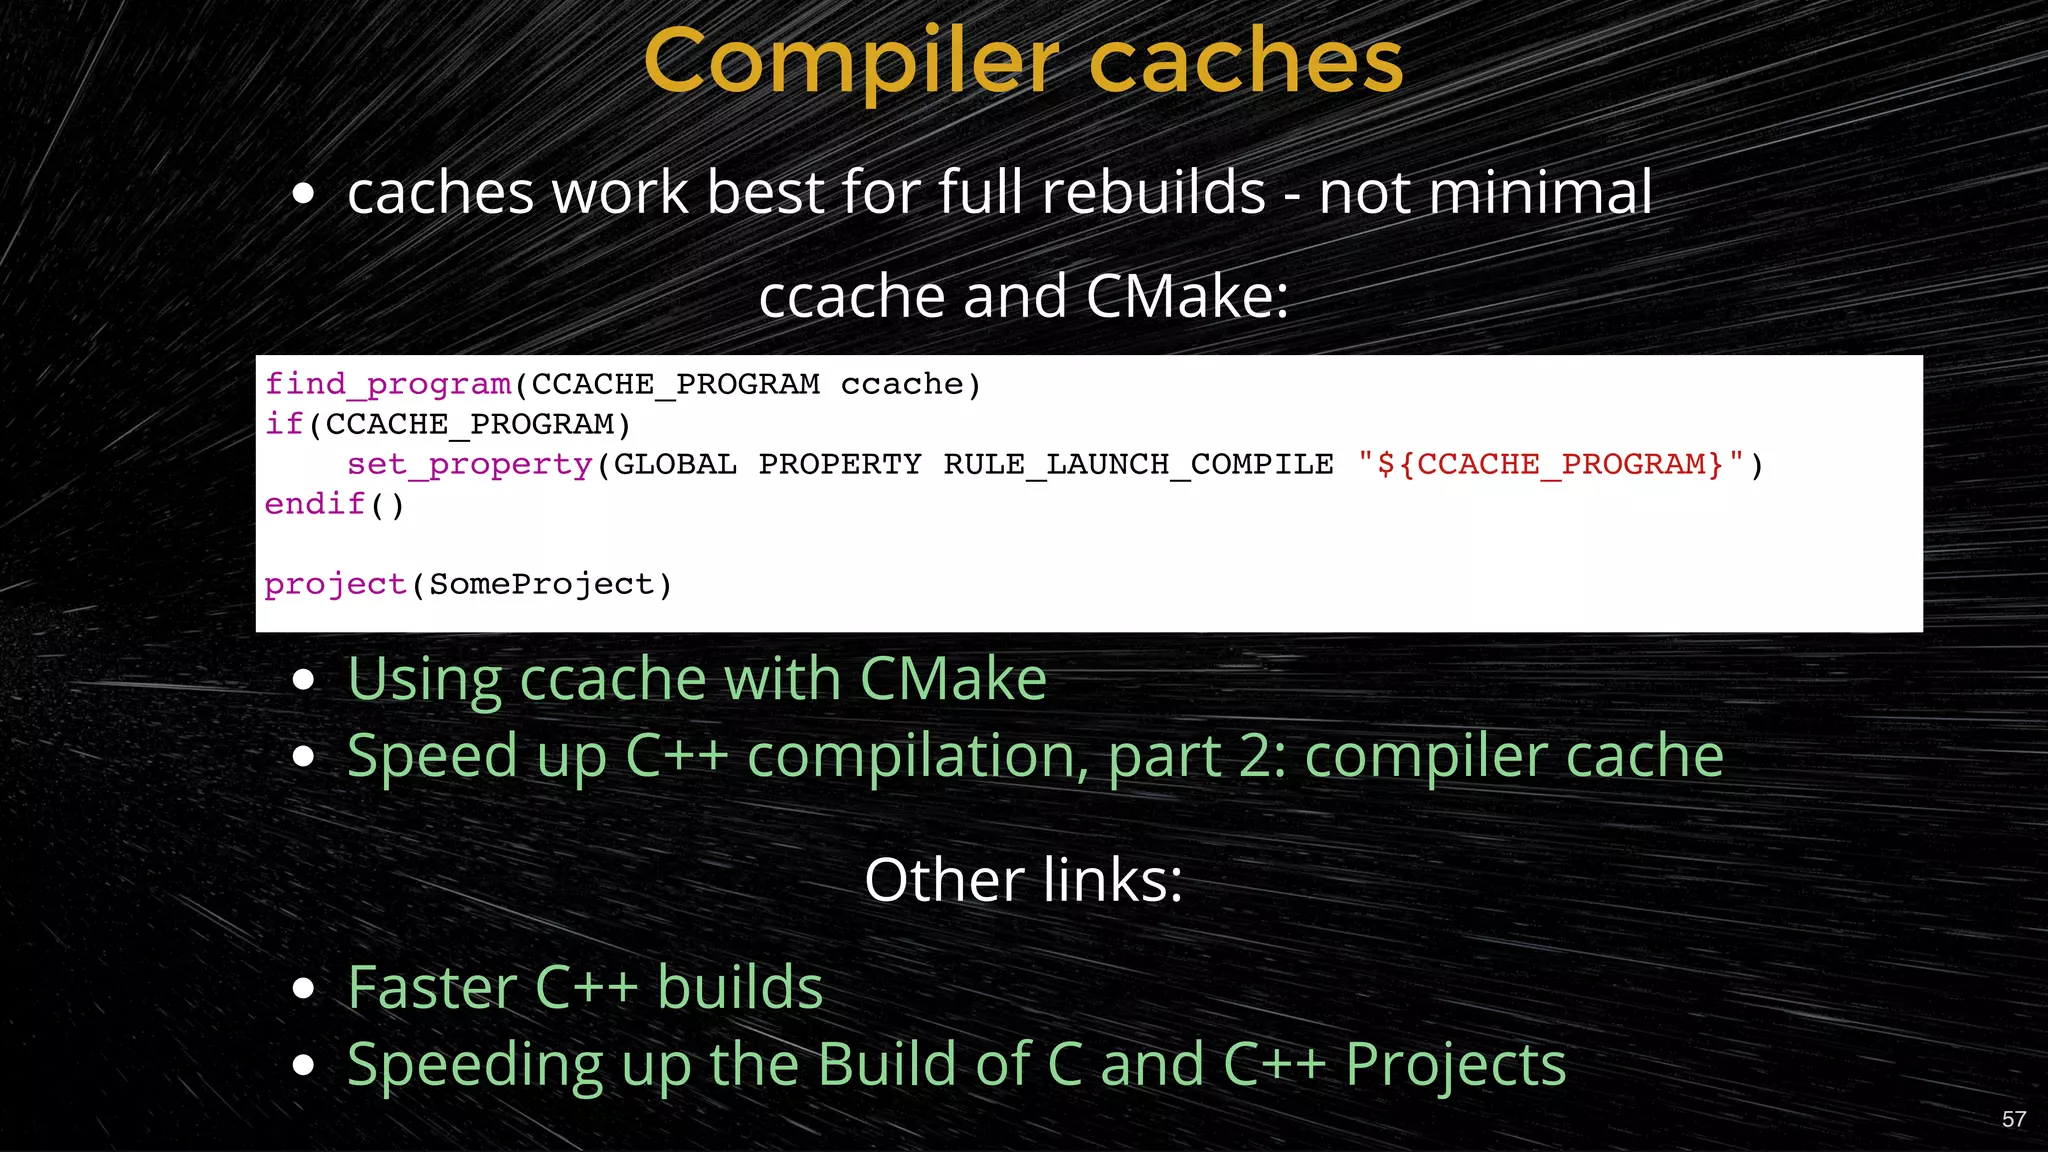
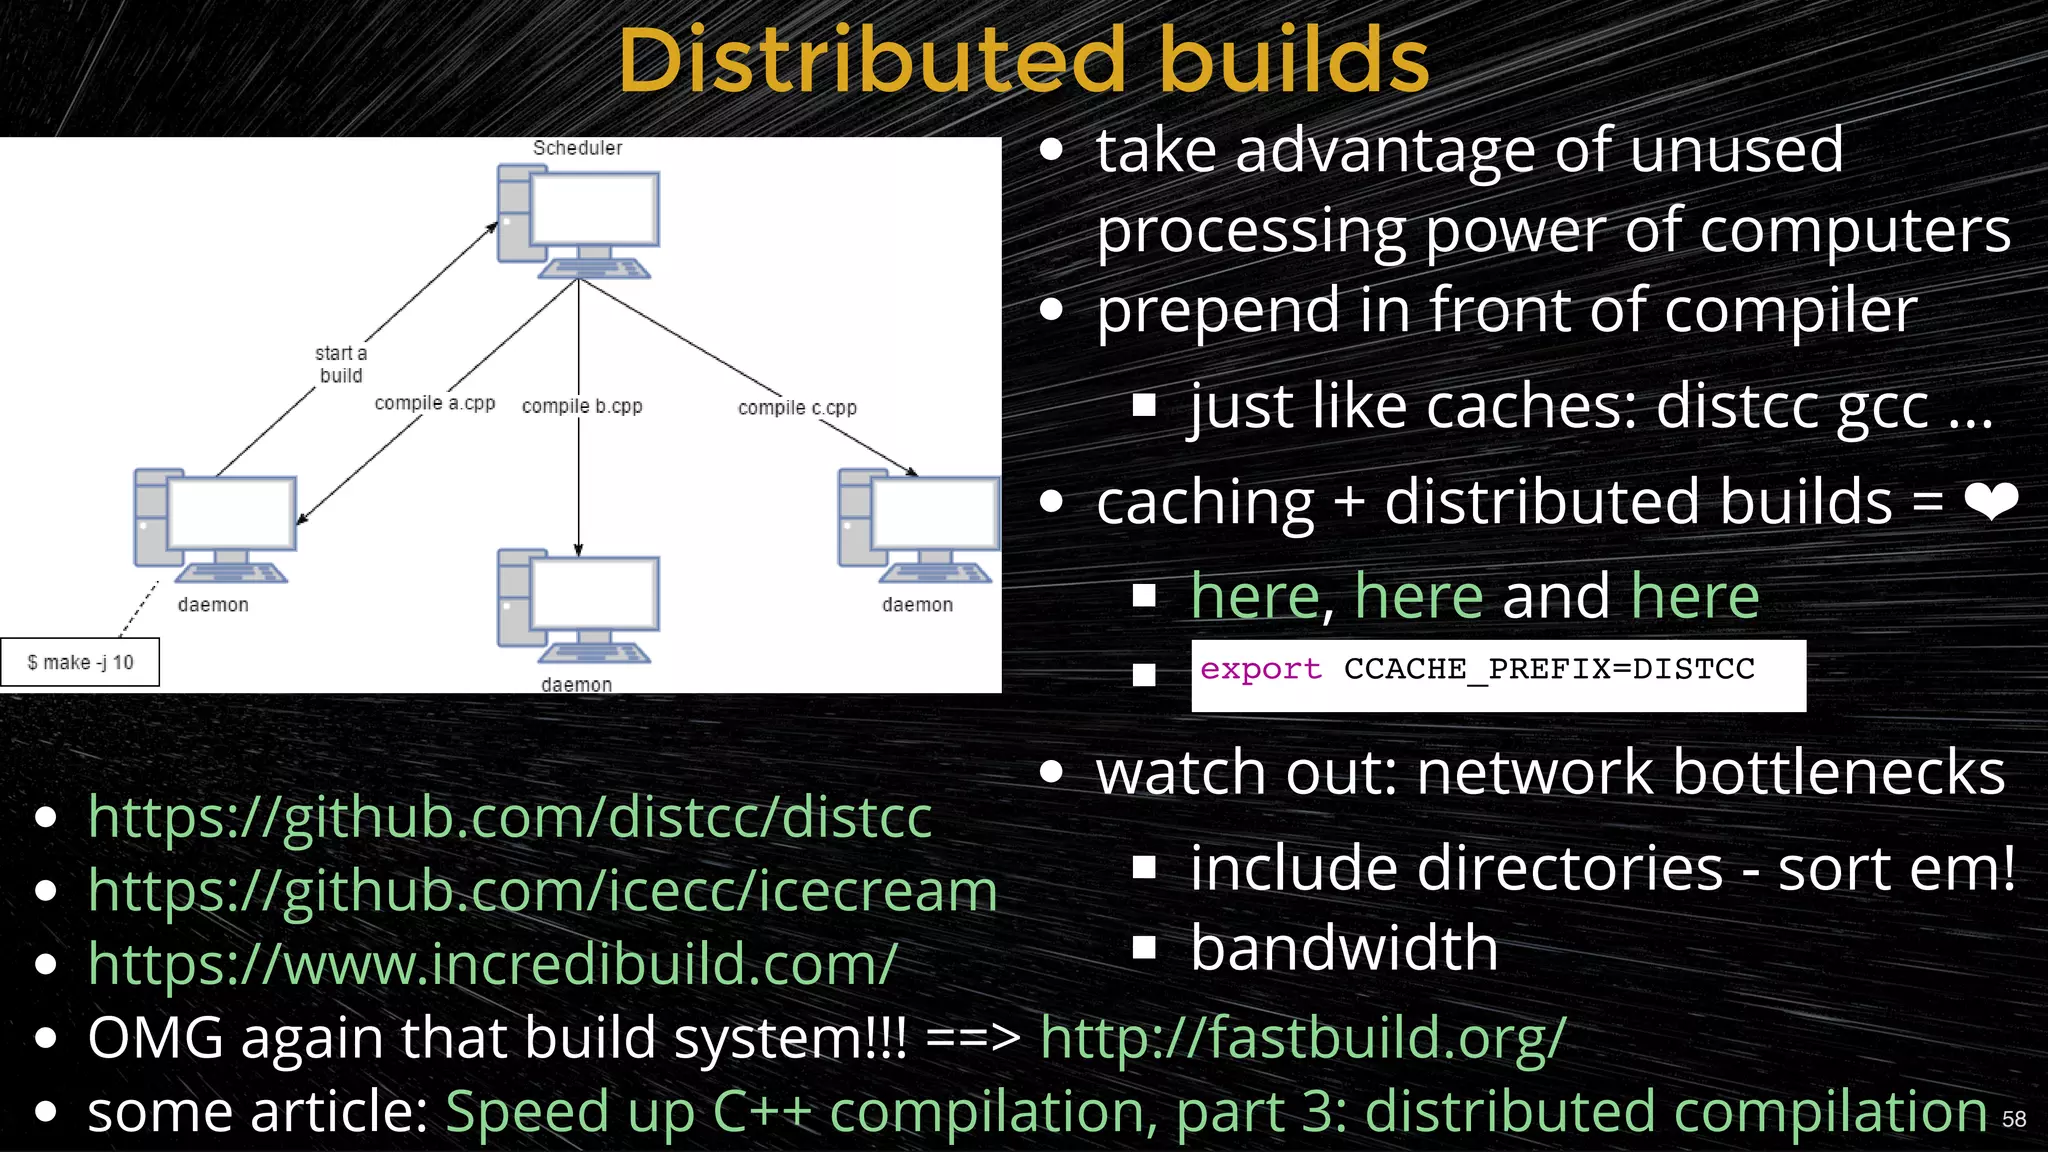
Using caching and distributed builds to enhance compilation efficiency.
The role of hardware resources in optimizing build speeds and parallelism.
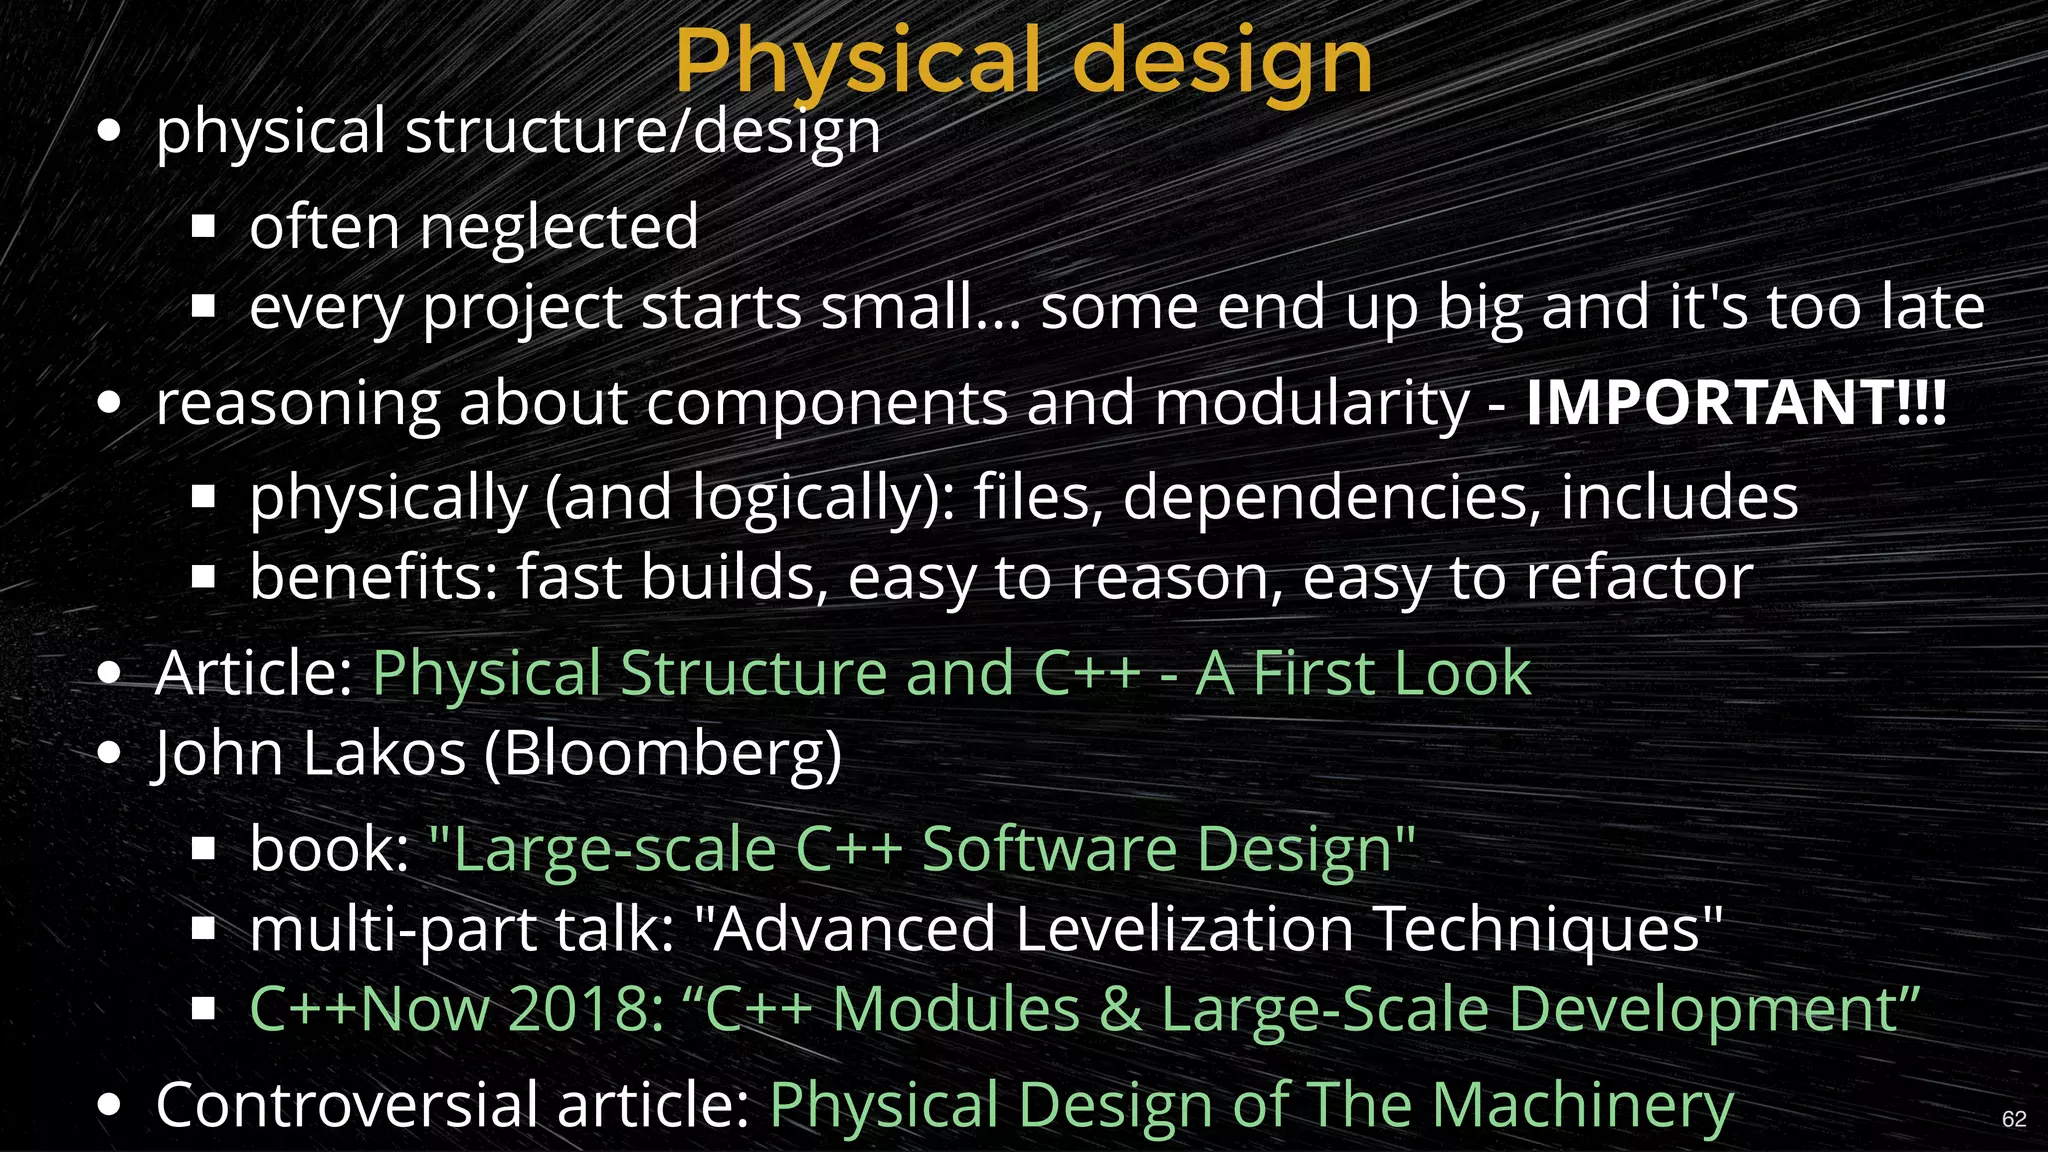
Highlights the significance of physical design and dependency management.
Tools for analyzing dependencies to enhance build efficiency.
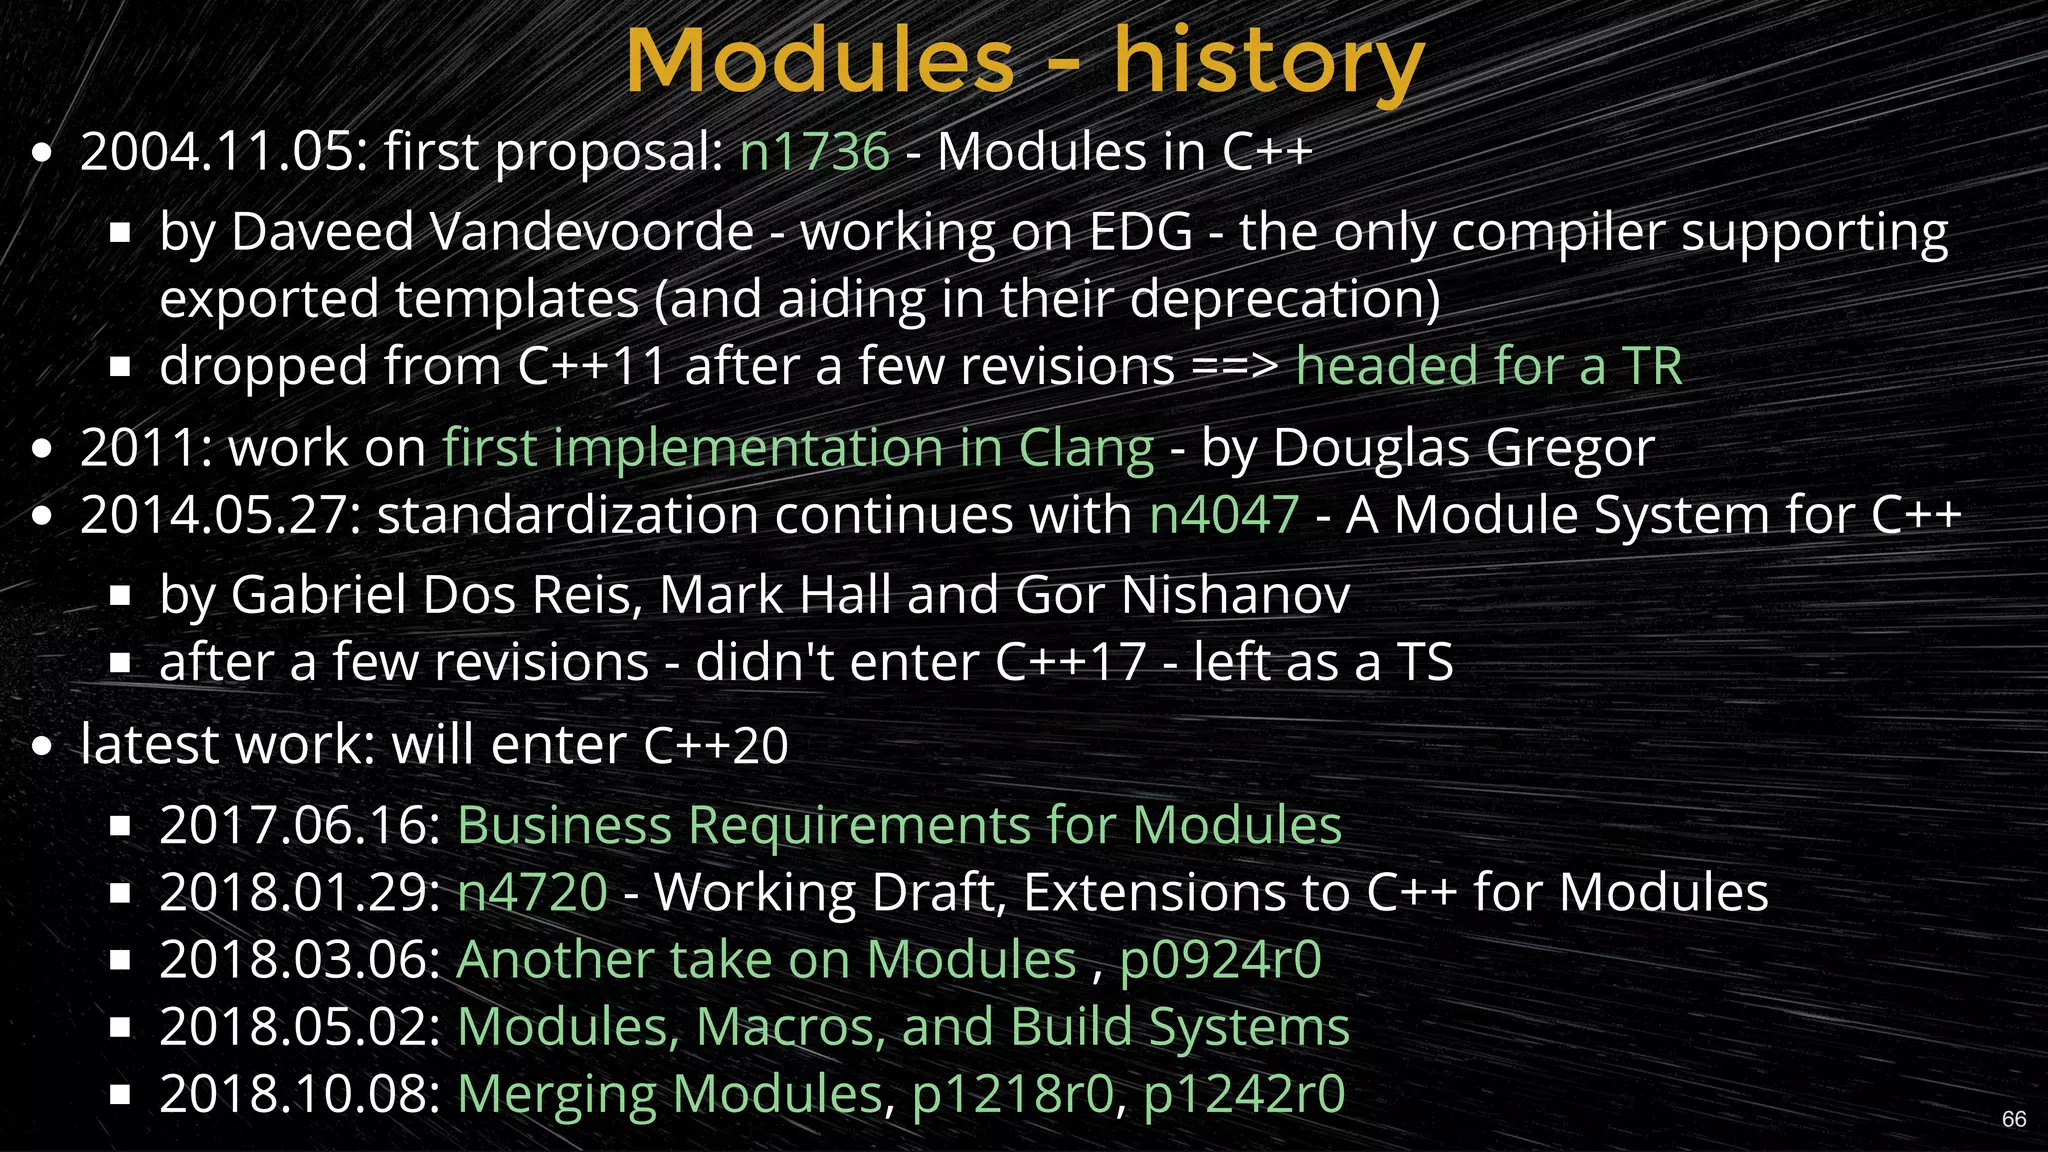
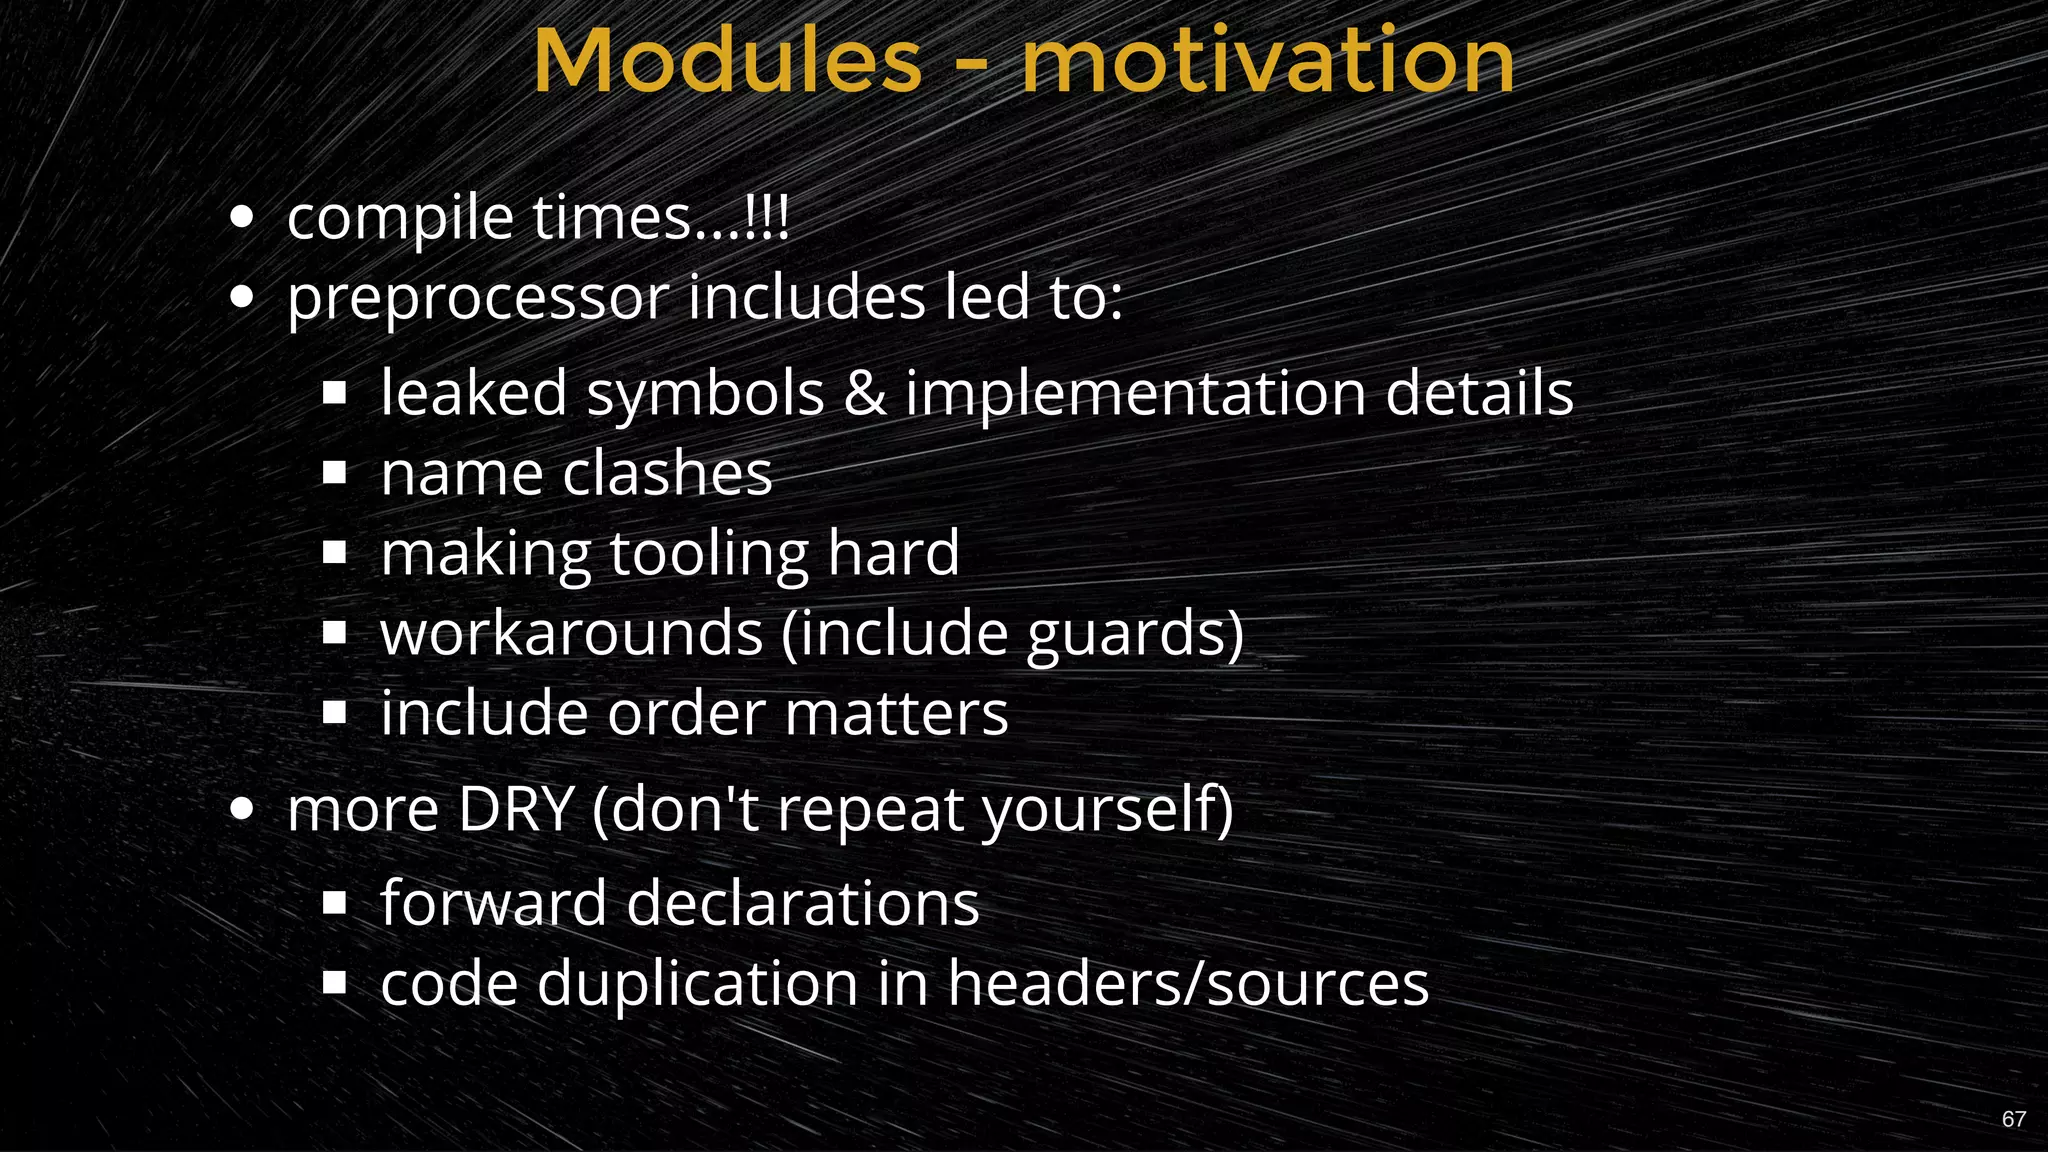
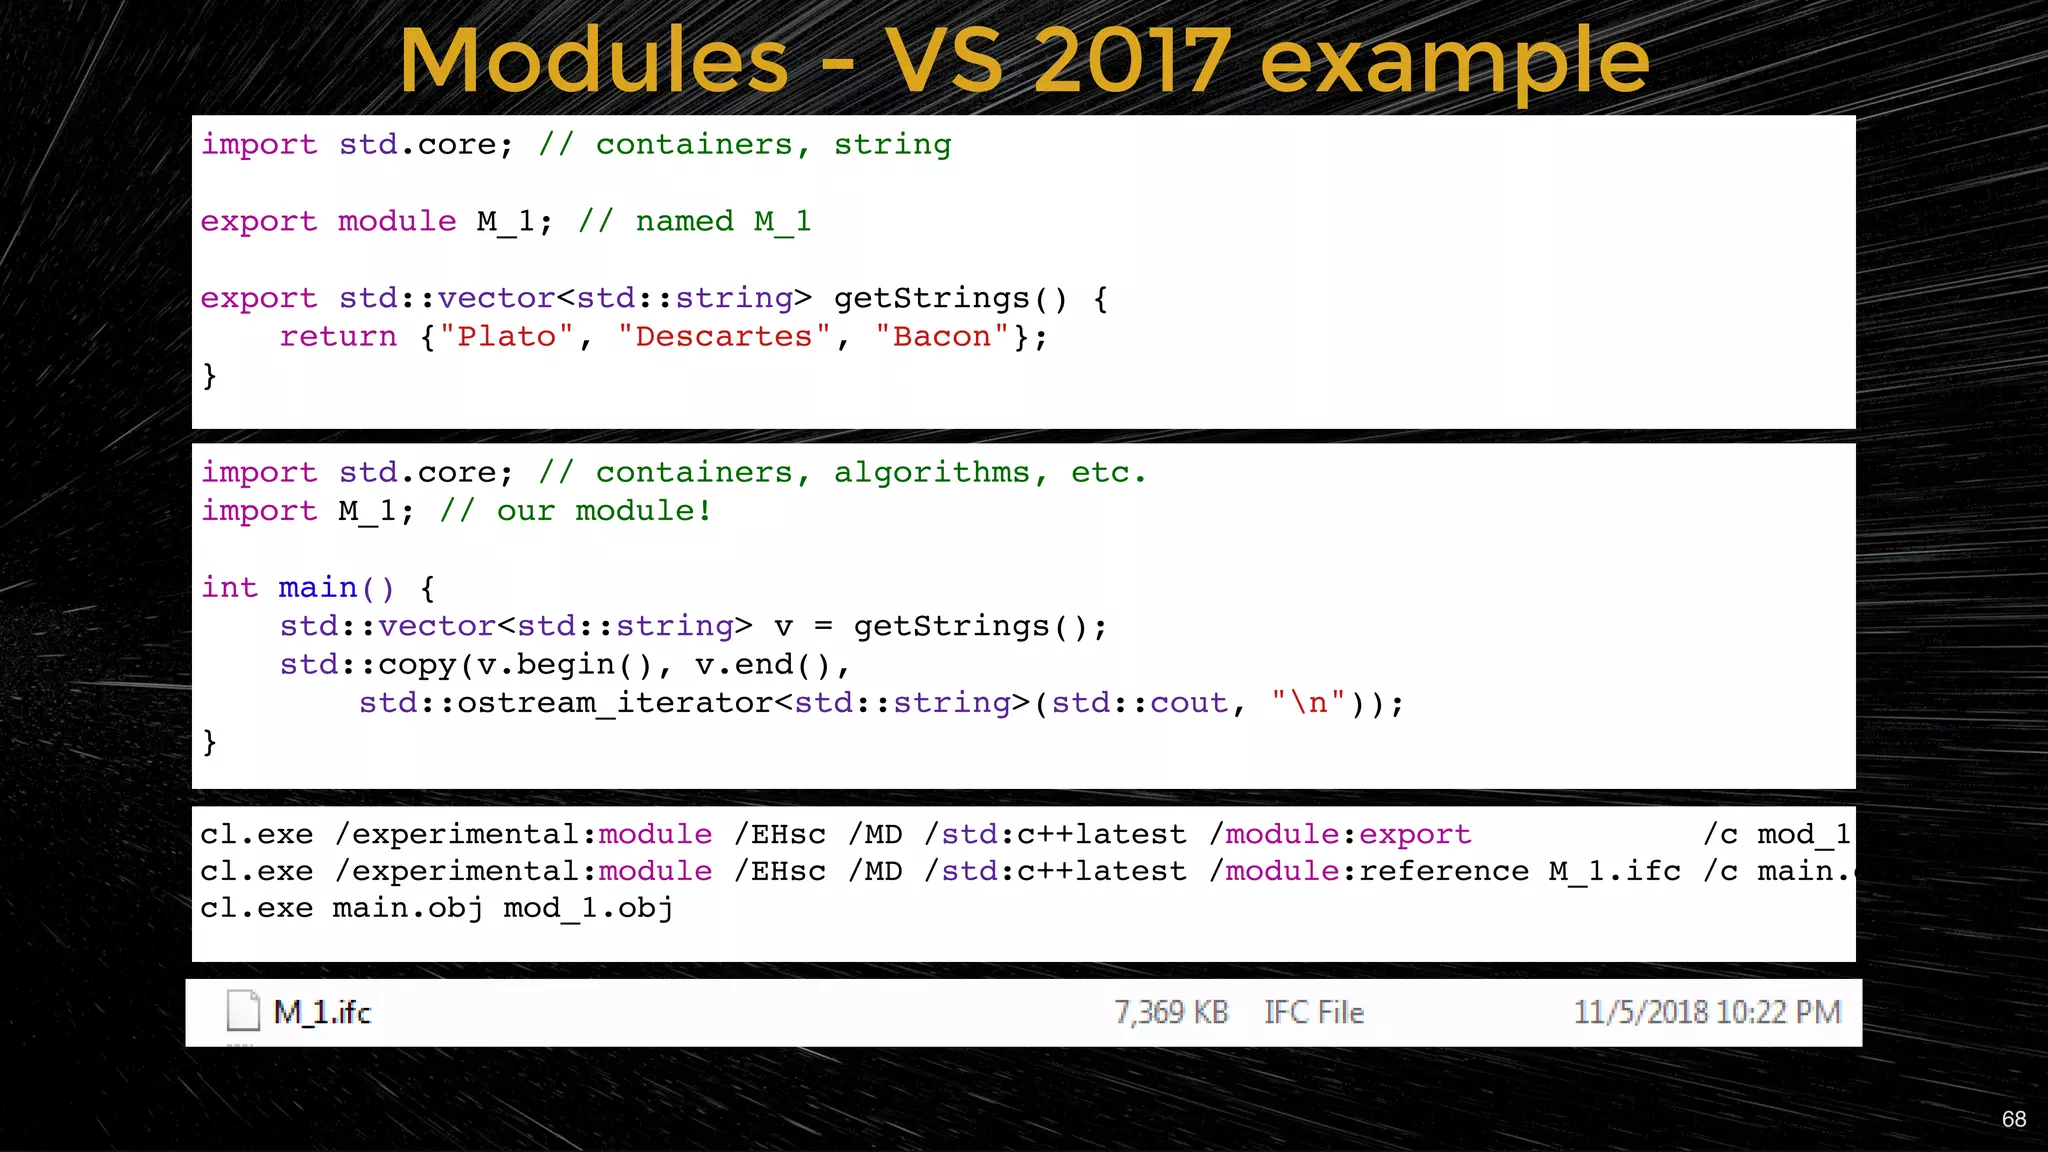
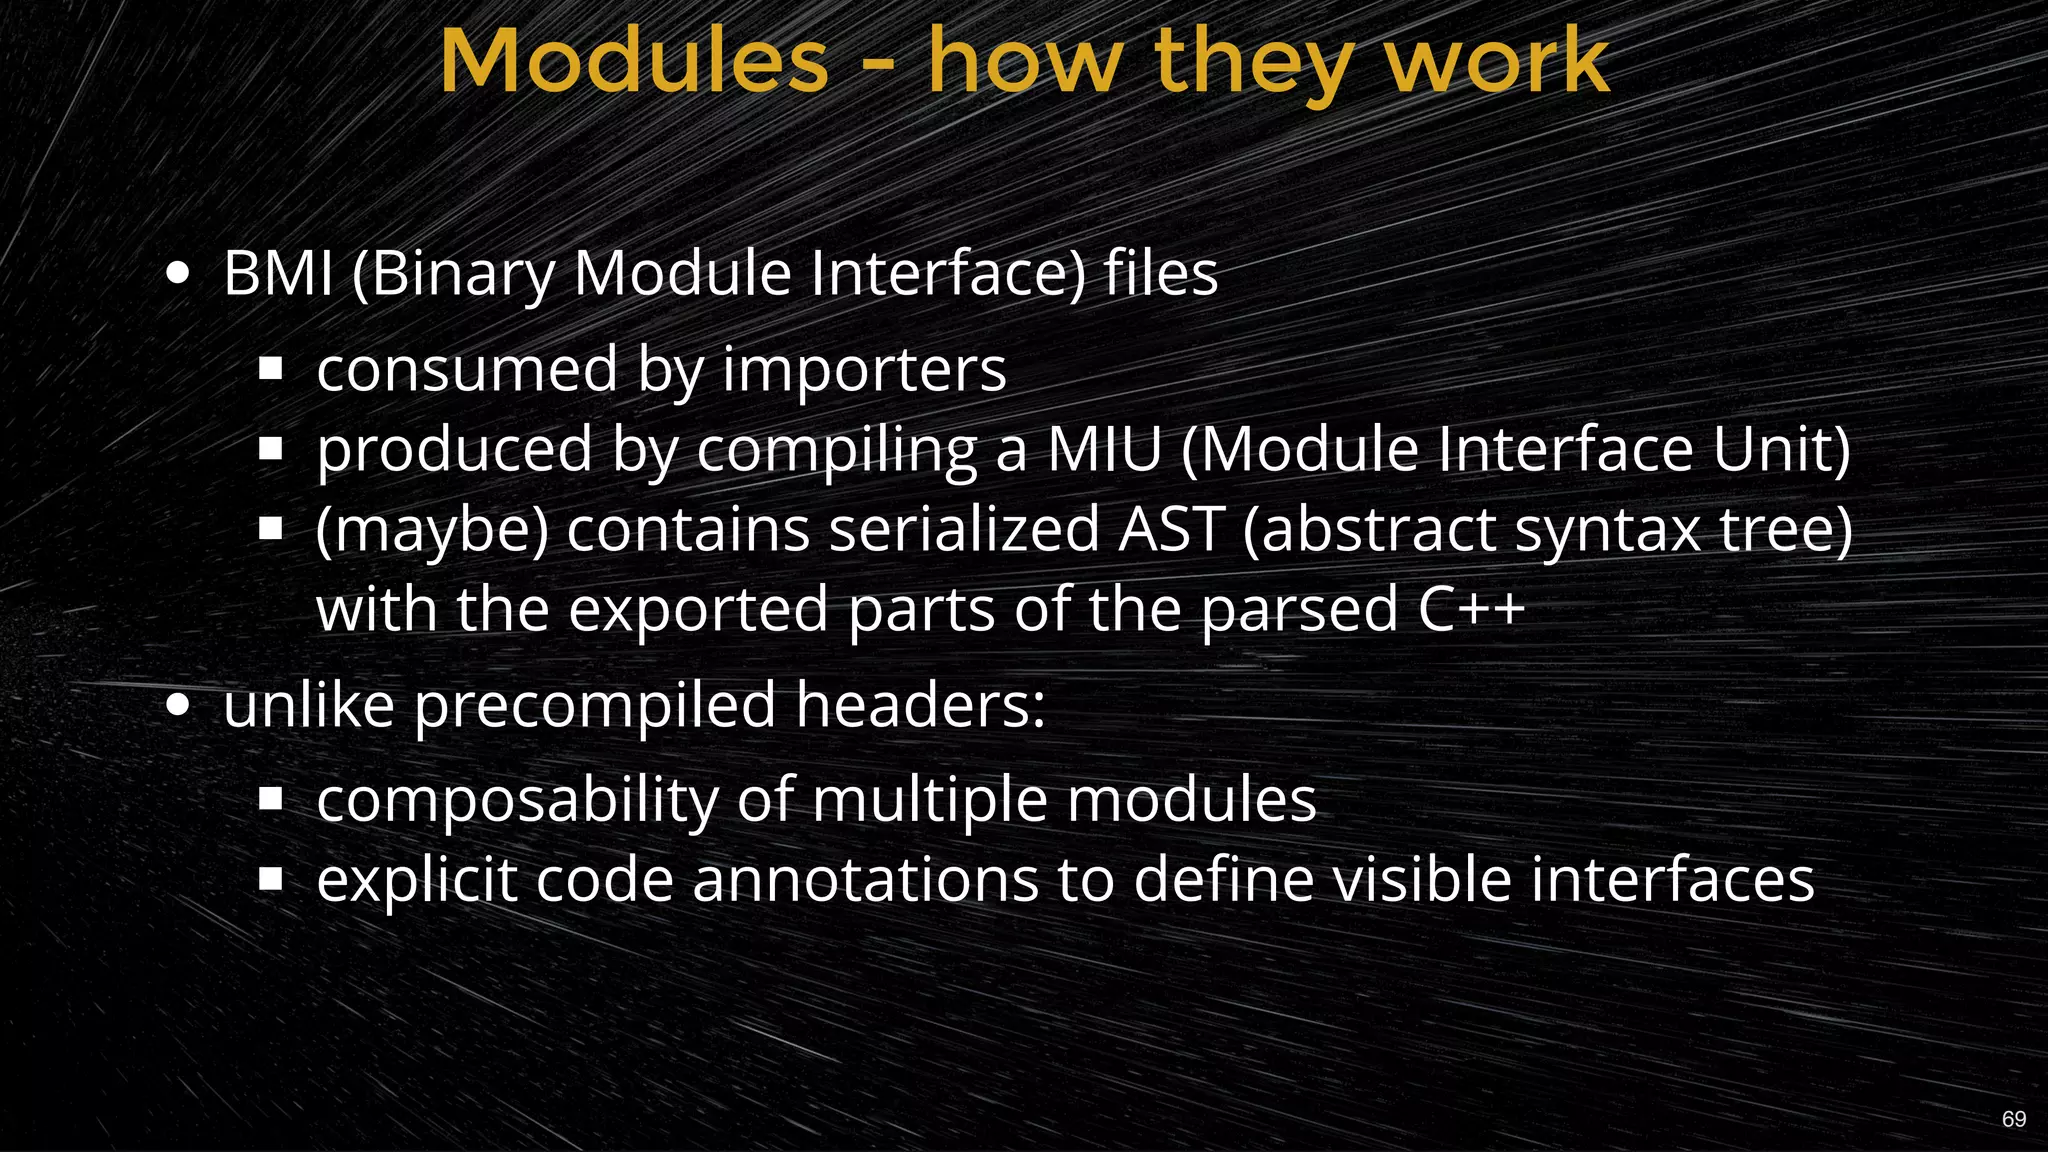
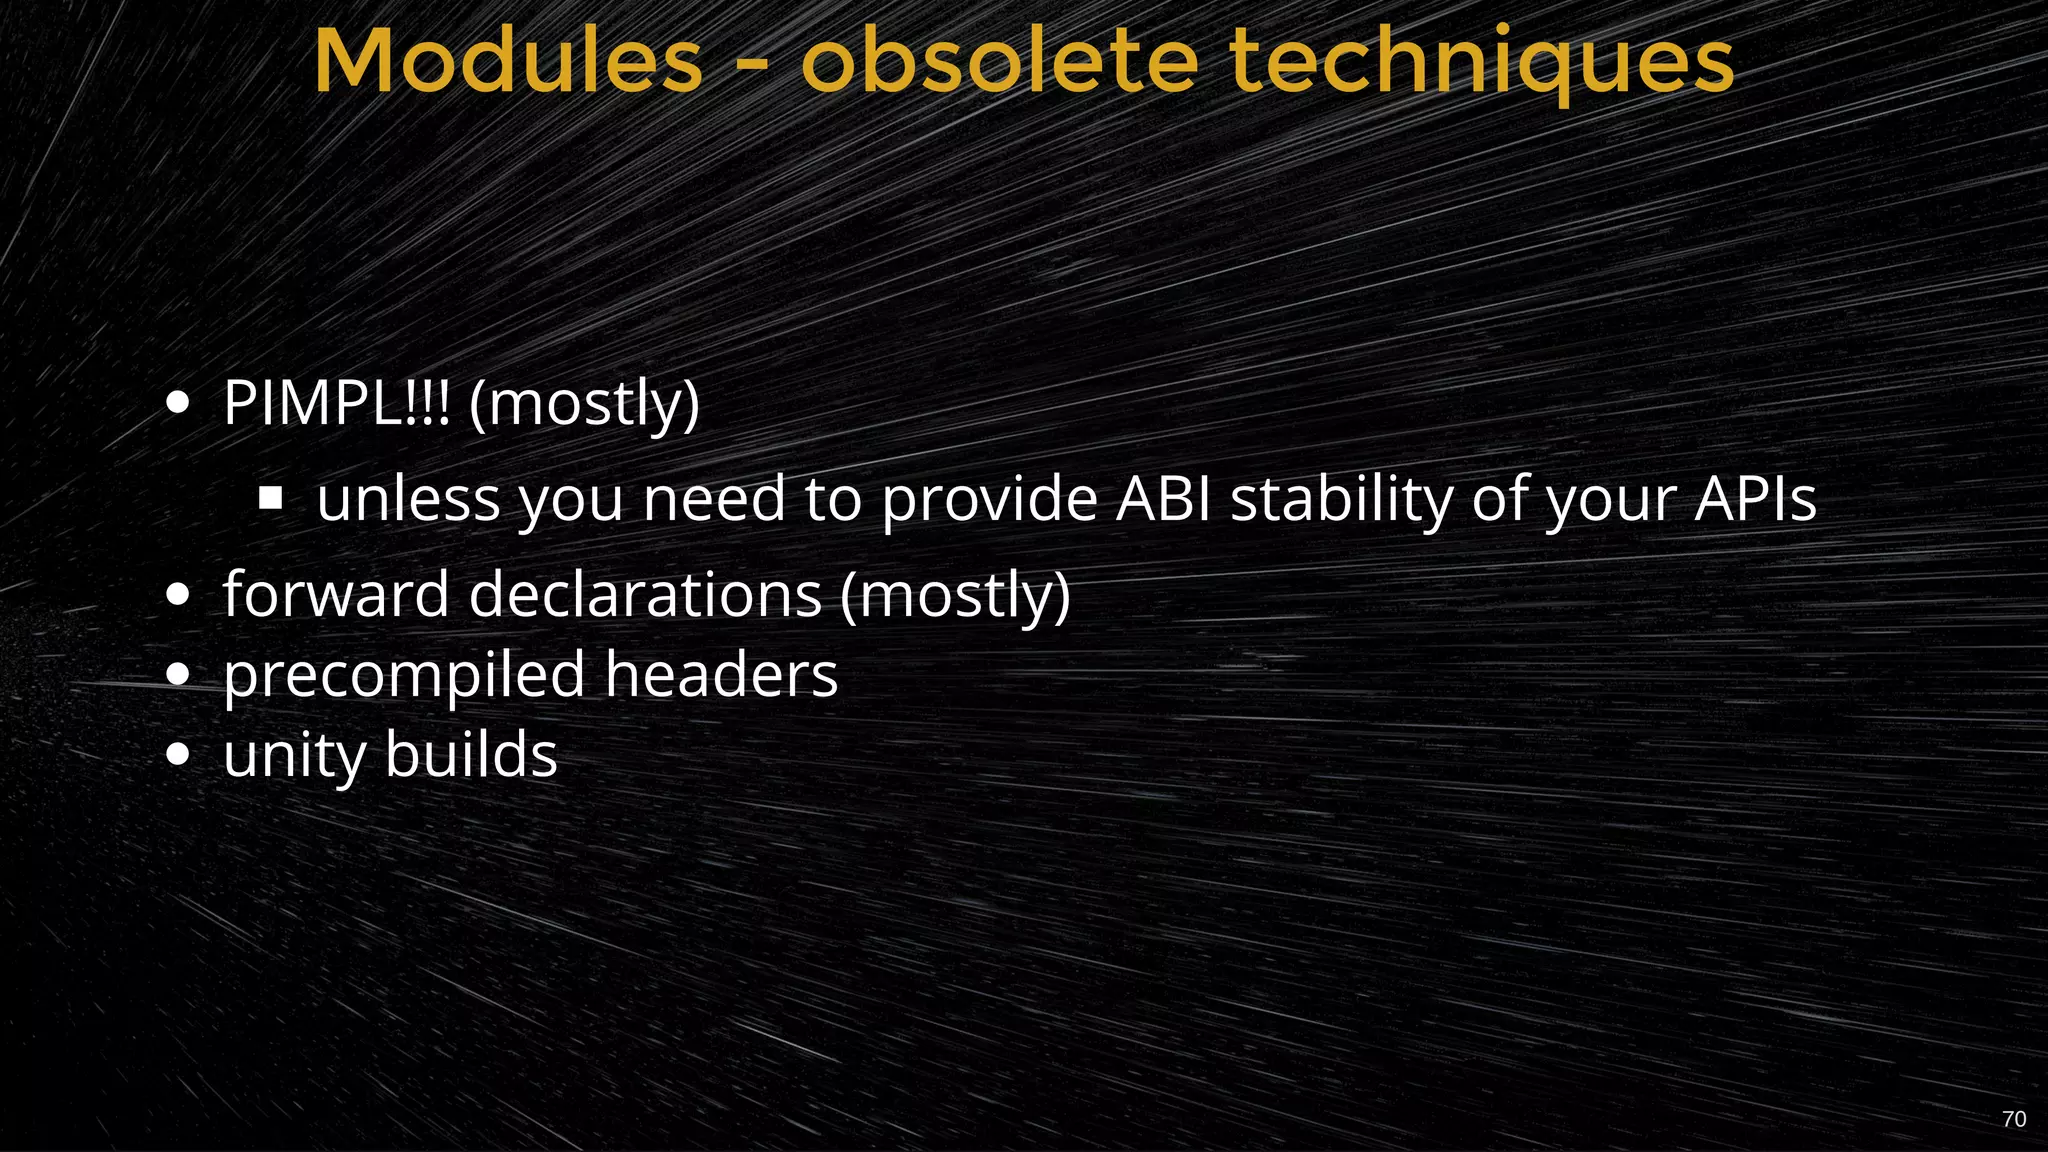
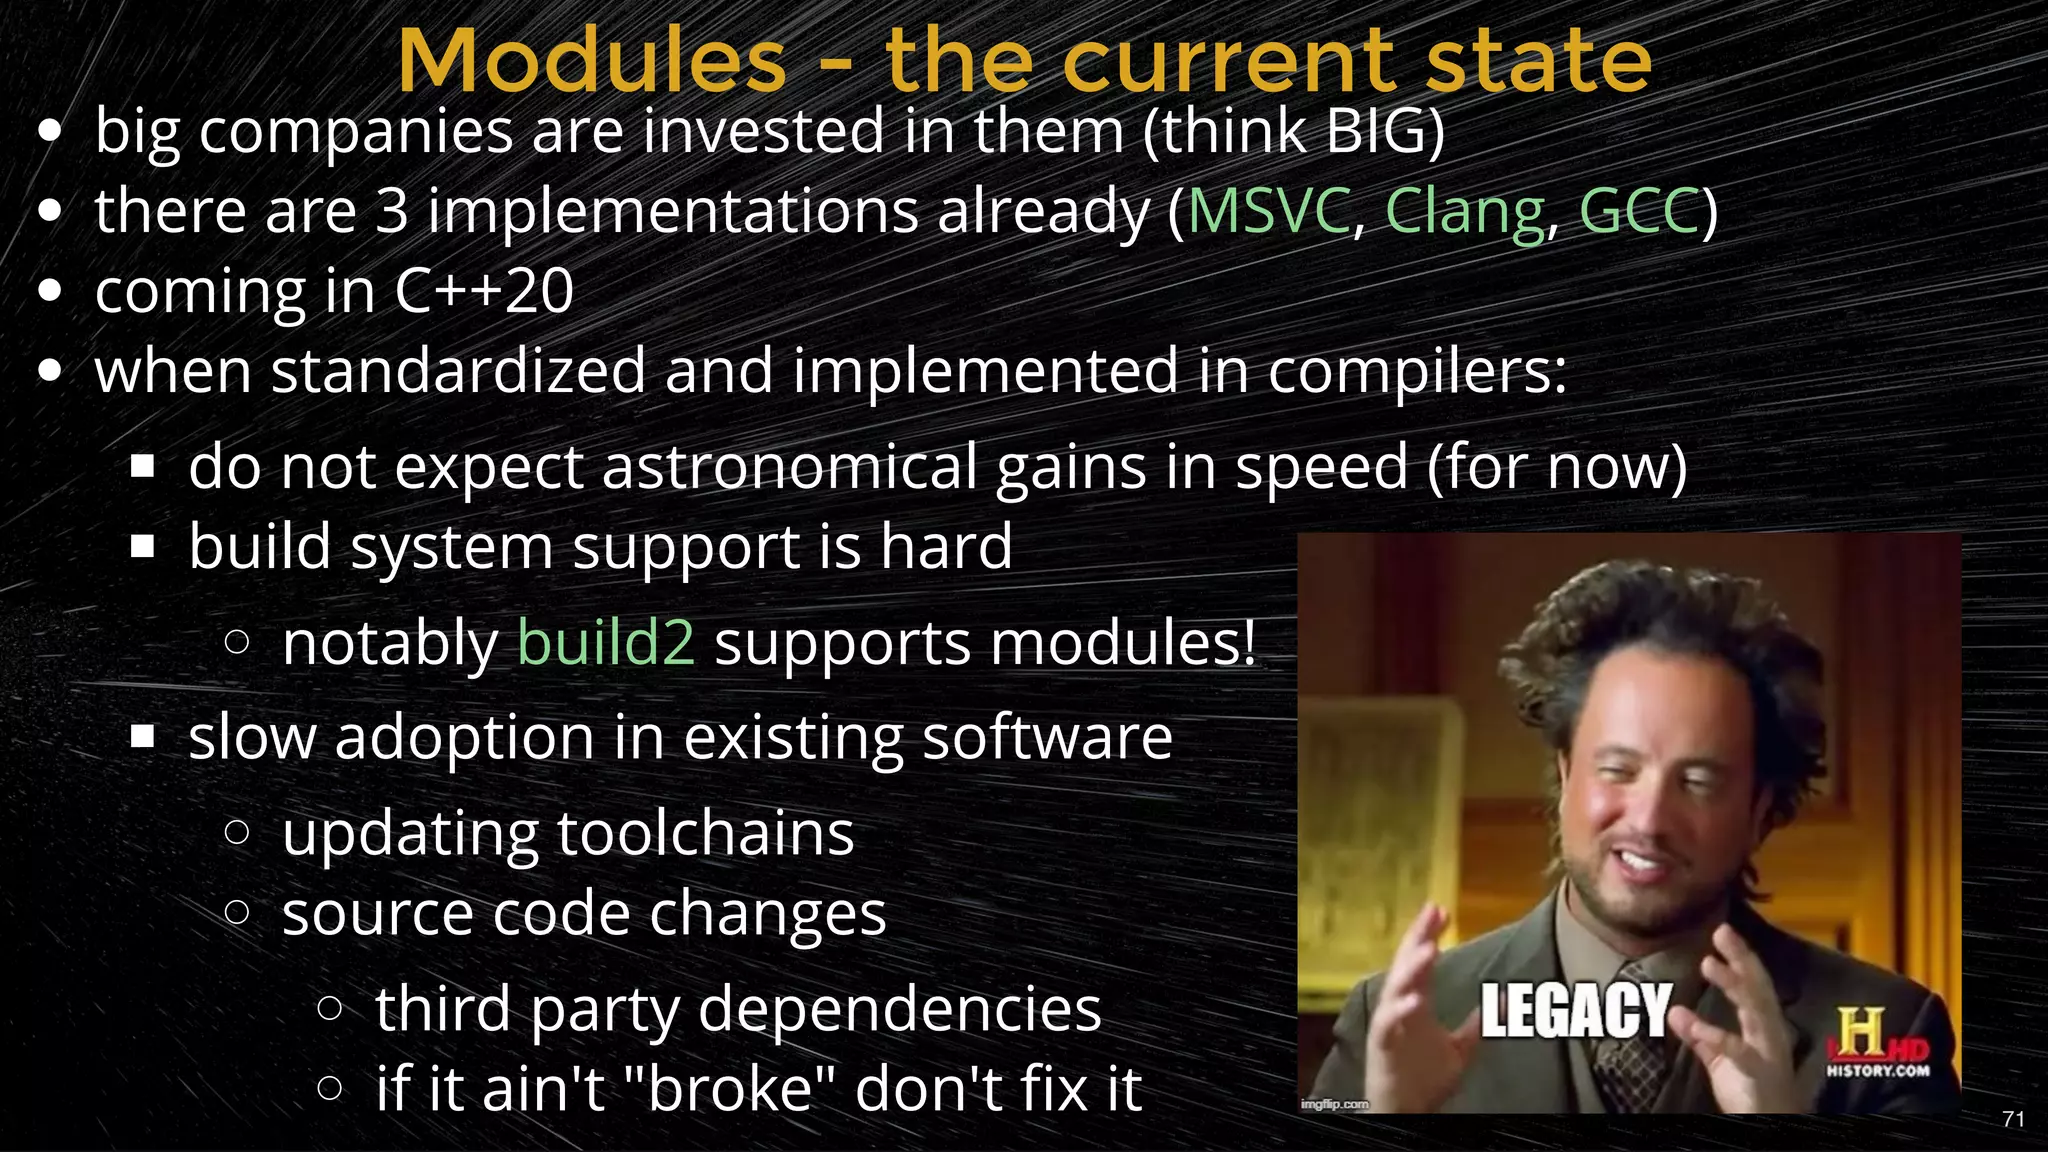
Introduction to the concept of modules in C++ and their expected impact on compilation.
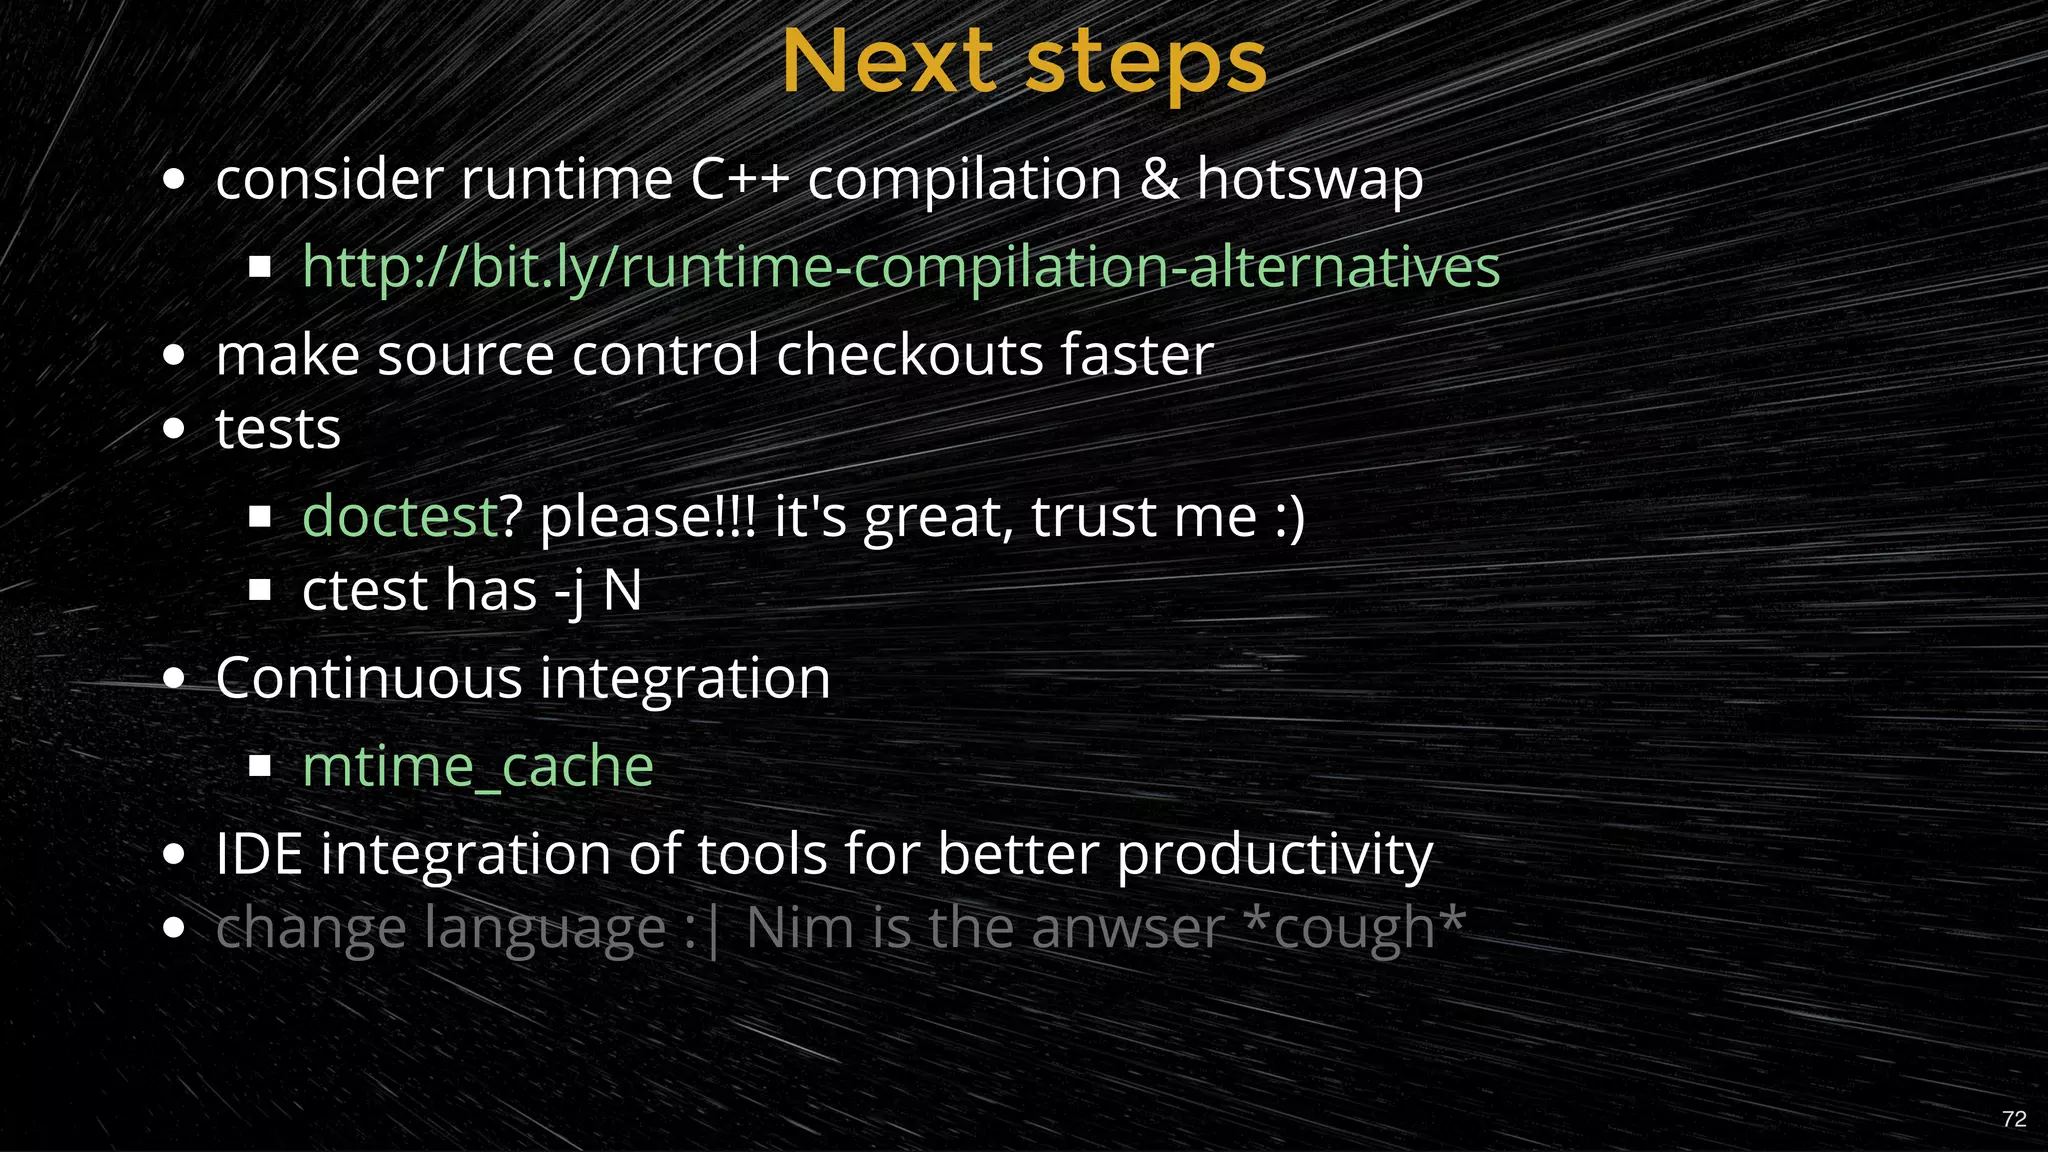
Wrap-up of the presentation with suggestions for further exploration and questions.


![[Td 2015] what is new in visual c++ 2015 and future directions(ulzii luvsanba...](https://cdn.slidesharecdn.com/ss_thumbnails/td2015whatisnewinvisualc2015andfuturedirectionsulziiluvsanbatandaymanshoukly-151104050956-lva1-app6891-thumbnail.jpg?width=640&height=640&fit=bounds)