Download to read offline
![Draft Version; not for circulation
A
Preprint typeset using L TEX style emulateapj v. 04/17/13
EXOPLANET TRANSIT SPECTROSCOPY USING WFC3: WASP-12 B, WASP-17 B, AND WASP-19 B
Avi M. Mandell1,7 , Korey Haynes1,2 , Evan Sinukoff3 , Nikku Madhusudhan4 , Adam Burrows5 , Drake Deming6
arXiv:1310.2949v1 [astro-ph.EP] 10 Oct 2013
Draft Version; not for circulation
ABSTRACT
We report analysis of transit spectroscopy of the extrasolar planets WASP-12 b, WASP-17 b, and
WASP-19 b using the Wide Field Camera 3 on the HST. We analyze the data for a single transit
for each planet using a strategy similar in certain aspects to the techniques used by Berta et al.
(2012), but we extend their methodology to allow us to correct for channel- or wavelength-dependent
instrumental effects by utilizing the band-integrated time series and measurements of the drift of the
spectrum on the detector over time. We achieve almost photon-limited results for individual spectral
bins, but the uncertainties in the transit depth for the the band-integrated data are exacerbated
by the uneven sampling of the light curve imposed by the orbital phasing of HST’s observations.
Our final transit spectra for all three objects are consistent with the presence of a broad absorption
feature at 1.4 µm potentially due to water. However, the amplitude of the absorption is less than that
expected based on previous observations with Spitzer, possibly due to hazes absorbing in the NIR
or non-solar compositions. The degeneracy of models with different compositions and temperature
structures combined with the low amplitude of any features in the data preclude our ability to place
unambiguous constraints on the atmospheric composition without additional observations with WFC3
to improve the S/N and/or a comprehensive multi-wavelength analysis.
Subject headings: planetary systems - planets and satellites: atmospheres - planets and satellites:
gaseous planets - infrared: planetary systems - techniques: spectroscopic - methods:
data analysis
1. INTRODUCTION
Over the past decade there has been significant
progress in characterizing exoplanets orbiting a wide variety of nearby stars, including the first detections of
light emitted by an exoplanet (Charbonneau et al. 2005;
Deming et al. 2005), the first spectrum of an exoplanet
(Richardson et al. 2007; Grillmair et al. 2007; Swain et al.
2008), the first phase curve for an exoplanet (Knutson
et al. 2007), the first detection of haze in an exoplanetary
atmosphere (Pont et al. 2008), and tentative constraints
claimed for the water, methane, carbon monoxide and
carbon dioxide abundances in several exoplanetary atmospheres (Grillmair et al. 2008; Swain et al. 2008, 2009b,a;
Madhusudhan & Seager 2009; Madhusudhan et al. 2011).
Almost 100 transiting exoplanets with Vstar < 12 have
been discovered to date, many with multi-band photometry from both space and ground-based observatories. We
are firmly in the era of exoplanet characterization, and
yet the sparse data available for each planet has resulted
in more questions than answers.
The Wide Field Camera 3 (WFC3) on the Hubble Space
Telescope (HST) provides the potential for spectroscopic
1 Solar System Exploration Division, NASA Goddard Space
Flight Center, Greenbelt, MD 20771, USA
2 School of Physics, Astronomy, and Computational Sciences,
George Mason University, Fairfax, VA 22030, USA
3 Institute for Astronomy, University of Hawaii, Honolulu, HI
96822, USA
4 Yale Center for Astronomy and Astrophysics, Yale University, New Haven, CT 06511, USA
5 Department of Astrophysical Sciences, Princeton University,
Princeton, NJ 08544, USA
6 Department of Astronomy, University of Maryland, College
Park, MD 20742, USA
7 Corresponding Email: Avi.Mandell@nasa.gov
characterization of molecular features in exoplanet atmospheres, a capability that has not existed in space
since the demise of NICMOS on HST and the IRS on
Spitzer. WFC3 is an optical/NIR camera capable of slitless grism spectroscopy, with wavelength coverage in the
the IR spanning between 0.8 and 1.7 µm. Studies of exoplanets have focused on using the G141 grism, the longwavelength dispersion element on the infrared channel
that covers the wavelength range 1.1 µm to 1.7 µm at
a maximum resolving power of 130 at 1.4 µm (Dressel
2012). This region spans both the major bands of water
between 1.3 and 1.5 µm as well as another water band
at 1.15 µm, and bands of a few other molecular species.
Observations measuring flux within NIR water bands are
impossible from the ground due to the extinction and
variability caused by water vapor in Earth’s atmosphere;
WFC3 therefore represents the only current platform for
measuring absorption and/or emission from water in exoplanet atmospheres.
In this paper we present WFC3 observations of three
transiting “hot Jupiter” exoplanets — WASP-12 b,
WASP-17 b, and WASP-19 b — during transit of the
host star. Two of these data sets, for WASP-17 b and
WASP-19 b, were observed as part of a large HST program to examine single transits and occultations from
16 hot Jupiters (P.I. D. Deming), while the data for the
transit of WASP-12 b were taken as part of a singleobject campaign (P.I. M. Swain) and first analyzed in
Swain et al. (2013). All three planets orbit extremely
close to their parent star and have large atmospheric
scale heights, making them excellent targets for transmission spectroscopy. WASP-12 b and WASP-17 b (as
well as WASP-19 b to a lesser extent) belong to a class
of “bloated” or “inflated” planets, which have signifi-](https://image.slidesharecdn.com/exoplanettransitspectroscopyusingwfc3-131203212303-phpapp01/85/Exoplanet-transit-spectroscopy_using_wfc3-1-320.jpg)
![Draft Version; not for circulation
A
Preprint typeset using L TEX style emulateapj v. 04/17/13
EXOPLANET TRANSIT SPECTROSCOPY USING WFC3: WASP-12 B, WASP-17 B, AND WASP-19 B
Avi M. Mandell1,7 , Korey Haynes1,2 , Evan Sinukoff3 , Nikku Madhusudhan4 , Adam Burrows5 , Drake Deming6
arXiv:1310.2949v1 [astro-ph.EP] 10 Oct 2013
Draft Version; not for circulation
ABSTRACT
We report analysis of transit spectroscopy of the extrasolar planets WASP-12 b, WASP-17 b, and
WASP-19 b using the Wide Field Camera 3 on the HST. We analyze the data for a single transit
for each planet using a strategy similar in certain aspects to the techniques used by Berta et al.
(2012), but we extend their methodology to allow us to correct for channel- or wavelength-dependent
instrumental effects by utilizing the band-integrated time series and measurements of the drift of the
spectrum on the detector over time. We achieve almost photon-limited results for individual spectral
bins, but the uncertainties in the transit depth for the the band-integrated data are exacerbated
by the uneven sampling of the light curve imposed by the orbital phasing of HST’s observations.
Our final transit spectra for all three objects are consistent with the presence of a broad absorption
feature at 1.4 µm potentially due to water. However, the amplitude of the absorption is less than that
expected based on previous observations with Spitzer, possibly due to hazes absorbing in the NIR
or non-solar compositions. The degeneracy of models with different compositions and temperature
structures combined with the low amplitude of any features in the data preclude our ability to place
unambiguous constraints on the atmospheric composition without additional observations with WFC3
to improve the S/N and/or a comprehensive multi-wavelength analysis.
Subject headings: planetary systems - planets and satellites: atmospheres - planets and satellites:
gaseous planets - infrared: planetary systems - techniques: spectroscopic - methods:
data analysis
1. INTRODUCTION
Over the past decade there has been significant
progress in characterizing exoplanets orbiting a wide variety of nearby stars, including the first detections of
light emitted by an exoplanet (Charbonneau et al. 2005;
Deming et al. 2005), the first spectrum of an exoplanet
(Richardson et al. 2007; Grillmair et al. 2007; Swain et al.
2008), the first phase curve for an exoplanet (Knutson
et al. 2007), the first detection of haze in an exoplanetary
atmosphere (Pont et al. 2008), and tentative constraints
claimed for the water, methane, carbon monoxide and
carbon dioxide abundances in several exoplanetary atmospheres (Grillmair et al. 2008; Swain et al. 2008, 2009b,a;
Madhusudhan & Seager 2009; Madhusudhan et al. 2011).
Almost 100 transiting exoplanets with Vstar < 12 have
been discovered to date, many with multi-band photometry from both space and ground-based observatories. We
are firmly in the era of exoplanet characterization, and
yet the sparse data available for each planet has resulted
in more questions than answers.
The Wide Field Camera 3 (WFC3) on the Hubble Space
Telescope (HST) provides the potential for spectroscopic
1 Solar System Exploration Division, NASA Goddard Space
Flight Center, Greenbelt, MD 20771, USA
2 School of Physics, Astronomy, and Computational Sciences,
George Mason University, Fairfax, VA 22030, USA
3 Institute for Astronomy, University of Hawaii, Honolulu, HI
96822, USA
4 Yale Center for Astronomy and Astrophysics, Yale University, New Haven, CT 06511, USA
5 Department of Astrophysical Sciences, Princeton University,
Princeton, NJ 08544, USA
6 Department of Astronomy, University of Maryland, College
Park, MD 20742, USA
7 Corresponding Email: Avi.Mandell@nasa.gov
characterization of molecular features in exoplanet atmospheres, a capability that has not existed in space
since the demise of NICMOS on HST and the IRS on
Spitzer. WFC3 is an optical/NIR camera capable of slitless grism spectroscopy, with wavelength coverage in the
the IR spanning between 0.8 and 1.7 µm. Studies of exoplanets have focused on using the G141 grism, the longwavelength dispersion element on the infrared channel
that covers the wavelength range 1.1 µm to 1.7 µm at
a maximum resolving power of 130 at 1.4 µm (Dressel
2012). This region spans both the major bands of water
between 1.3 and 1.5 µm as well as another water band
at 1.15 µm, and bands of a few other molecular species.
Observations measuring flux within NIR water bands are
impossible from the ground due to the extinction and
variability caused by water vapor in Earth’s atmosphere;
WFC3 therefore represents the only current platform for
measuring absorption and/or emission from water in exoplanet atmospheres.
In this paper we present WFC3 observations of three
transiting “hot Jupiter” exoplanets — WASP-12 b,
WASP-17 b, and WASP-19 b — during transit of the
host star. Two of these data sets, for WASP-17 b and
WASP-19 b, were observed as part of a large HST program to examine single transits and occultations from
16 hot Jupiters (P.I. D. Deming), while the data for the
transit of WASP-12 b were taken as part of a singleobject campaign (P.I. M. Swain) and first analyzed in
Swain et al. (2013). All three planets orbit extremely
close to their parent star and have large atmospheric
scale heights, making them excellent targets for transmission spectroscopy. WASP-12 b and WASP-17 b (as
well as WASP-19 b to a lesser extent) belong to a class
of “bloated” or “inflated” planets, which have signifi-](https://image.slidesharecdn.com/exoplanettransitspectroscopyusingwfc3-131203212303-phpapp01/75/Exoplanet-transit-spectroscopy_using_wfc3-1-2048.jpg)
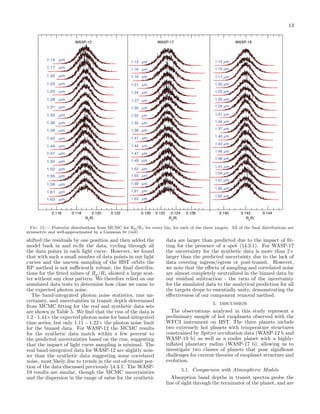
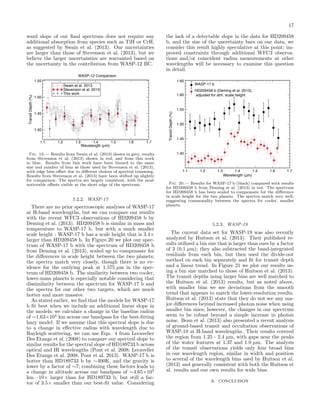
![9
TABLE 2
Stellar and Orbital Parameters Used For Model Fitting and Comparison
Parameters
WASP-12 ba
WASP-17 bb
WASP-19 bc
Period (days)
i (◦ )
Rp /R∗
Tc
µ1 d
µ2
a/R∗
e
ω (◦ )
Semi-major axis (AU)
M∗ (M )
Mp ×sin i (MJ )
Spectral type
H-band Magnitude
[Fe/H]
1.09
82.5 ± 0.8
0.117 ± 0.00068
55663.199
0.127 ± 0.0487
0.271 ± 0.0620
3.03 ± 0.0220
0.0447 ± 0.00430
94.4 ± 0.0300
0.02309 ± 0.00096
1.38 ± 0.18
1.378 ± 0.181
G0
10.228
0.3 ± 0.1
3.73
86.7 ± 0.500
0.123 ± 0.037
55750.285
0.0901 ± 0.0487
0.273 ± 0.0620
6.96 ± 0.0220
0.00
0.00
0.05105 ± 0.00128
1.286 ± 0.079
0.477 ± 0.033
F4
10.319
-0.25 ± 0.09
0.789
79.5 ± 0.500
0.139 ± 0.0457
55743.532
0.153 ± 0.0487
0.293 ± 0.0620
3.57 ± 0.0460
0.00770 ± 0.00680
43.0 ± 67.0
0.01616 ± 0.00024
0.904 ± 0.040
1.114 ± 0.04
G8V
10.602
0.02 ± 0.09
a Values from Southworth et al. (2012).
b Values from Maciejewski et al. (2013).
c Values from Lendl et al. (2013).
d Values for limb darkening derived from Claret & Bloemen (2011) quadratic limb darkening
tables.
TABLE 3
Fitted Parameters From Band-Integrated Time Series
Parameters
WASP-12 b
WASP-17 b
WASP-19 b
Rp /R∗
µ1
µ2
Mid-Transit (MJD)
Slopea
0.11895 ± 0.0013
0.085 ± 0.024
0.281 ± 0.034
55663.199736 ± 0.000065
-0.00793 ± 0.00034
0.12316 ± 0.00058
0.083 ± 0.031
0.256 ± 0.046
55750.294793 ± 0.00088
-0.00578 ± 0.0010
0.14140 ± 0.00093
0.092 ± 0.025
0.305 ± 0.027
55743.532268 ± 0.000040
-0.00407 ± 0.00039
a Linear slope has units of normalized flux per day.
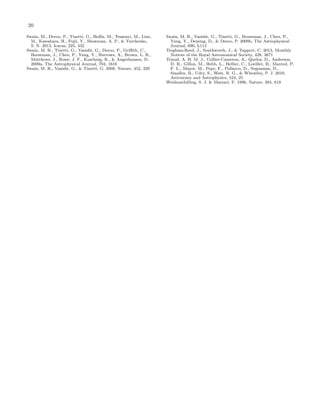
tions before conclusions as to its validity or physical nature can be made. The light curve for WASP-17 does
not include a post-egress portion so we cannot evaluate
the presence of a curved baseline.
WASP-12
1.002
WASP-19
Data
Flat
Sine
Poly
Normalized Flux
1.001
1.000
0.999
0.998
1.0010
1.0005
1.0000
Trans. Dep. (%)
1.44
F
1.42
1.40
1.38
Trans. Dep. (%)
2.02
0.9995
F
2.00
1.98
S
−0.10
P
1.96 S
0.9990
P
0.10 −0.10
−0.05
Time From Mid−Transit (days)
0.05
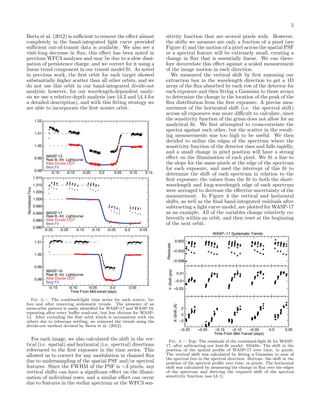
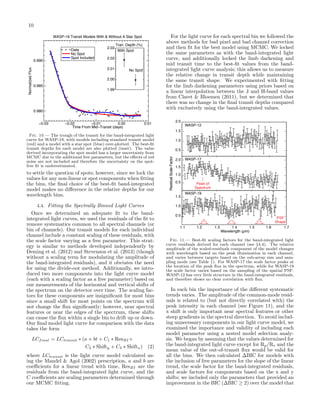
Fig. 9.— The out-of-transit portions of the band-integrated light
curves for WASP-12 (left) and WASP-19 (right), with models
including only a linear trend (red) and an additional sinusoidal
component (blue) or 2nd-order polynomial function (green) overplotted. The best-fit transit depths for each model are also plotted
(inset). The addition of sinusoidal or polynomial components produce a marginally better fit, but the improvements are not sufficient
to yield a lower BIC.
The in-transit orbit of WASP-19 also has a region just
after second contact (after the end of ingress) which deviates slightly from a standard transit curve (see Figure 10). The amplitude and duration of the deviation
is similar to the amplitude and duration of starspots detected in optical transit data by Tregloan-Reed et al.
(2013), so we experimented with including a Gaussianshaped spot in our transit model. The spot model leads
to a statistically better fit with ∆BIC = 7.8 (see Figure 10), leading us to adopt a model including a sunspot
modeled as a Gaussian with a position centered at MJD
55743.526, a relative amplitude of 0.06%, and a width of
0.0036 days. We locked the amplitude of the spot when
fitting each of the bins, since our data quality is insufficient to determine variations with wavelength. Neither
of our other data sets showed evidence for star spots,
which is expected since both WASP-17 and WASP-12
are significantly hotter than WASP-19.
Considering the ambiguity regarding the presence of
additional visit-long components and star spots, we decided to use the average of all the model fits with and
without a sinusoidal component or a spot for the bandintegrated transit depth listed in Table 3, and augment
the uncertainty values to encompass the full range of values; this increases the uncertainty by a factor of ∼4 for
WASP-19 and a factor of ∼5 for WASP-12. To remove
these ambiguities in the band-integrated transit depth we
would need a fully-sampled light curve and multiple visits](https://image.slidesharecdn.com/exoplanettransitspectroscopyusingwfc3-131203212303-phpapp01/85/Exoplanet-transit-spectroscopy_using_wfc3-9-320.jpg)

This document presents an analysis of transit spectroscopy observations of three exoplanets - WASP-12 b, WASP-17 b, and WASP-19 b - using the Wide Field Camera 3 instrument on the Hubble Space Telescope. The observations achieved almost photon-limited precision but uncertainties in the transit depths were increased by the uneven sampling of the light curves. The final transit spectra for all three planets are consistent with the presence of a water absorption feature at 1.4 microns, though the amplitude is smaller than expected from previous Spitzer observations possibly due to hazes. Due to degeneracies between models, the data cannot unambiguously constrain the atmospheric compositions without additional observations.


