Download to read offline
![Draft version August 13, 2013
A
Preprint typeset using L TEX style emulateapj v. 5/2/11
DWARF GALAXIES WITH OPTICAL SIGNATURES OF ACTIVE MASSIVE BLACK HOLES
Amy E. Reines1
National Radio Astronomy Observatory, Charlottesville, VA 22903, USA
Jenny E. Greene
arXiv:1308.0328v2 [astro-ph.CO] 12 Aug 2013
Department of Astrophysical Sciences, Princeton University, Princeton, NJ 08544, USA
and
Marla Geha
Department of Astronomy, Yale University, New Haven, CT 06520, USA
Draft version August 13, 2013
ABSTRACT
We present a sample of 151 dwarf galaxies (108.5
M
109.5 M ) that exhibit optical spectroscopic signatures of accreting massive black holes (BHs), increasing the number of known active
galaxies in this stellar mass range by more than an order of magnitude. Utilizing data from the Sloan
Digital Sky Survey Data Release 8 and stellar masses from the NASA-Sloan Atlas, we have systematically searched for active BHs in ∼25,000 emission-line galaxies with stellar masses comparable to
the Magellanic Clouds and redshifts z < 0.055. Using the narrow-line [O III]/Hβ versus [N II]/Hα
diagnostic diagram, we find photoionization signatures of BH accretion in 136 galaxies, a small fraction of which also exhibit broad Hα emission. For these broad-line AGN candidates, we estimate BH
masses using standard virial techniques and find a range of 105
MBH
106 M and a median of
5
MBH ∼ 2 × 10 M . We also detect broad Hα in 15 galaxies that have narrow-line ratios consistent
with star-forming galaxies. Follow-up observations are required to determine if these are true type 1
AGN or if the broad Hα is from stellar processes. The median absolute magnitude of the host galaxies
in our active sample is Mg = −18.1 mag, which is ∼1–2 magnitudes fainter than previous samples of
AGN hosts with low-mass BHs. This work constrains the smallest galaxies that can form a massive
BH, with implications for BH feedback in low-mass galaxies and the origin of the first supermassive
BH seeds.
Subject headings: galaxies: active — galaxies: dwarf — galaxies: nuclei— galaxies: Seyfert
1. INTRODUCTION
Over the past decade we have come to appreciate that
nuclear black holes (BHs) with MBH ∼ 106 − 109 M
are a ubiquitous component of massive galaxies in the
modern Universe (e.g., Kormendy & Richstone 1995; Kormendy & Ho 2013), yet the origin of the first highredshift supermassive BH “seeds” is far from understood.
Observations of quasars with billion solar-mass BHs at a
time when the Universe was less than a Gyr old (e.g., Fan
et al. 2001; Mortlock et al. 2011) demonstrate that supermassive BHs almost certainly started out with masses
considerably in excess of normal stellar-mass BHs. However, we do not know how these initial seed BHs formed
in the early Universe, how massive they were originally,
or in what types of galaxies they formed. While direct
observations of distant seed BHs and their host galaxies in the infant Universe are unobtainable with current
capabilities, nearby dwarf galaxies are within observational reach and can provide important constraints on
the formation path, masses and hosts of BH seeds (e.g.,
Volonteri 2010; Greene 2012). The goal of this work is
to systematically search for optical AGN signatures in
dwarf galaxies (M
3 × 10⁹ M ), where very few mas-
areines@nrao.edu
1 Einstein Fellow
sive BHs2 have hitherto been found.
The growth of supermassive BHs appears to be linked
to the evolution of their hosts, with more massive galaxies generally harboring more massive BHs (e.g., Gebhardt et al. 2000a; Ferrarese & Merritt 2000; Marconi
& Hunt 2003; G¨ltekin et al. 2009; McConnell & Ma
u
2013). Therefore, unlike today’s massive galaxies, lowmass dwarf galaxies with relatively quiet merger histories may host BHs with masses not so different from the
first seed BHs (Bellovary et al. 2011). Models of BH
growth in a cosmological context (Volonteri et al. 2008)
indicate that if we can determine the BH occupation fraction and mass distribution in present-day dwarf galaxies,
we will gain insight into whether seed BHs formed primarily as the end-product of Population III stars (e.g.,
Bromm & Yoshida 2011), in a direct collapse scenario
(e.g., Haehnelt & Rees 1993; Lodato & Natarajan 2006;
Begelman et al. 2006), or in a runaway accretion event at
the center of a dense star cluster (e.g., Portegies Zwart
et al. 2004; Miller & Davies 2012). Studying the scaling relations between BHs and galaxies at low-mass may
provide further clues (e.g., Volonteri & Natarajan 2009).
There are additional reasons to search for and study
2 We use the term “massive BH” to refer to BHs larger than
normal stellar-mass BHs. BHs with masses in the range ∼ 104 −
106 M are also sometimes referred to as “low-mass BHs” (meaning relatively low-mass supermassive BHs) or “intermediate-mass
BHs (IMBHs).”](https://image.slidesharecdn.com/dwarfgalaxieswithopticalsignaturesofactivemassiveblackholes-140109062630-phpapp01/75/Dwarf-galaxies-with_optical_signatures_of_active_massive_black_holes-1-2048.jpg)
![Dwarf Galaxies with Active Massive Black Holes
stellar masses comparable to or less than the Large Magellanic Cloud (LMC). Starting with a sample of ∼ 25, 000
emission-line galaxies in the SDSS Data Release 8 (DR8)
spectroscopic catalog (Aihara et al. 2011) with stellar
masses M
3 × 10⁹ M and redshifts z < 0.055, we
identify dwarf galaxies with narrow-line photoionization
signatures of an accreting massive BH. In addition, we
search for broad Hα emission that may indicate gas orbiting in the deep potential well of a massive BH. Collectively, the galaxies presented here are the smallest and
least-massive known to contain massive BHs.
2. DATA AND DWARF GALAXY SAMPLE
We have selected our sample of dwarf galaxies from
the NASA-Sloan Atlas3 (NSA), which in turn is based on
the SDSS DR8 spectroscopic catalog (York et al. 2000;
Aihara et al. 2011). We use the NSA for selecting our
parent sample of galaxies and investigating galaxy properties, but analyze the SDSS spectra with our own customized software to search for signatures of BH accretion (Section 3). The SDSS uses the dedicated 2.5-meter
wide-field Sloan Foundation Telescope and a 640-fiber
double spectrograph at Apache Point Observatory in
New Mexico (Gunn et al. 2006). The instrumental fiber
diameter is 3 and the spectrophotometrically calibrated
spectra cover a wavelength range from 3800 − 9200 ˚,
A
with a instrumental dispersion of 69 km s−1 per pixel.
The NSA provides a re-analysis of the SDSS imaging and spectroscopic data for all galaxies with redshifts
z < 0.055. Photometry is improved over the standard
SDSS DR8 photometric catalog as described in Blanton et al. (2011) and results in a cleaner sample of
dwarf galaxies compared to previous catalogs that include many fragmented pieces of extended massive galaxies. The spectroscopic data is re-analyzed using the
methods of Yan & Blanton (2012) and Yan (2011). We
only use the emission line measurements in the NSA for
quality cuts in signal-to-noise and equivalent width as
described below. In addition to a variety of galaxy parameters, estimates of stellar masses are provided in the
NSA. Stellar masses are derived from the kcorrect code
of Blanton & Roweis (2007), which fits broadband fluxes
using templates based on the stellar population synthesis models of Bruzual & Charlot (2003) and the nebular
emission-line models of Kewley et al. (2001). Masses are
given in units of M h−2 and we have assumed h = 0.73.
Since our goal is to search for dwarf galaxies hosting
active massive BHs, we first select sources in the NSA
with stellar masses M ≤ 3 × 10⁹ M and obtain 44,594
objects. Our mass threshold, while somewhat arbitrary,
is approximately equal to the stellar mass of the LMC
(van der Marel et al. 2002), which is the most massive
dwarf galaxy satellite around the Milky Way. While we
do not apply a minimum stellar mass limit, nearly all of
the galaxies in our parent sample have M
107 M due
to the SDSS spectroscopic apparent magnitude limit of
r < 17.7. Therefore, while we can probe dwarf galaxies
with stellar masses comparable to the Magellanic Clouds,
we are not sensitive to galaxies with lower stellar mass
such as the Fornax dwarf spheroidal (2×10⁷ M ) around
the Milky Way (e.g., McConnachie 2012; Mateo 1998).
We also impose modest requirements on emission line
3
http://www.nsatlas.org
3
flux measurements reported in the NSA: a signal-to-noise
ratio S/N ≥ 3 and an equivalent width EW > 1 for Hα,
[N II] λ6584, and [O III] λ5007 and S/N ≥ 2 for Hβ. This
reduces the number of sources to 25,974.
We use stellar mass as our primary selection criterion rather than absolute magnitude since galaxies of a
given mass can span a wide range in absolute magnitude
due to differences in stellar populations. Younger, bluer,
star-forming galaxies will be brighter than older, redder, quenched galaxies for a given mass (e.g., Bell et al.
2003). Additionally, strong emission lines (and even nebular continuum) can boost broad-band fluxes, especially
in the SDSS g- and r-bands (e.g., Reines et al. 2010; Anders & Fritze-v. Alvensleben 2003). Therefore, imposing
an absolute magnitude cut would preferentially exclude
line-emitting galaxies compared to equivalent galaxies
that do not have strong emission lines. The derived stellar masses are less sensitive to these effects since multiple bands are fit and the SED templates of Blanton &
Roweis (2007) include emission lines. However, imposing
a stellar mass cut introduces a bias such that blue/starforming galaxies will be detected over a larger volume
than red/quenched galaxies with the same stellar mass
(e.g., Geha et al. 2012).
3. ANALYSIS AND RESULTS
There are many ways to identify the presence of an accreting supermassive BH (see the review in Ho 2008). In
this work, we search for two signatures of active BHs in
the optical spectra of galaxies: 1) narrow emission-line
ratios indicating photoionization by an accreting BH, and
2) broad Hα emission signifying dense gas orbiting a massive BH. After selecting dwarf emission-line galaxies from
the NSA (§2), we retrieve the SDSS spectra for the entire
sample and analyze them with customized software as described below. All code was developed in the Interactive
Data Language (IDL) and our fitting routines make use
of the non-linear least squares curve fitting package MPFIT (Markwardt 2009). Individual sources flagged by
our automated algorithms are subsequently inspected by
eye.
3.1. Continuum and Absorption Line Subtraction
Before we can look for any signature of an AGN, we
need to model and remove stellar continuum from the
host galaxy, that in almost all cases dominates the total
continuum. The spectra also contain stellar absorption
lines. Balmer absorption is of particular concern since we
aim to detect potentially weak broad Hα emission from
nuclear activity in the galaxies. Our general approach
for modeling the continuum and absorption lines is based
on that presented in Tremonti et al. (2004). We fit the
galaxy spectra with a non-negative linear combination of
simple stellar population (SSP) models spanning a range
of ages for a given metallicity. The model templates are
the same as those used in Tremonti et al. (2004) and come
from the stellar population synthesis code of Bruzual &
Charlot (2003)4 . The templates include model spectra
for 10 different ages (0.005, 0.025, 0.1, 0.29, 0.64, 0.9,
1.4, 2.5, 5, and 11 Gyr) and 3 different metallicities (Z
= 0.008, 0.02, 0.05). Each galaxy spectrum is modeled as
4 We retrieved the templates from the corresponding website
http://www2.iap.fr/users/charlot/bc2003/.](https://image.slidesharecdn.com/dwarfgalaxieswithopticalsignaturesofactivemassiveblackholes-140109062630-phpapp01/75/Dwarf-galaxies-with_optical_signatures_of_active_massive_black_holes-3-2048.jpg)
![4
Reines et al.
a combination of SSP templates with a single metallicity
and we select the metallicity yielding the best-fit. In the
fitting process, we allow for reddening from dust using
the Galactic extinction curve of Cardelli et al. (1989) and
Gaussian smoothing to match the absorption line widths.
Our algorithm for modeling the continuum and absorption lines in each spectrum is an iterative process. The
SSP models do not contain emission lines and so we begin by masking out pixels 5σ above the continuum in
the observed spectra to remove both strong and weak
lines. We then apply a redshift-correction using the redshift derived from emission lines provided in the NSA
catalog. A preliminary model is fit to the resulting spectrum and the two are cross-correlated to determine any
redshift offset between the absorption and emission lines.
After correcting for the redshift offset, we find the best fit
model for each of the 3 model metallicities. The singlemetallicity model with the smallest χ2 value is selected
and used to improve the masking of emission lines. Pixels more than 5σ above the difference spectrum (data −
model) are excluded in the last round of fitting. Again,
we find the best-fit model for each metallicity and select
the single-metallicity model with the smallest χ2 for our
final model of the continuum and absorption line spectrum. The vast majority of the galaxy spectra are best
fit by the sub-solar metallicity model (Z = 0.008), which
is consistent with studies demonstrating that low-mass
galaxies generally have low metallicities (e.g. Tremonti
et al. 2004). In the small fraction of cases where absorption lines are either extremely weak or absent, a thirdorder polynomial is fit to the continuum. We subtract
this model from the data to produce a pure-emission line
spectrum.
3.2. Emission Line Measurements
In order to identify the spectral signatures of active
massive BHs, we model the emission lines of interest as
Gaussians. We are especially interested in detecting any
possible broad Hα component. Luminous unobscured
AGN powered by supermassive BHs in massive galaxies
often exhibit bright, broad Hα emission that is clearly
visible even by eye. However, the broad Hα signatures
from AGNs with lower-mass BHs hosted by dwarf galaxies will be less pronounced, generally having narrower
widths and lower luminosities than their higher mass
counterparts. Moreover, any potential broad Hα feature
will be blended with narrow Hα emission and the surrounding [N II] λλ6548, 6583 doublet. Therefore, it is
vital to carefully model the narrow emission line profile
in order to detect any potential broad Hα emission.
We base our model of the narrow emission line profile
on the [S II] λλ6713, 6731 doublet, which has been shown
to be generally well-matched to the line profiles of the
[N II] λλ6548, 6583 doublet and narrow Hα (Filippenko
& Sargent 1988, 1989; Ho et al. 1997; Greene & Ho 2004).
The [S II] doublet is first fit with a single Gaussian model
with the width of the two lines assumed to be equal and
the relative separation between the two lines held fixed by
their laboratory wavelengths. The [S II] doublet is also fit
with a two-component Gaussian model, with the added
constraint that the height ratio of the two components
must be equal for each line. If the reduced χ2 value from
the two-component model is at least 10% lower than that
of the single Gaussian model, the two-component model
is selected. Nearly all of the galaxies in our dwarf sample
only require a single Gaussian to model the [S II] doublet,
with only 15 sources preferring a two-component model
(8 of which turn out to be classified as either a BPT AGN
or composite, see Section 3.3).
Once we have constructed a suitable model of the [S II]
doublet, we use it as a template for fitting the narrow
lines in the Hα + [N II] complex. The relative separations between the centroids of the narrow Gaussian components are held fixed using laboratory wavelengths and
the flux of [N II] λ6584 to [N II] λ6548 is fixed at the
theoretical value of 2.96. We assume the [N II] lines have
the same width (in velocity) as the [S II] lines, but generously allow the width of the narrow Hα component to increase by as much as 25% for the vast majority of cases in
which a single Gaussian is used to model the narrow line
profile. For the small number of sources (15/25974) with
two-component Gaussian models for the narrow lines, the
profiles are strictly scaled from the [S II] lines. The Hα +
[N II] complex is fit and the reduced χ2 computed. The
Hα + [N II] complex is fit a second time, allowing for an
additional broad Hα component. If the resulting reduced
χ2 is improved by at least 20% and the FWHM of the
broad Hα component is at least 500 km s−1 after correcting for the fiber-dependent instrumental resolution,
we select the model including broad Hα. Our choice of
20% improvement in reduced χ2 , while somewhat arbitrary, has been used successfully in previous studies (e.g.,
Hao et al. 2005) and empirically works here. The modest
FWHM requirement is imposed to avoid severe contamination from galaxies undergoing intense star formation
that have moderately broadened bases on Hα. The procedures described thus far yields a sample of 51 sources
flagged as having a broad Hα component, not all of which
make it into our final sample of broad-line AGN candidates as described in Section 3.4.
We also measure the Hβ, [O III] λ5007 and [O I] 6300
emission lines. The narrow-line profile derived from the
[S II] doublet is used as a template for fitting Hβ, using
the same approach as that for Hα. The Hβ line is fit
twice, with and without a broad component. If statistically justified (reduced χ2 is improved by at least 20%),
we accept the model with a broad component. Since the
[O III] profile commonly exhibits a broad, blue shoulder
(e.g., Heckman et al. 1981; Whittle 1985) and does not
typically match the profile of the other narrow lines measured in this work (Greene & Ho 2005a), we do not use
the model derived from the [S II] doublet. Instead, we fit
the [O III] (and [O I]) line independently allowing for up
to two Gaussian components (χ2 must be reduced by at
least 20% to use the two-component model).
Emission-line fluxes are calculated using the Gaussian
model parameters. Uncertainties in the model parameters are provided by MPFIT, which accounts for the
SDSS error spectrum. We use standard propagation of
errors to determine the errors in the line fluxes.
3.3. BPT AGN and Composites
When an accreting BH is present in a galaxy, the ISM is
photoionized by a much harder continuum than is emitted by hot stars. AGNs and H II regions separate cleanly
in two-dimensional strong line diagnostic diagrams that
take pairs of lines close together in frequency to mitigate](https://image.slidesharecdn.com/dwarfgalaxieswithopticalsignaturesofactivemassiveblackholes-140109062630-phpapp01/75/Dwarf-galaxies-with_optical_signatures_of_active_massive_black_holes-4-2048.jpg)
![Dwarf Galaxies with Active Massive Black Holes
5
Figure 1. Left: BPT [O III]/Hβ versus [N II]/Hα narrow-line diagnostic diagram for all ∼ 25, 000 dwarf emission-line galaxies analyzed
in this work. Galaxies with spectra dominated by an AGN are plotted as red points and galaxies with spectra dominated by star formation
are plotted as blue points. Composite galaxies with significant contributions from both an AGN and star formation are plotted as purple
points. The typical error is shown in the lower right corner (individual flux errors are given in Tables 2 and 4). The dashed line is an
empirical separation of pure star-forming galaxies and those with some contribution from an AGN from Kauffmann et al. (2003b). The
solid line is from Kewley et al. (2001), indicating the ‘maximum starburst line’ given by pure stellar photoionization models. We note
that the red point falling to the far left of the diagram and just above the dividing line is unusual in a number of ways and rather suspect
(see footnote in text). Right: BPT diagram for broad-line AGN candidates only (§3.4). We consider the sources falling in the AGN and
composite regions of the diagram the most secure broad-line candidates. Significant contamination from luminous Type II supernovae is
likely in the star-forming region of the diagram.
the effects of reddening (Baldwin et al. 1981; Veilleux &
Osterbrock 1987; Kewley et al. 2001; Kauffmann et al.
2003b; Kewley et al. 2006). The two-dimensional linediagnostic diagrams (also known as BPT diagrams after
the Baldwin et al. paper) are routinely used to separate
line-emitting galaxies by their primary excitation source.
Here we employ the most widely used BPT diagram
as our primary diagnostic, which takes [O III]/Hβ vs.
[N II]/Hα (Figure 1). In this diagram, line-emitting
galaxies separate into a V -shape (e.g., Kewley et al.
2006; Groves et al. 2006). Star-forming galaxies with
H II-region-like spectra occupy the left-most plume of
galaxies, with lower-metallicity systems having higher
[O III]/Hβ ratios and lower [N II]/Hα ratios (e.g., Moustakas et al. 2006). AGNs occupy the right branch of
galaxies with high-ionization Seyferts found in the upper right. Low-metallicity AGNs are found to the left
of the main Seyfert region and can overlap with lowmetallicity starburst galaxies (Groves et al. 2006; Ludwig et al. 2012). The most contentious region of the
diagram sits directly below the Seyfert galaxies: galaxies with very high low-ionization lines, named Low Ionization Nuclear Emission Region galaxies by Heckman
(LINERs; 1980). LINER emission can be generated both
by shocks and very hard AGN spectra, and disentangling
the primary origin in any given case can be complicated
and aperture dependent (e.g., Kewley et al. 2006; Sarzi
et al. 2006; Ho 2008; Eracleous et al. 2010; Yan & Blanton 2012). Finally, composites objects fall in the region
delineated by the empirical dividing line of Kauffmann
et al. (2003b) separating pure star-forming galaxies from
those with some contribution from an AGN, and the theoretical ‘maximum starburst line’ of Kewley et al. (2001)
given by pure stellar photoionization models. Composite
objects are thought to contain significant contributions
from both AGN and star formation (e.g., Panessa et al.
2005; Kewley et al. 2006; Trouille et al. 2011, but also
see Liu et al. (2008)).
Using the [O III]/Hβ vs. [N II]/Hα diagnostic diagram
and our narrow emission-line measurements, we have
identified 136 galaxies with photoionization signatures
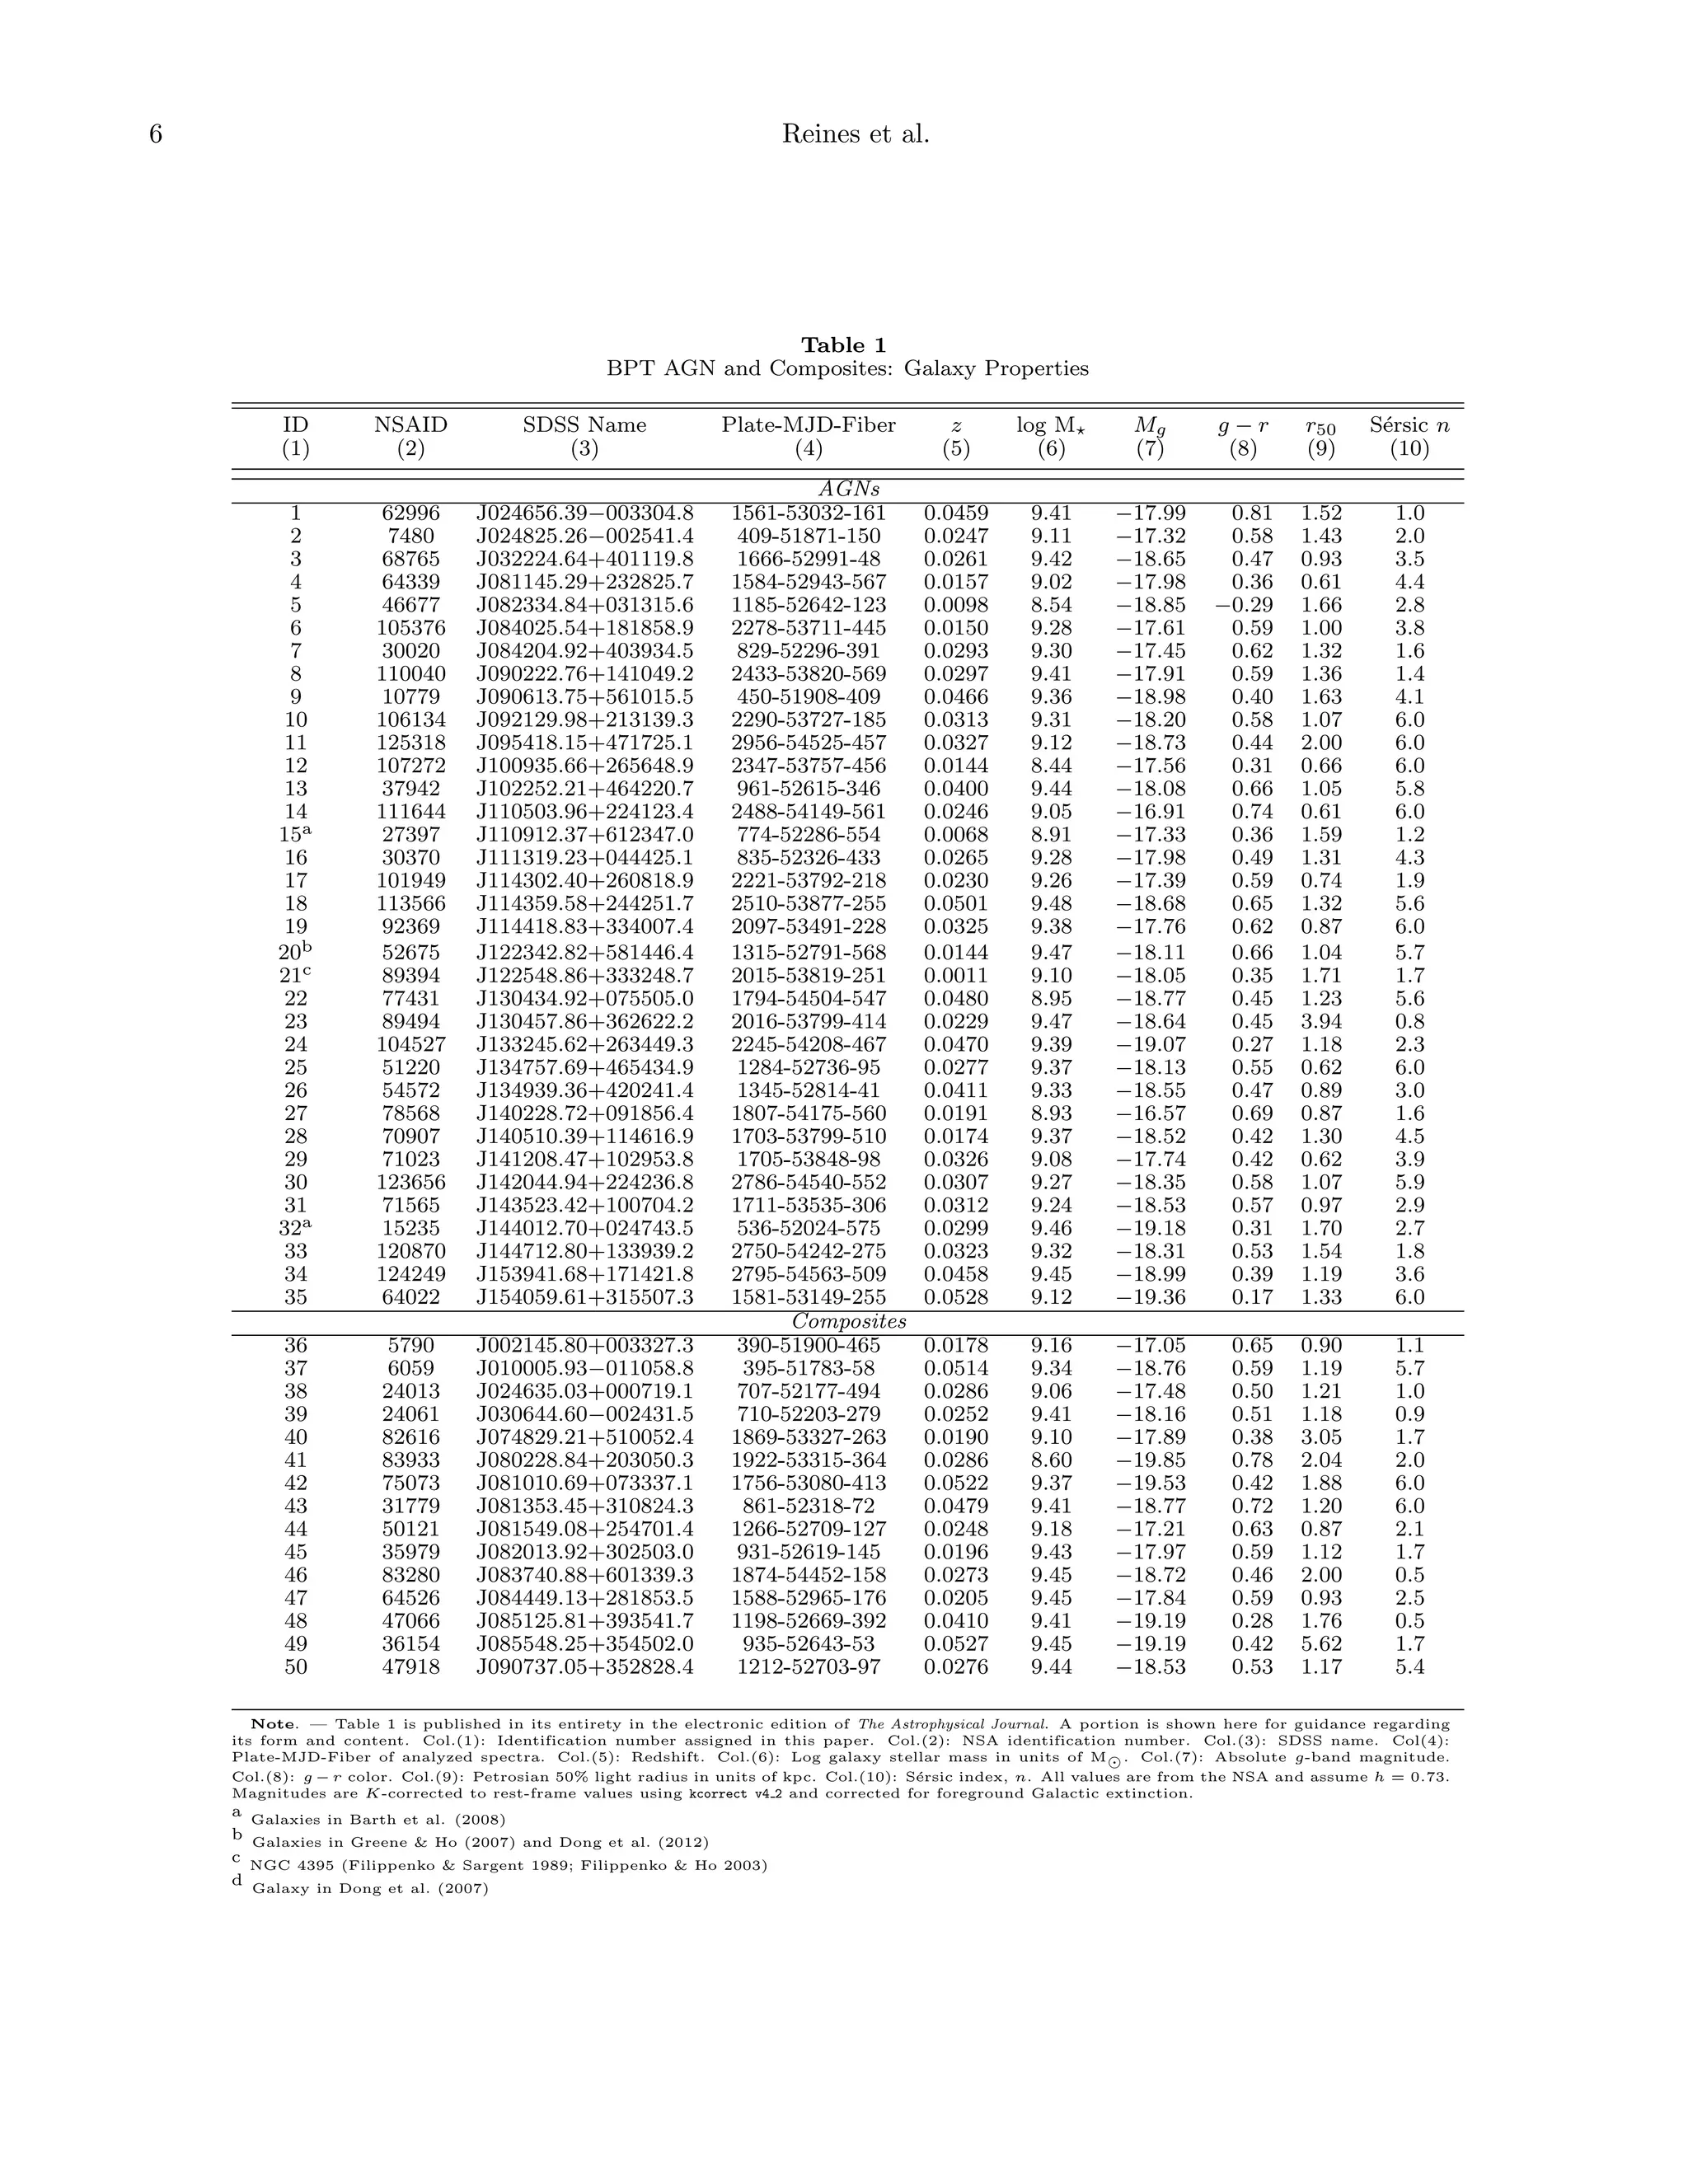
of an active massive BH (Figure 1, Tables 1 and 2).
There are 35 galaxies with narrow-line ratios falling in
the AGN-dominated region of the BPT diagram and 101
galaxies with composite spectra. While we consider the
BPT-AGN more secure5 , the composite spectra likely indicate at least some contribution from an AGN (Trouille
et al. 2011; Jia et al. 2011), which for our purposes
is sufficient for tentatively identifying the presence of
a massive BH. Even with our inclusive approach, only
∼ 0.5% (136/25974) of dwarf emission-line galaxies in
our parent sample exhibit optical narrow-line signatures
of photoionization from an accreting BH (although see
the discussion in Section 5 for a number of caveats).
We also investigate the positions of AGNs and composite galaxies according to the [O III]/Hβ vs. [N II]/Hα diagram in two secondary diagnostic diagrams, [O III]/Hβ
vs. [S II]/Hα and [O III]/Hβ vs. [O I]/Hα (Figure 2).
[O I]/Hα is particularly useful as it is sensitive to the
hardness of the ionizing radiation field (e.g., Kewley et al.
5 The left-most red point in Figure 1 corresponds to a bright offnuclear source in a blue late-type irregular dwarf galaxy, that may
in fact be an extreme H II region. While we cannot exclude the
possibility that this source is a low-metallicity active massive BH,
we consider it rather suspect in the absence of other supporting
evidence.](https://image.slidesharecdn.com/dwarfgalaxieswithopticalsignaturesofactivemassiveblackholes-140109062630-phpapp01/75/Dwarf-galaxies-with_optical_signatures_of_active_massive_black_holes-5-2048.jpg)
![Dwarf Galaxies with Active Massive Black Holes
7
Table 2
BPT AGN and Composites: Emission Line Fluxes
ID
(1)
(Hβ)n
(2)
(Hβ)b
(3)
1
2
3
4
5
6
7
8
9
10
11
12
13
14
15
16
17
18
19
20
21
22
23
24
25
26
27
28
29
30
31
32
33
34
35
11(3)
13(3)
100(11)
82(6)
5813(69)
101(6)
13(2)
19(3)
151(13)
34(3)
510(20)
336(8)
22(4)
15(3)
93(5)
33(4)
125(9)
22(4)
23(6)
211(13)
3314(47)
16(3)
39(5)
539(22)
151(9)
93(8)
32(4)
81(7)
63(6)
33(5)
156(8)
832(19)
23(3)
180(6)
470(20)
···
···
···
···
···
···
···
···
79(12)
···
···
···
···
···
···
···
···
···
···
495(37)
893(39)
···
···
···
···
···
···
···
···
···
···
132(15)
···
···
···
36
37
38
39
40
41
42
43
44
45
46
47
48
49
50
52(4)
299(23)
14(3)
35(4)
19(3)
83(8)
327(44)
41(5)
109(14)
18(5)
24(4)
27(4)
169(7)
8(3)
107(7)
···
···
···
···
···
···
···
···
···
···
···
···
···
···
···
[O III]λ5007
(4)
[O I]λ6300
(5)
29(3)
52(5)
1119(61)
460(75)
49827(429)
515(11)
62(4)
58(15)
1398(34)
155(6)
2433(44)
3048(87)
56(6)
109(6)
660(11)
171(6)
459(13)
120(23)
154(18)
2477(49)
32481(394)
140(6)
215(7)
3905(67)
1034(183)
691(16)
202(6)
353(11)
516(12)
142(6)
682(33)
7136(94)
72(6)
906(38)
2233(90)
···
···
45(3)
57(6)
144(6)
20(4)
···
13(4)
121(10)
···
179(10)
226(6)
···
···
40(3)
···
47(6)
···
27(5)
120(10)
3542(49)
···
18(3)
238(15)
78(8)
26(7)
26(3)
56(7)
55(5)
···
30(8)
375(13)
18(6)
15(4)
90(5)
115(4)
878(101)
18(4)
40(5)
86(5)
71(10)
618(47)
36(5)
118(9)
27(6)
13(4)
32(5)
438(10)
18(4)
350(10)
27(3)
64(5)
···
···
6(2)
···
18(5)
···
38(6)
···
···
16(4)
31(5)
0()
25(6)
[N II]λ6548
(6)
(Hα)n
(7)
AGNs
8(1)
34(6)
6(1)
61(3)
44(5)
418(45)
28(2)
299(7)
100(2) 20342(193)
22(1)
313(8)
13(1)
62(5)
29(2)
90(7)
68(5)
530(42)
17(1)
131(5)
188(7)
1643(66)
90(2)
1199(16)
20(2)
77(7)
10(1)
63(5)
21(1)
327(6)
8(1)
128(4)
121(6)
535(12)
17(2)
94(5)
33(3)
117(11)
52(4)
1604(82)
777(11) 13026(162)
42(4)
48(4)
23(1)
128(4)
317(13)
2048(83)
671(21)
597(13)
102(5)
344(10)
22(1)
158(4)
42(2)
299(9)
82(3)
280(7)
9(1)
87(4)
49(3)
581(12)
448(8)
3496(66)
49(4)
79(7)
47(2)
597(10)
118(5)
1661(64)
Composites
40(1)
212(4)
105(8)
1113(83)
5(1)
43(6)
17(1)
134(5)
5(1)
82(4)
65(5)
362(12)
161(22)
1260(168)
20(2)
133(6)
66(8)
495(59)
9(1)
61(5)
15(1)
97(4)
18(1)
133(5)
61(2)
518(11)
4(1)
48(3)
42(2)
358(9)
(Hα)b
(8)
[N II]λ6583
(9)
[S II]λ6716
(10)
[S II]λ6731
(11)
56(9)
···
···
···
···
···
···
···
322(14)
···
118(16)
···
···
···
···
···
···
···
···
3195(50)
6167(73)
···
···
···
···
···
···
···
···
···
···
301(36)
···
···
···
25(4)
19(3)
130(6)
82(5)
296(5)
66(4)
38(4)
87(7)
202(10)
50(3)
557(18)
265(5)
60(6)
30(4)
63(2)
25(2)
357(17)
50(6)
98(9)
153(11)
2300(30)
125(12)
68(4)
937(27)
1985(63)
303(16)
64(3)
124(7)
241(10)
27(4)
146(10)
1326(19)
145(12)
138(5)
351(8)
8(2)
14(3)
64(8)
74(5)
520(9)
71(5)
25(3)
43(5)
97(9)
47(4)
267(16)
233(5)
45(6)
21(4)
87(3)
34(3)
84(6)
23(4)
43(6)
98(7)
2434(35)
29(4)
52(4)
394(18)
165(8)
74(6)
53(3)
102(7)
82(5)
21(4)
62(6)
502(11)
53(5)
90(4)
310(13)
6(1)
11(2)
67(11)
68(4)
420(6)
50(3)
20(2)
31(3)
79(13)
30(2)
251(26)
182(4)
33(4)
13(2)
72(2)
22(2)
83(4)
16(2)
32(4)
101(6)
2994(59)
18(2)
37(2)
367(22)
124(5)
61(4)
41(2)
73(4)
64(4)
21(3)
51(4)
495(15)
42(4)
66(3)
228(12)
···
···
···
···
···
···
···
···
···
···
···
···
137(18)
···
···
119(4)
312(16)
15(2)
51(4)
16(2)
191(15)
477(45)
59(5)
197(35)
28(4)
44(4)
53(4)
180(6)
13(2)
125(6)
67(3)
216(26)
15(3)
34(3)
20(3)
88(9)
102(18)
36(4)
140(26)
22(4)
26(3)
38(4)
110(5)
16(2)
93(6)
49(2)
160(33)
11(2)
28(3)
13(2)
53(6)
98(30)
22(3)
106(34)
25(4)
15(2)
22(3)
75(3)
10(1)
73(4)
Note. — Table 2 is published in its entirety in the electronic edition of The Astrophysical Journal. A portion is shown here for guidance regarding its form and content.
Col.(1): Identification number assigned in this paper. Col.(2)-(11): Emission line fluxes with units of 10−17 erg s−1 cm−2 . Errors are shown in parenthesis. No
extinction correction has been applied. The subscripts n and b refer to the narrow and broad components of the line, respectively. A three-dot ellipsis indicates that no
line is detected. In the cases where a broad component of Hα or Hβ is detected, we use the flux of the narrow component to calculate the emission line ratios for the
BPT diagram.](https://image.slidesharecdn.com/dwarfgalaxieswithopticalsignaturesofactivemassiveblackholes-140109062630-phpapp01/75/Dwarf-galaxies-with_optical_signatures_of_active_massive_black_holes-7-2048.jpg)
![8
Reines et al.
2006), although [O I] is relatively weak and not detected
in ∼50% of the AGNs + composites (Table 2). Figure
2 shows that nearly all of the [N II]/Hα AGN fall in the
Seyfert region of the secondary diagnostic diagrams, with
at most 3 falling in the LINER part of the diagrams. The
[N II]/Hα composites fall throughout the [S II]/Hα and
[O I]/Hα diagrams.
The SDSS spectra of the BPT-AGN are shown in Figures 3 and 4 with the continuum and absorption line
models over-plotted in blue. Our sample of BPT-AGN
includes NGC 4395 and 2 galaxies from the low-mass
Seyfert 2 sample of Barth et al. (2008). The remaining
galaxies in Barth et al. (2008) do not meet the selection
criteria to be included in our parent dwarf galaxy sample (§2). Due to the large number of composites, we do
not show their spectra here. However, we have inspected
all of the individual spectra flagged as composites by eye
and cut sources with unreliable emission line measurements due to low signal-to-noise. Twenty objects were
excluded, leaving a final sample of 101 composites.
3.4. Broad-Line AGN Candidates
We also search for broad Hα emission in our parent
sample of galaxies, which may indicate dense gas orbiting a BH within the broad-line region (BLR), only
light-days from the central BH (e.g., Peterson et al. 2004,
2005; Bentz et al. 2009b). Unobscured quasars powered
by ∼ 108 M BHs have typical line-widths of ∼3000 km
s−1 (e.g., Shen et al. 2008). However, in AGNs with lowmass BHs (MBH 106.5 M ), the line-widths can be just
hundreds of km s−1 (e.g., Filippenko & Ho 2003; Greene
& Ho 2007a). While in principle broad emission lines
provide clear evidence that gas is moving in the potential of a compact massive object (e.g., Ho et al. 1997),
there are a few complications, particularly in this lowmass regime. First, Hα absorption from young stars can
mask or mimic the broad Hα, and thus accurate galaxy
continuum subtraction is required (Section 3.1; also see
Greene & Ho 2004). Second, some varieties of supernovae
(SNe) can masquerade as AGNs at low-luminosities (see
below).
Out of the 51 sources flagged as having a broad Hα
component in their spectra with a FWHM ≥ 500 km
s−1 (see §3.2), 25 make it into our final sample of broadline AGN candidates after a more careful examination of
each individual source. We detect broad Hβ, in addition
to broad Hα in 36% (9/25) of these sources (Tables 2
and 4). We have excluded 9 likely Type II SNe (most
having characteristic P Cygni profiles), 3 non-nuclear
star-forming knots in nearby galaxies (with low broad
Hα luminosities), 1 Luminous Blue Variable star identified by Izotov & Thuan (2009b, NSAID 5109), and 13
sources in the star-forming region of the BPT diagram
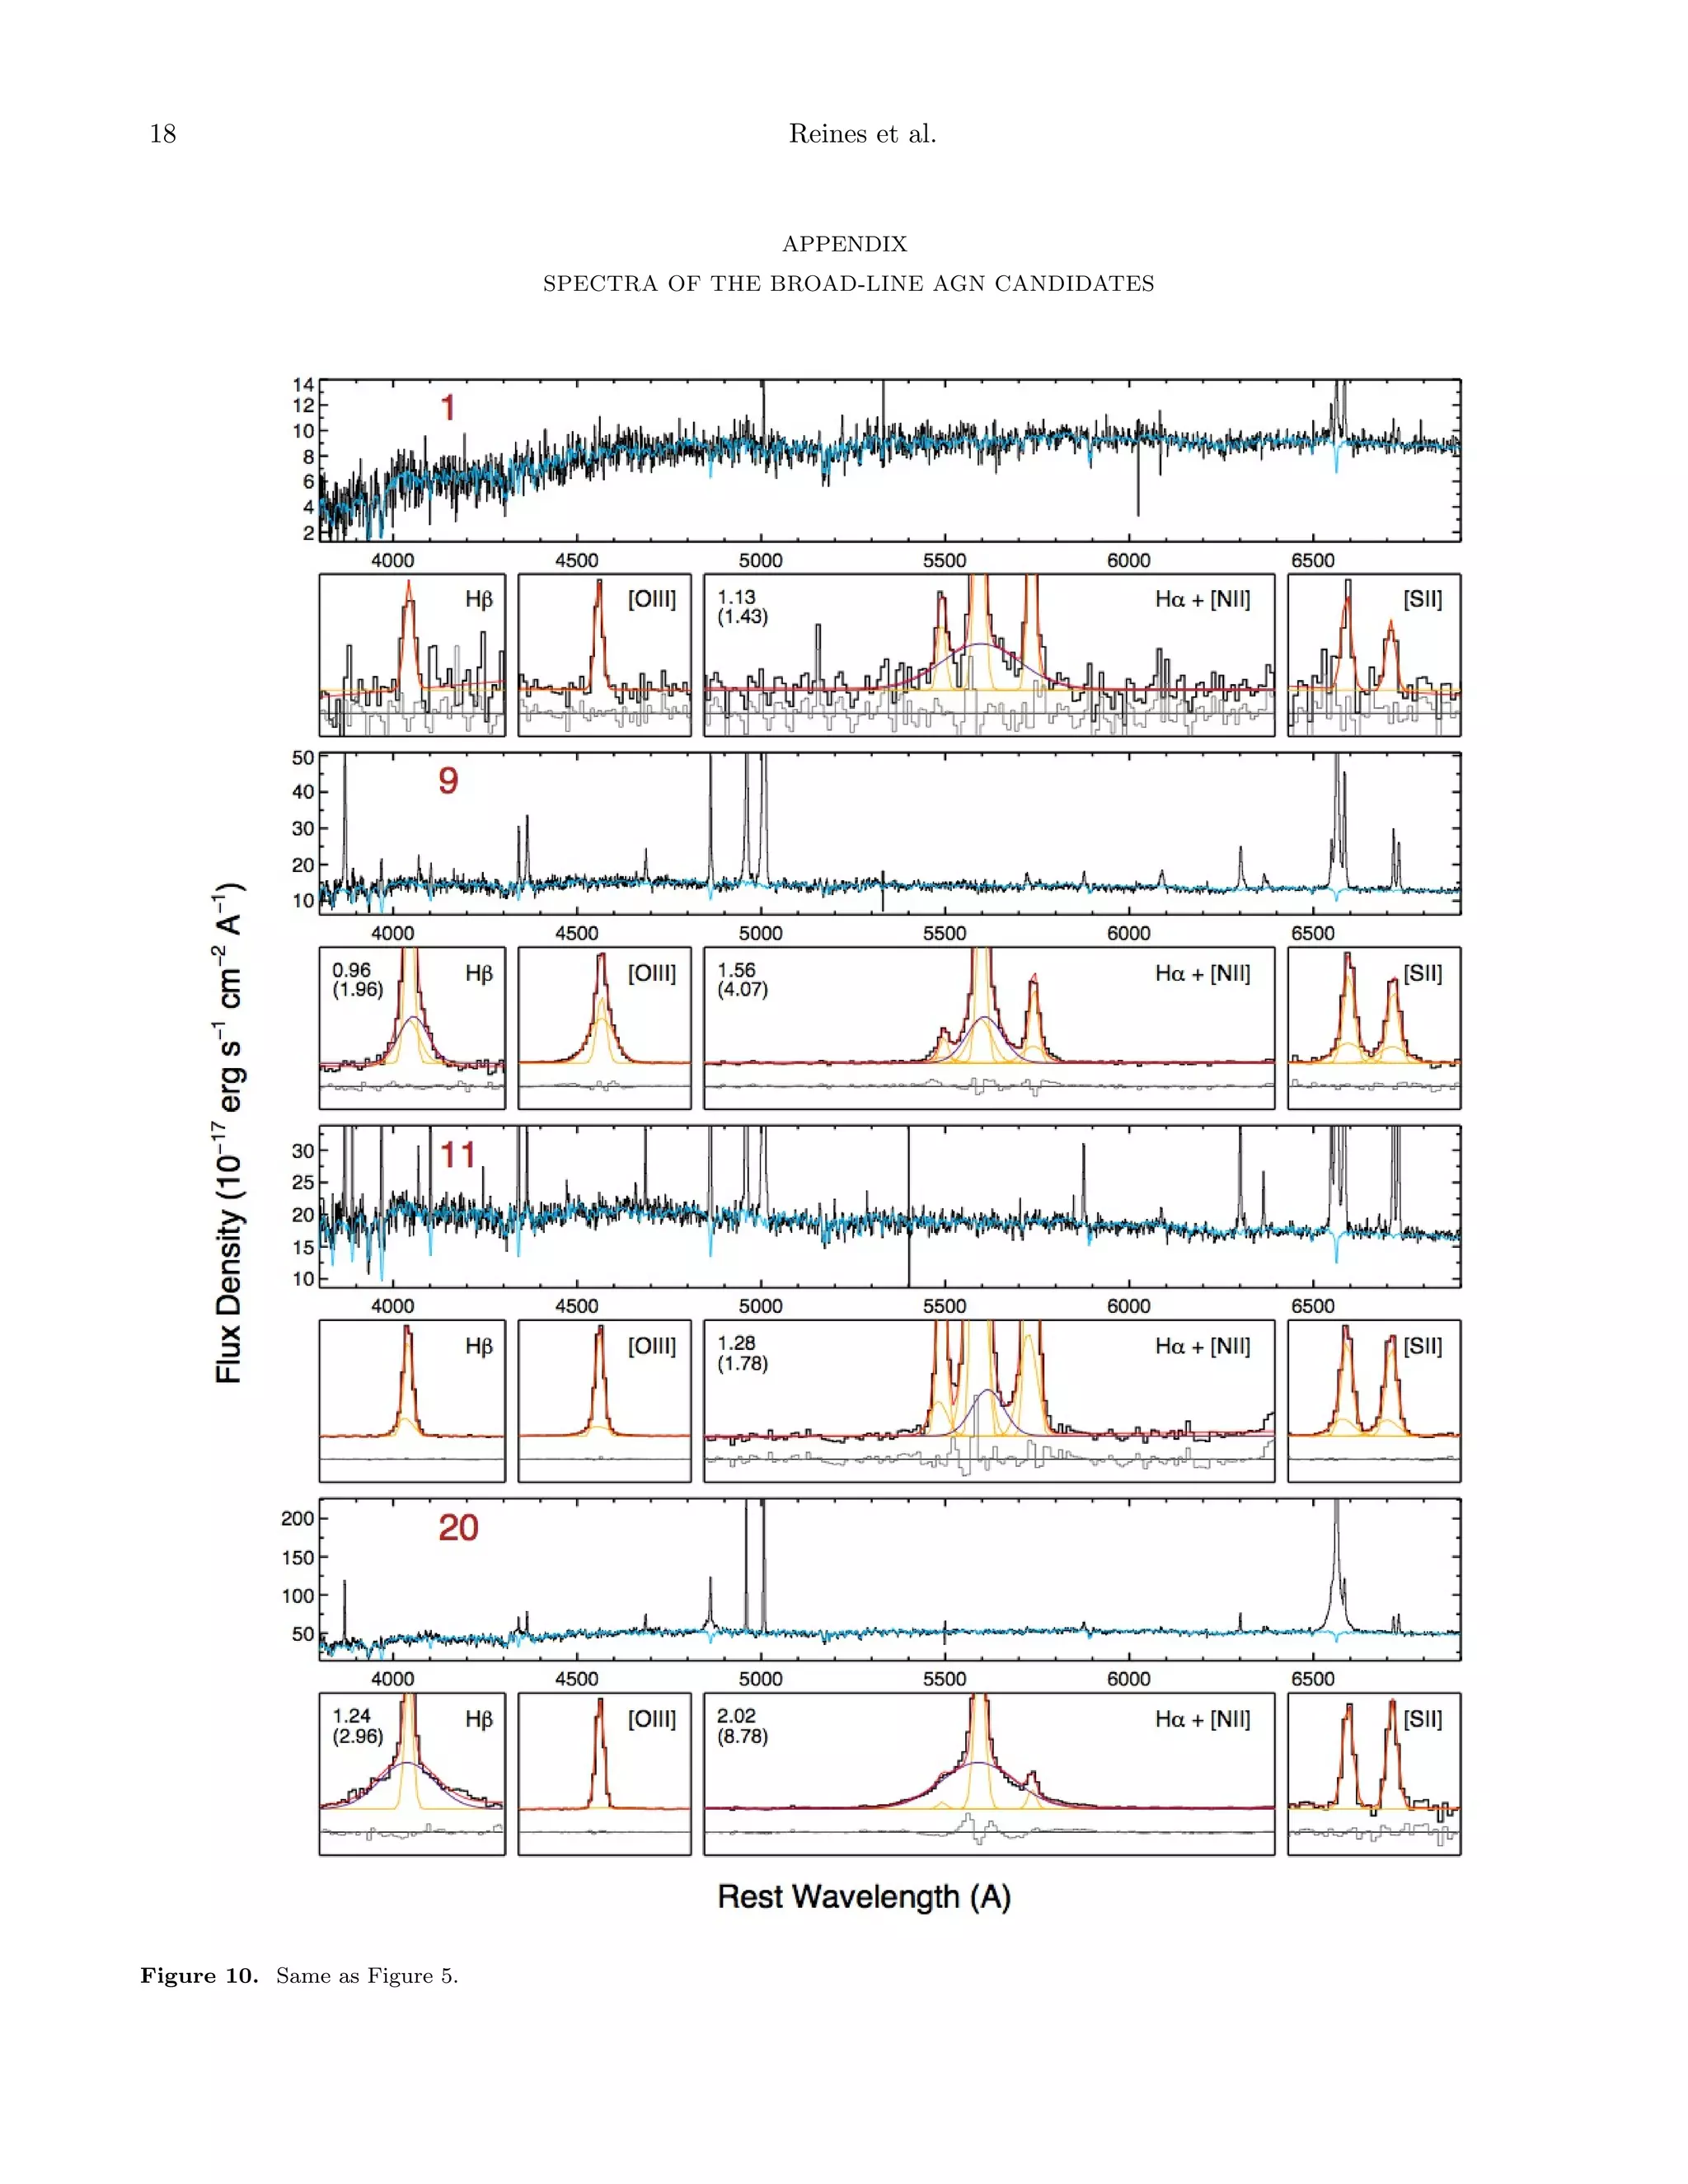
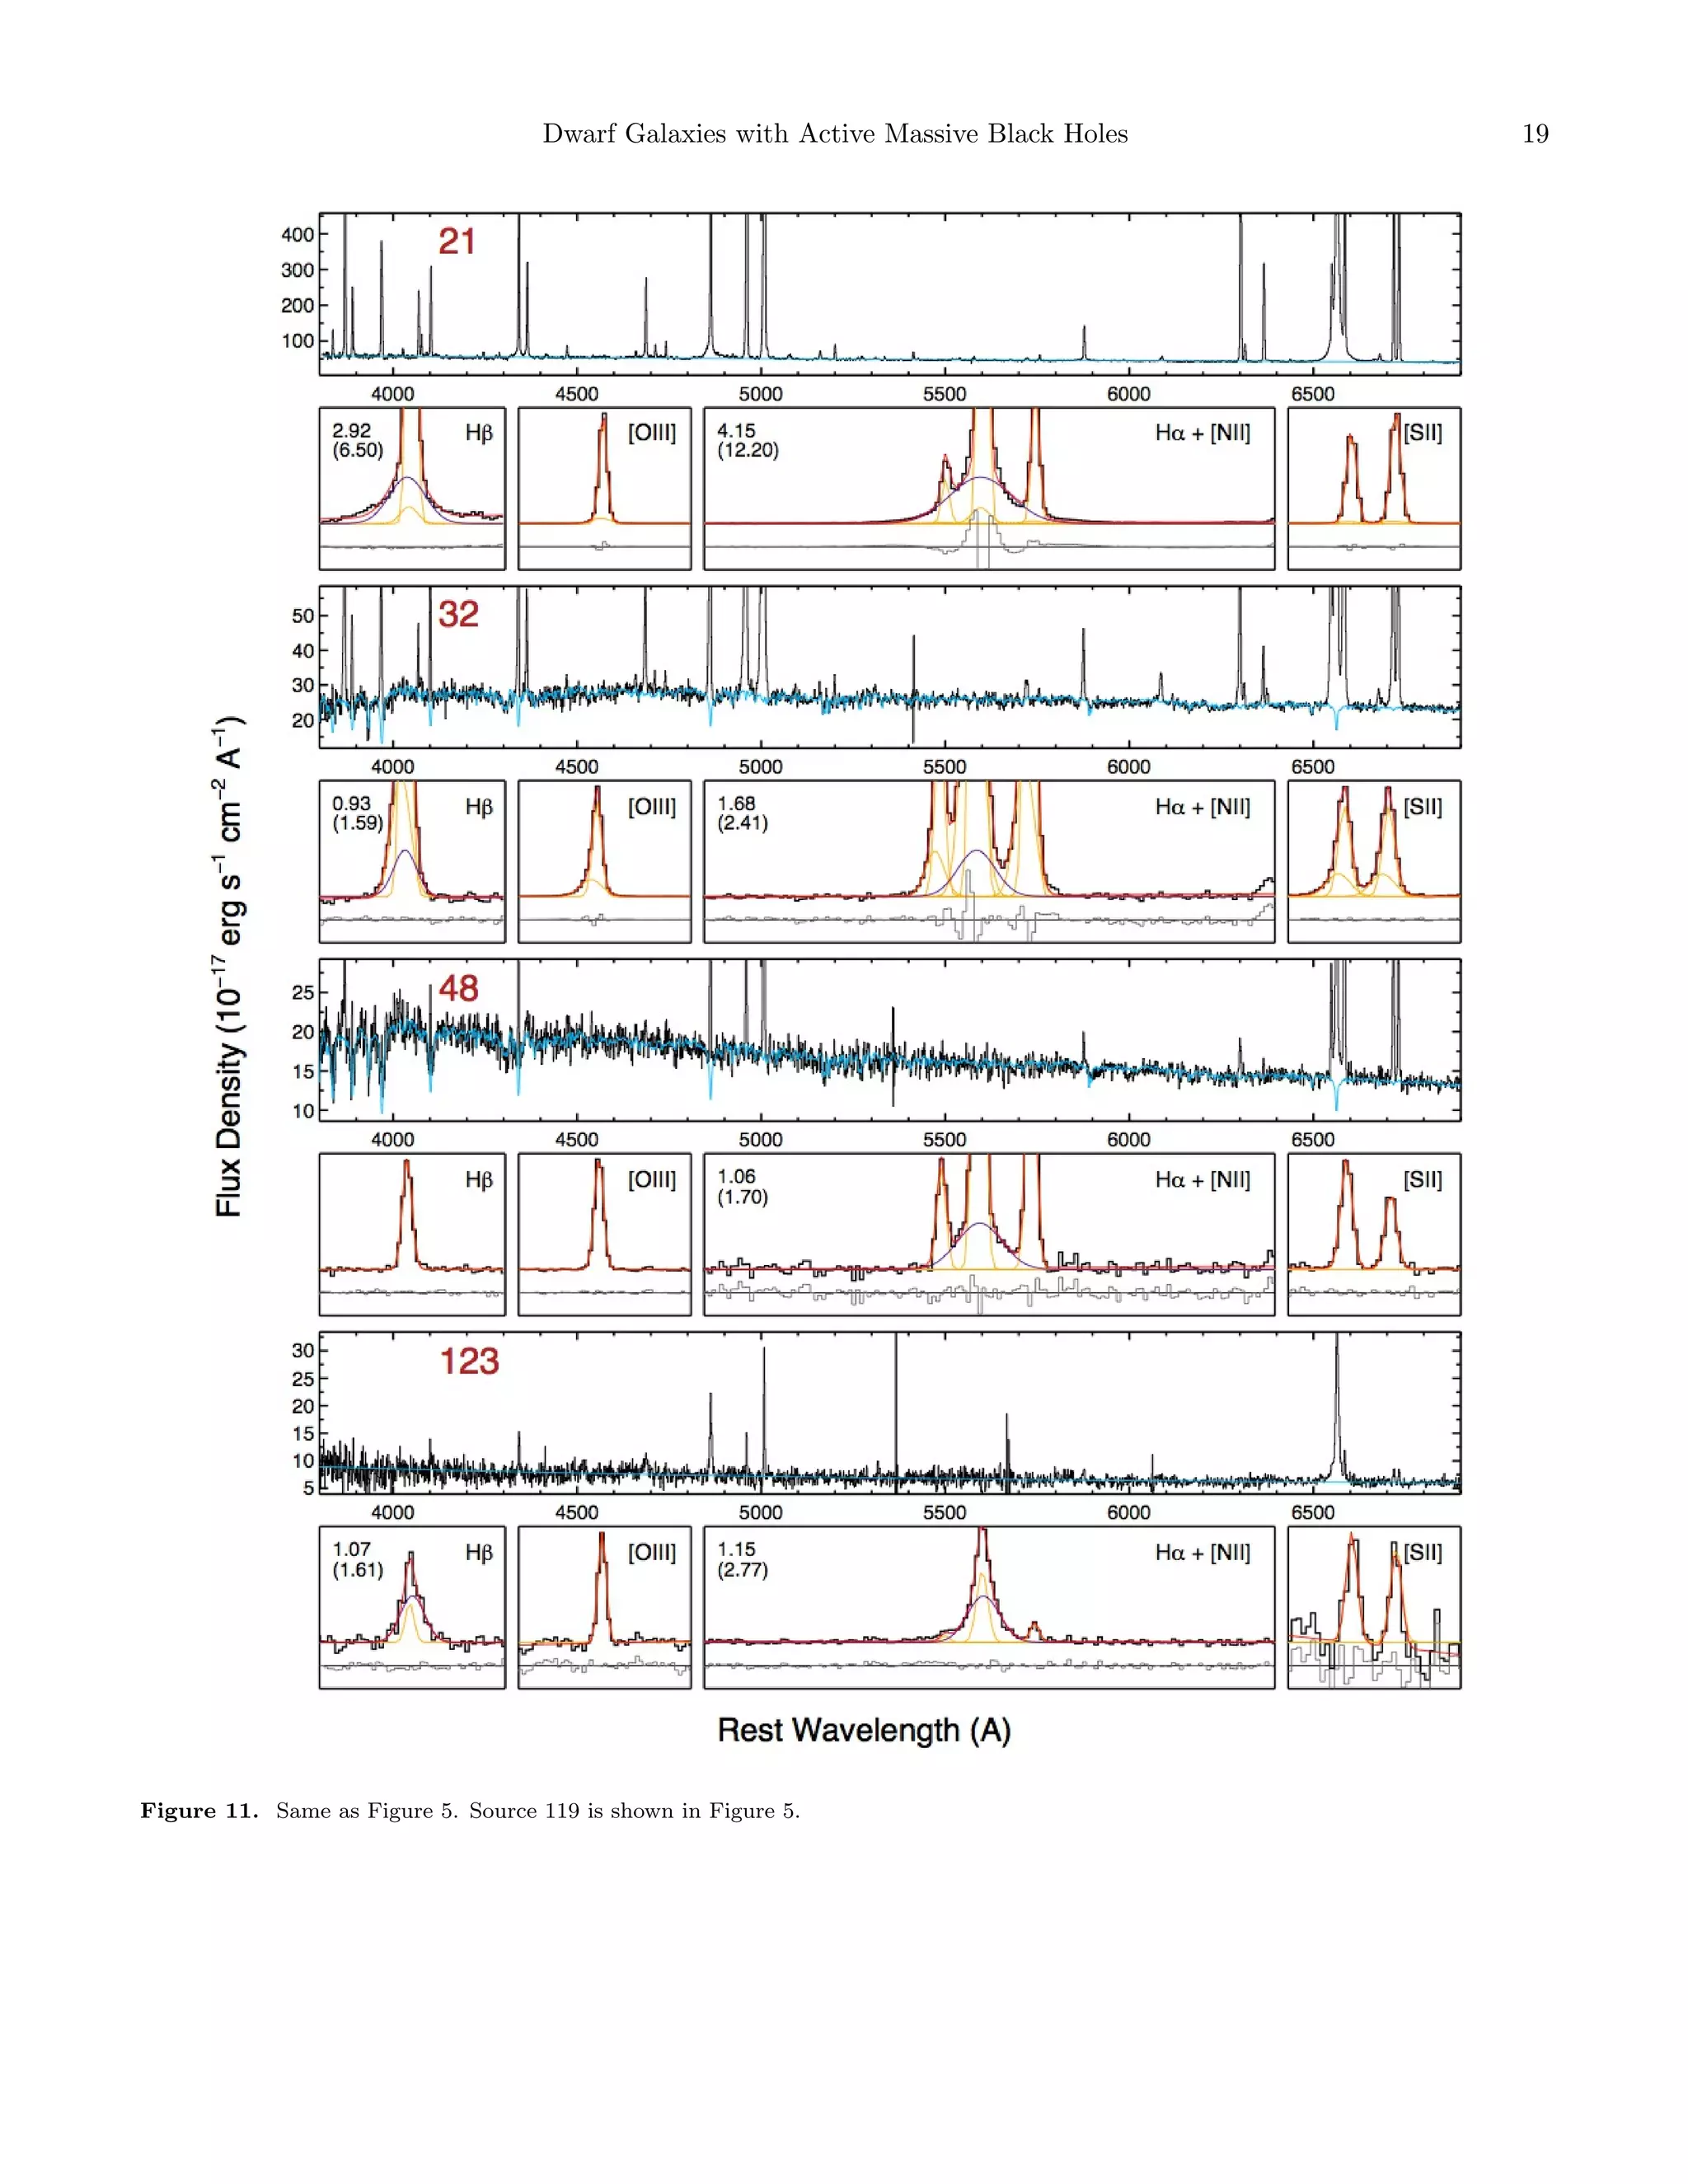
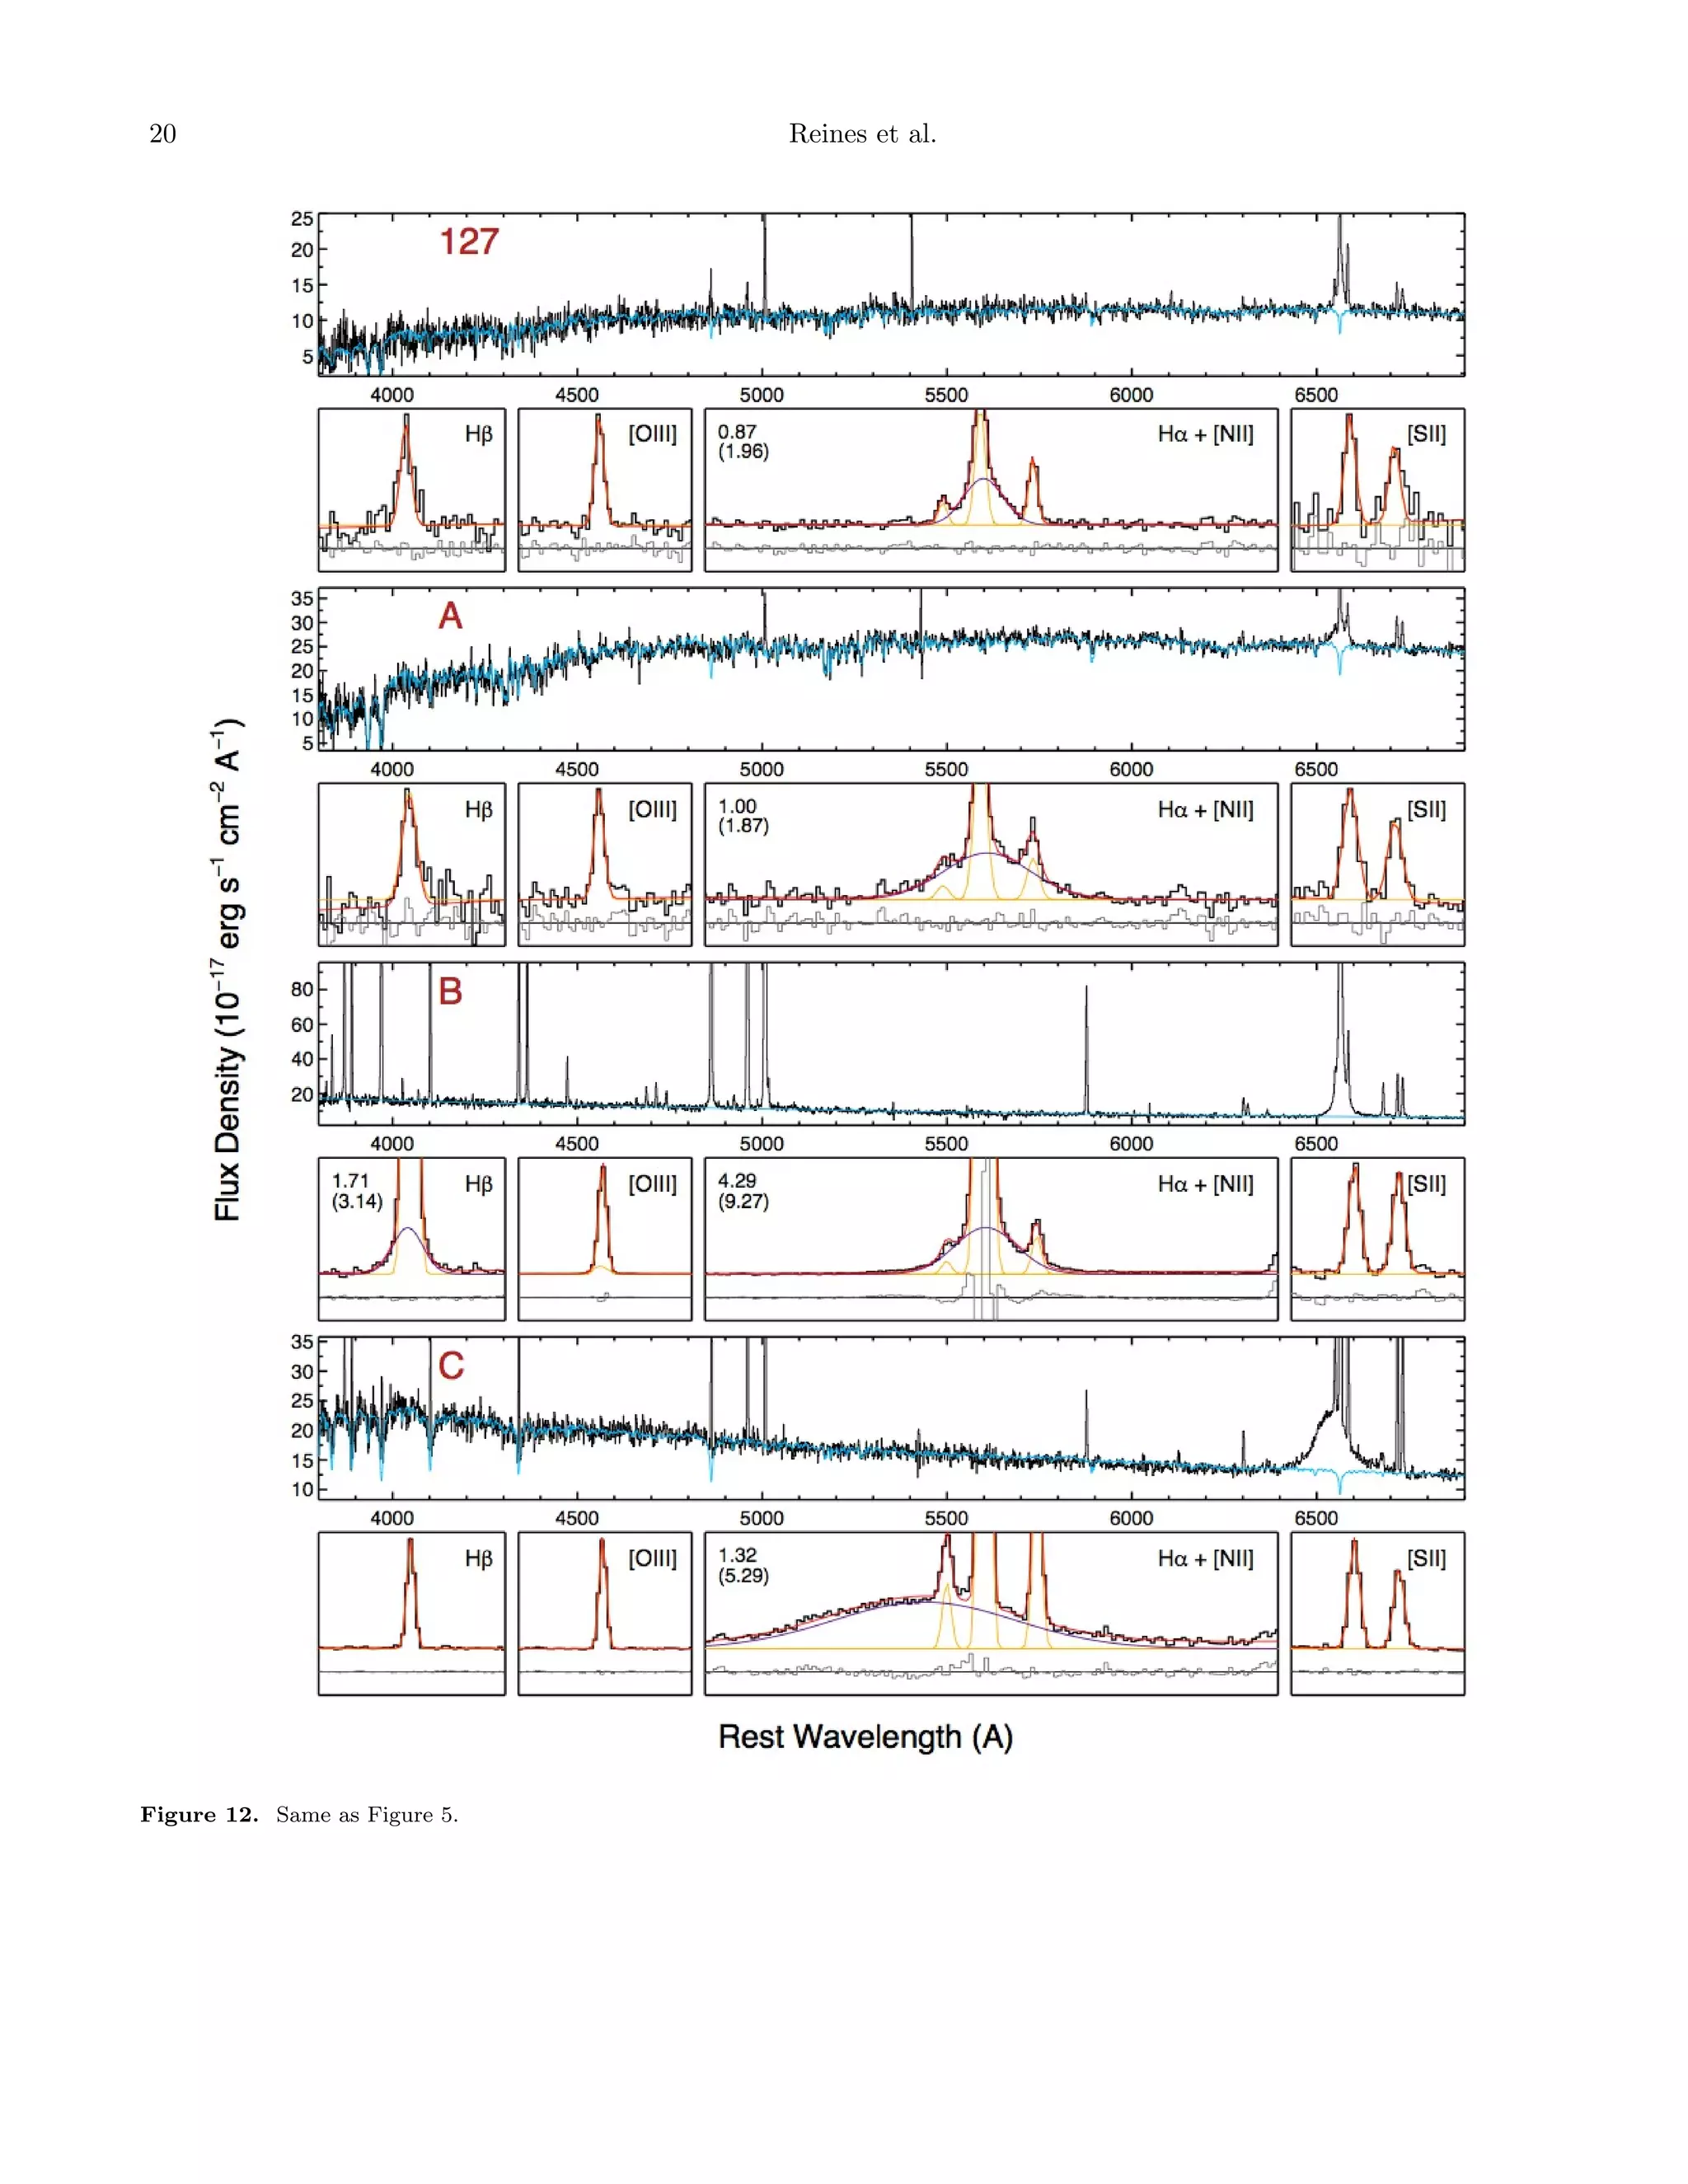
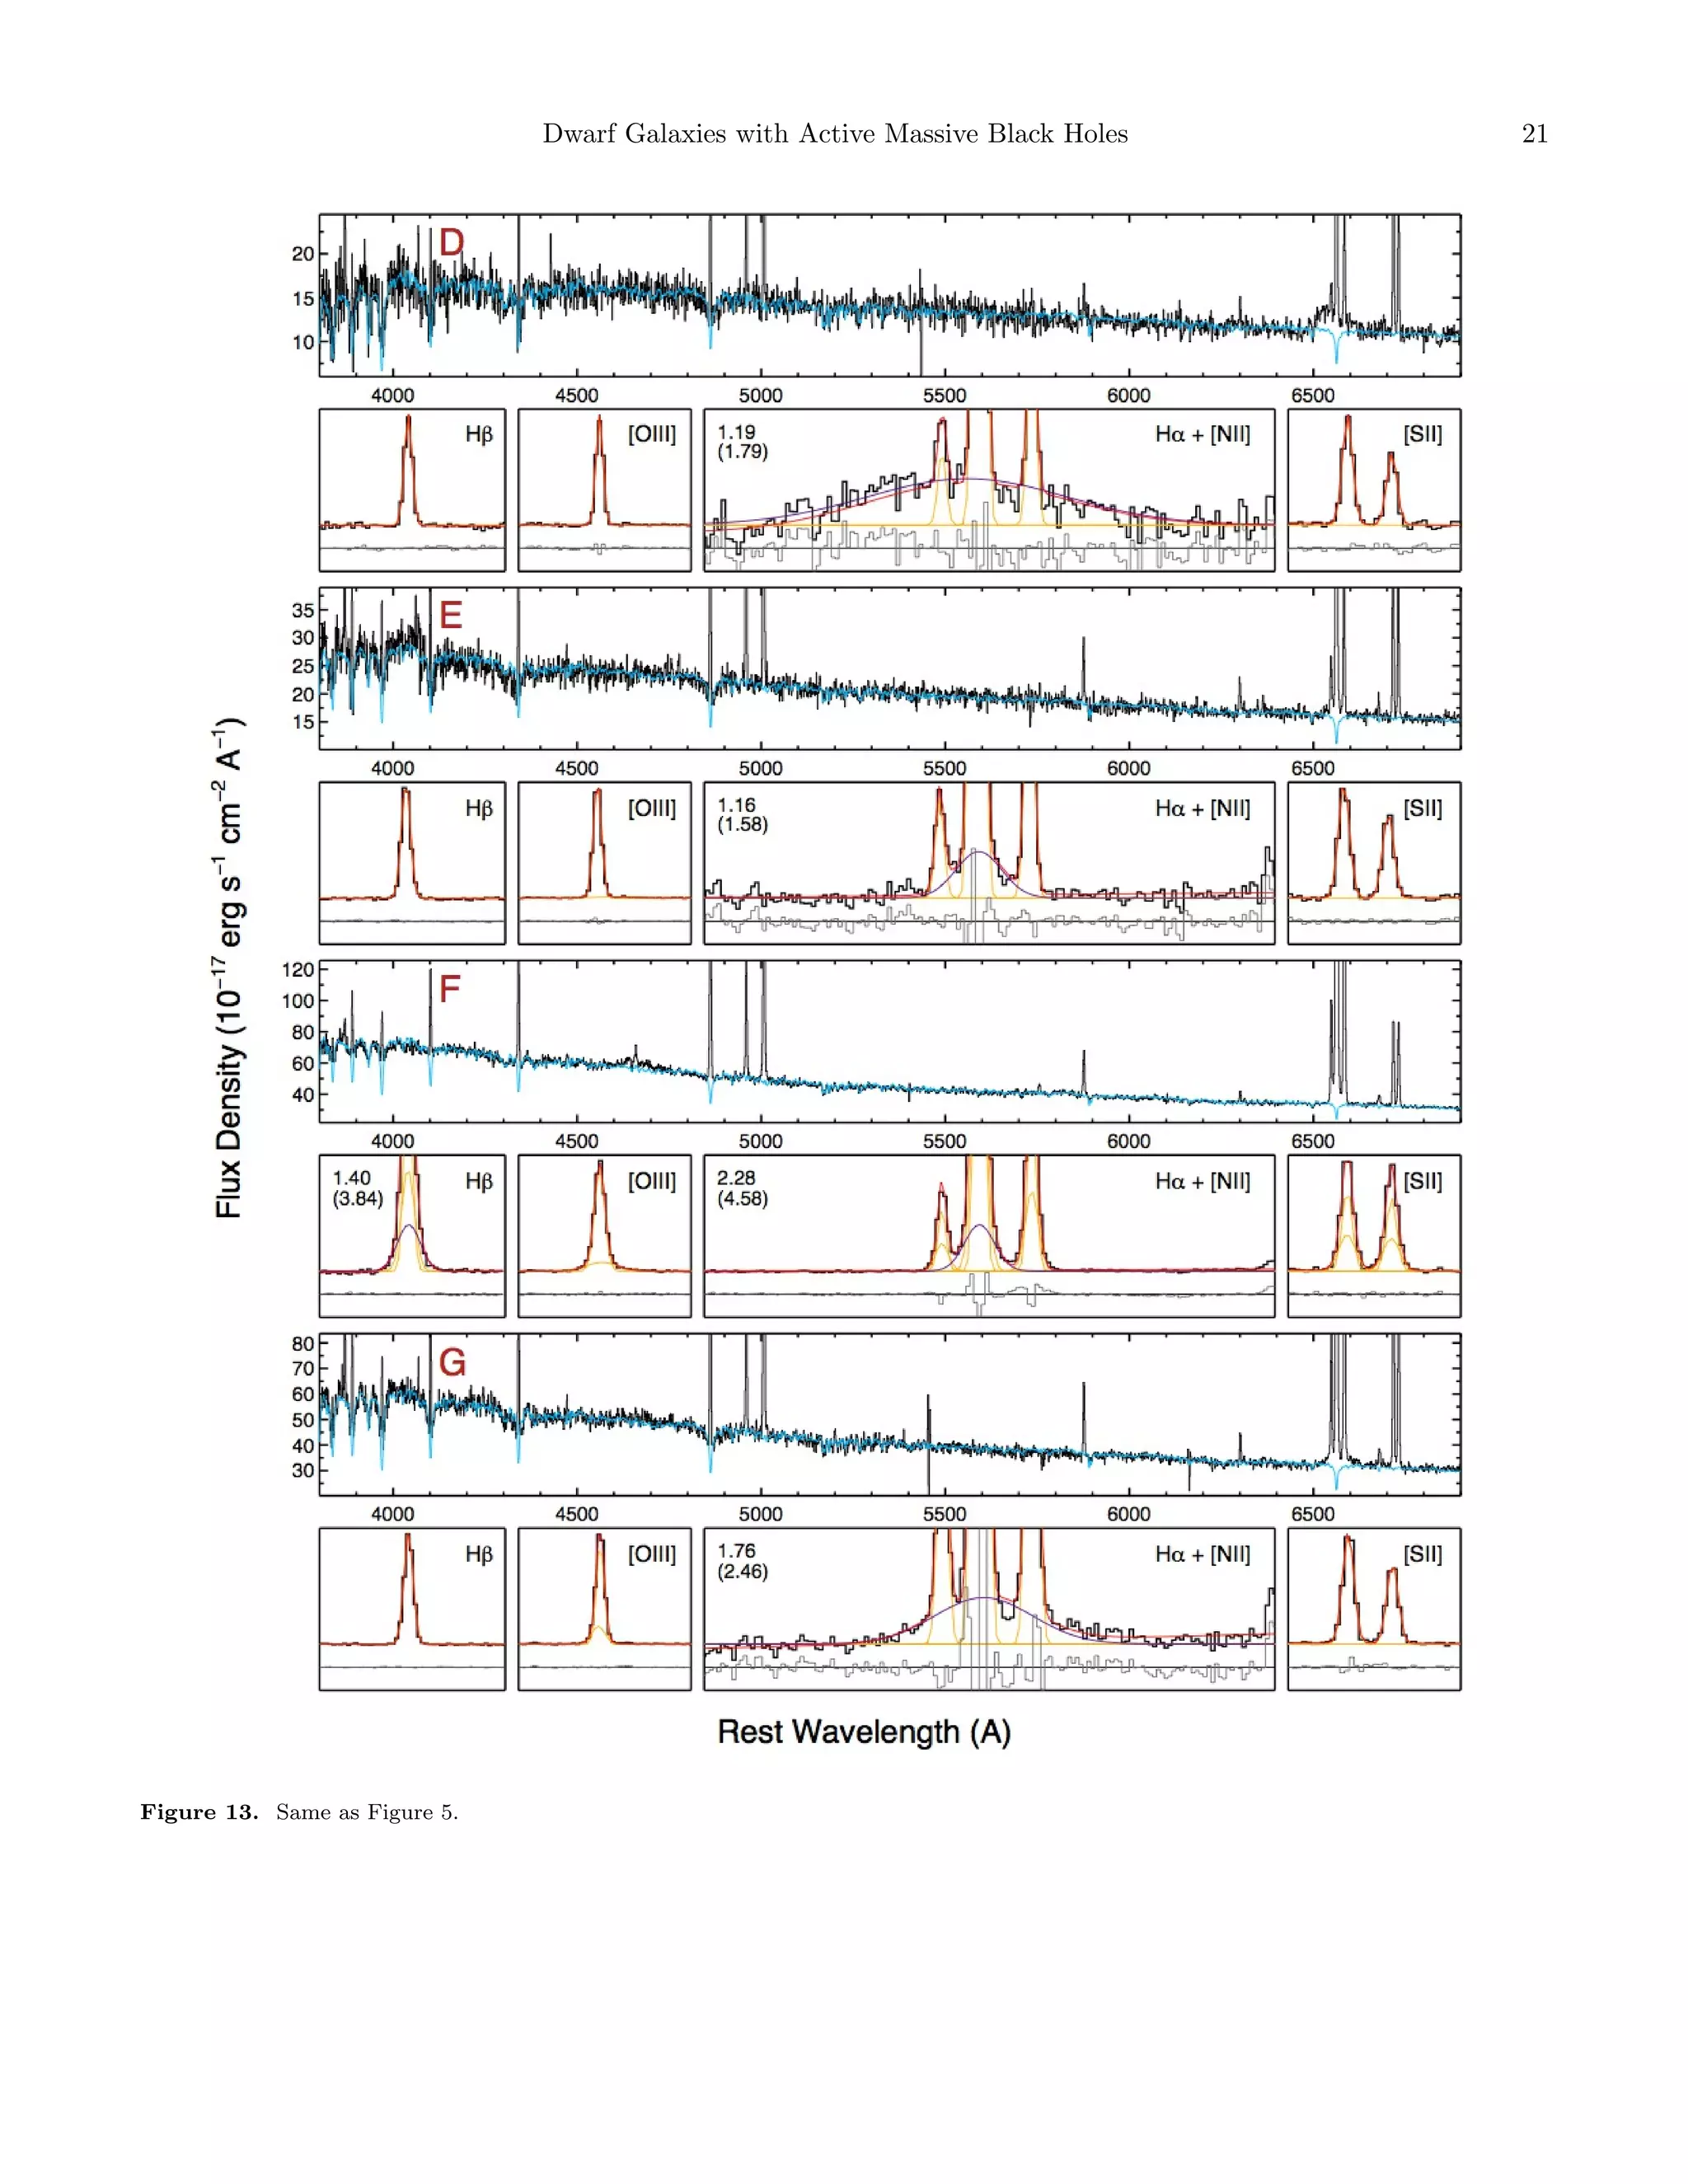
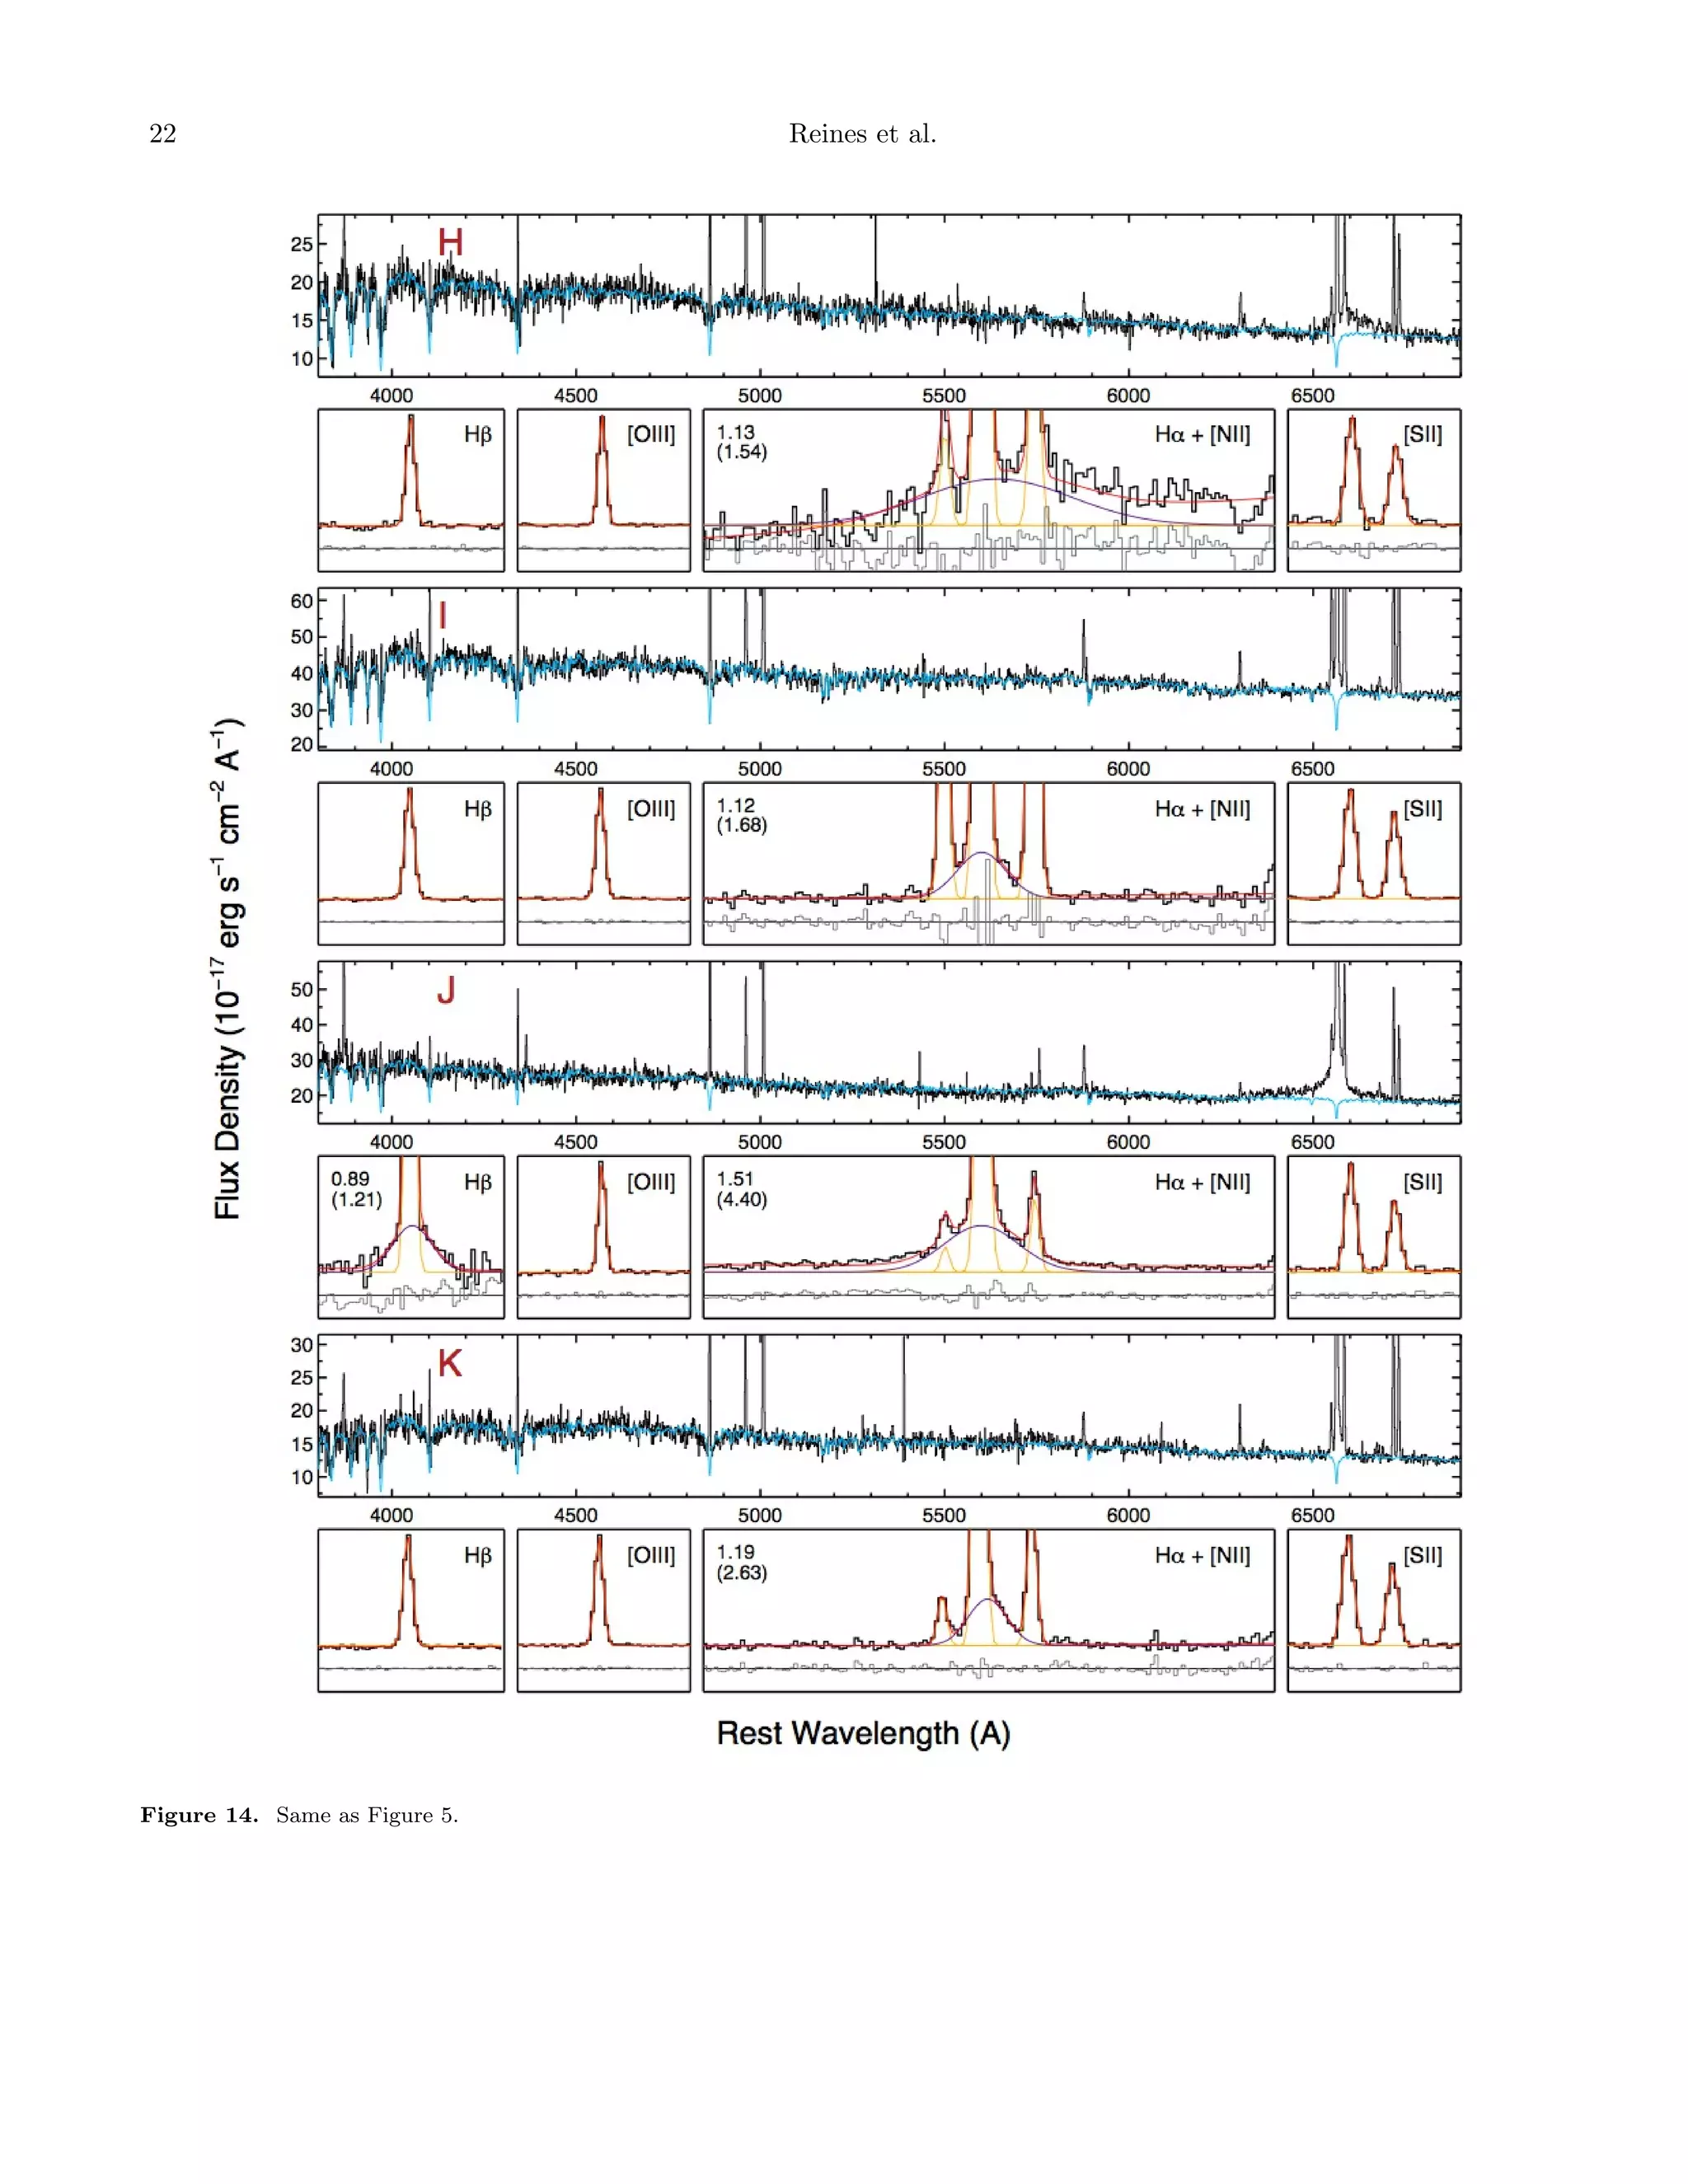
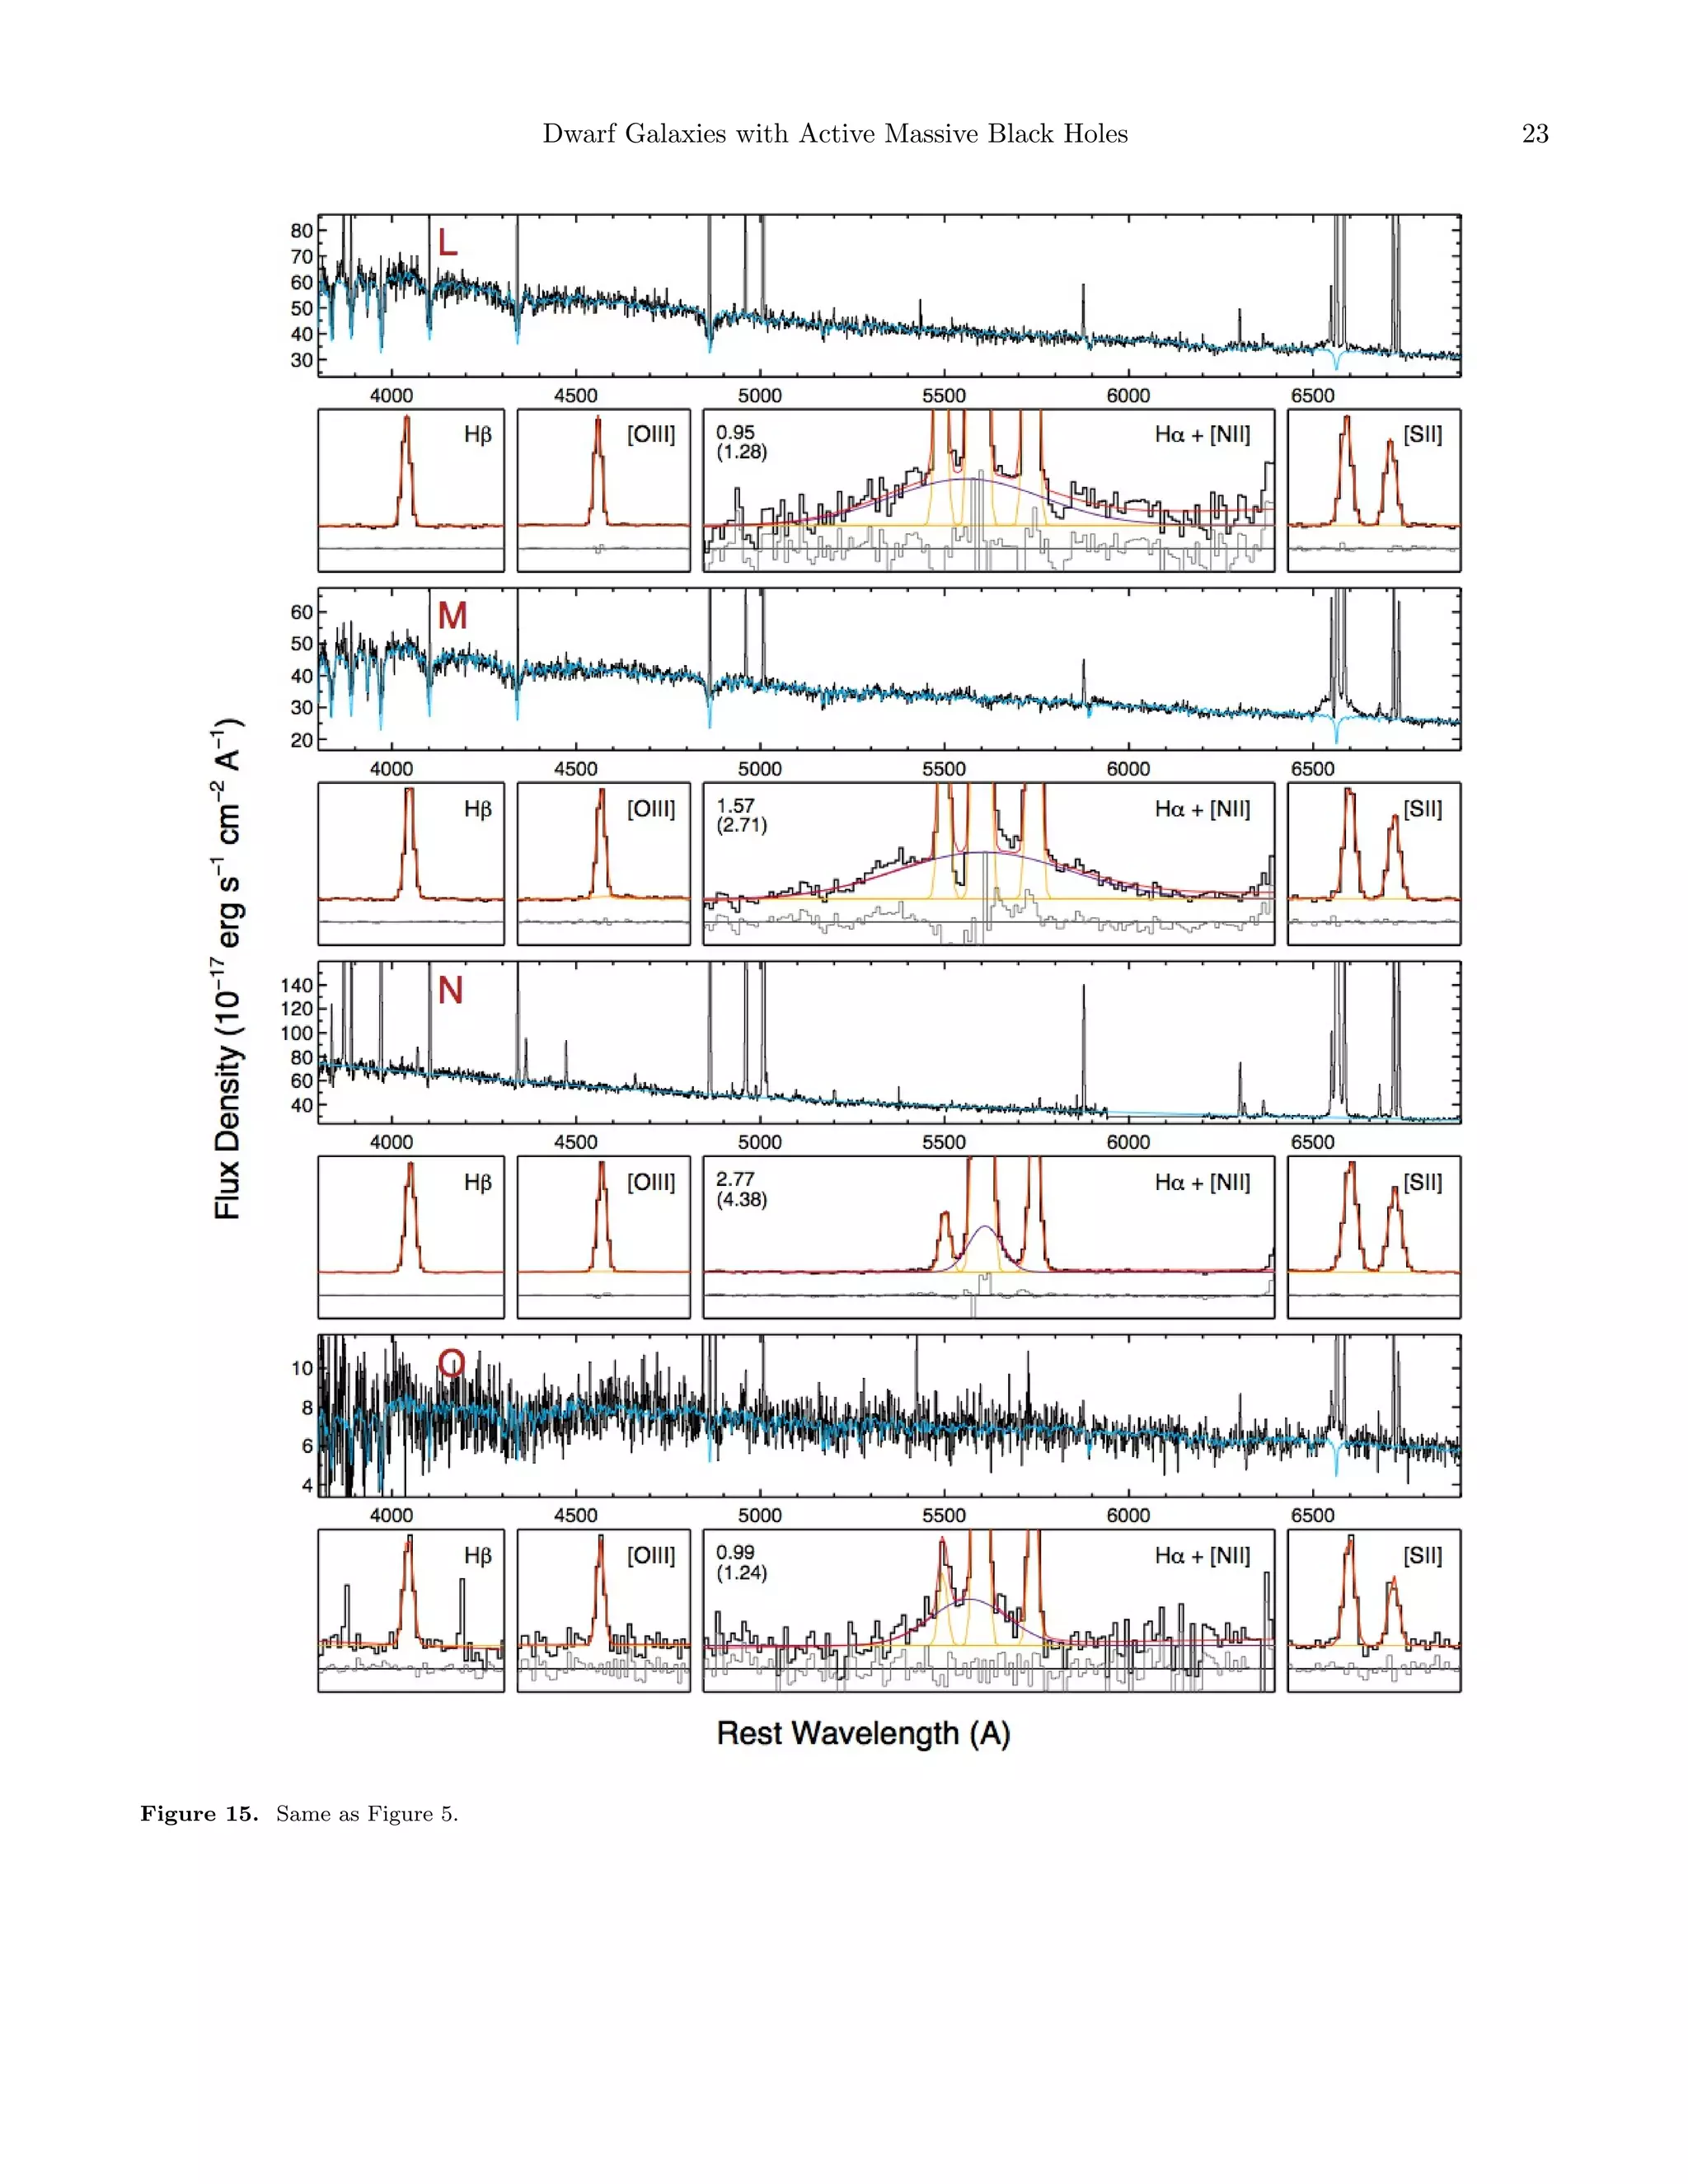
with marginal detections of broad Hα that are unconvincing by eye. Figure 5 shows the spectral fits for one
of our broad-line AGN candidates. Plots for the other
broad-line AGN candidates are shown in the Appendix.
Our broad-line sample includes NGC 4395, the dwarf
disk galaxy presented in Dong et al. (2007), and 4 galaxies from the samples of Greene & Ho (2007a) and Dong
et al. (2012). The remaining samples of low-mass BHs
in the latter two works are hosted in galaxies that do
not meet the selection criteria to be included in our
Figure 2. BPT narrow-line diagnostic diagrams for our sam-
ple of active galaxies. Regions are delineated according to the
classification scheme outlined in Kewley et al. (2006). Top:
[O III]/Hβ versus [N II]/Hα diagram. There are 35 galaxies
in the AGN part of the diagram (6 with broad Hα emission)
and 101 galaxies in the composite region of the diagram (4
with broad Hα emission). An additional 15 galaxies have
broad Hα emission, yet have HII-region-like narrow-line ratios. Middle: [O III]/Hβ versus [S II]/Hα diagram. Colors
indicate classification based on the OIII/Hβ versus [N II]/Hα
diagram. Bottom: [O III]/Hβ versus [O I]/Hα diagram for
galaxies in which we detect the [O I] emission line (Tables 2
and 4). Colors indicate classification based on the OIII/Hβ
versus [N II]/Hα diagram.](https://image.slidesharecdn.com/dwarfgalaxieswithopticalsignaturesofactivemassiveblackholes-140109062630-phpapp01/75/Dwarf-galaxies-with_optical_signatures_of_active_massive_black_holes-8-2048.jpg)
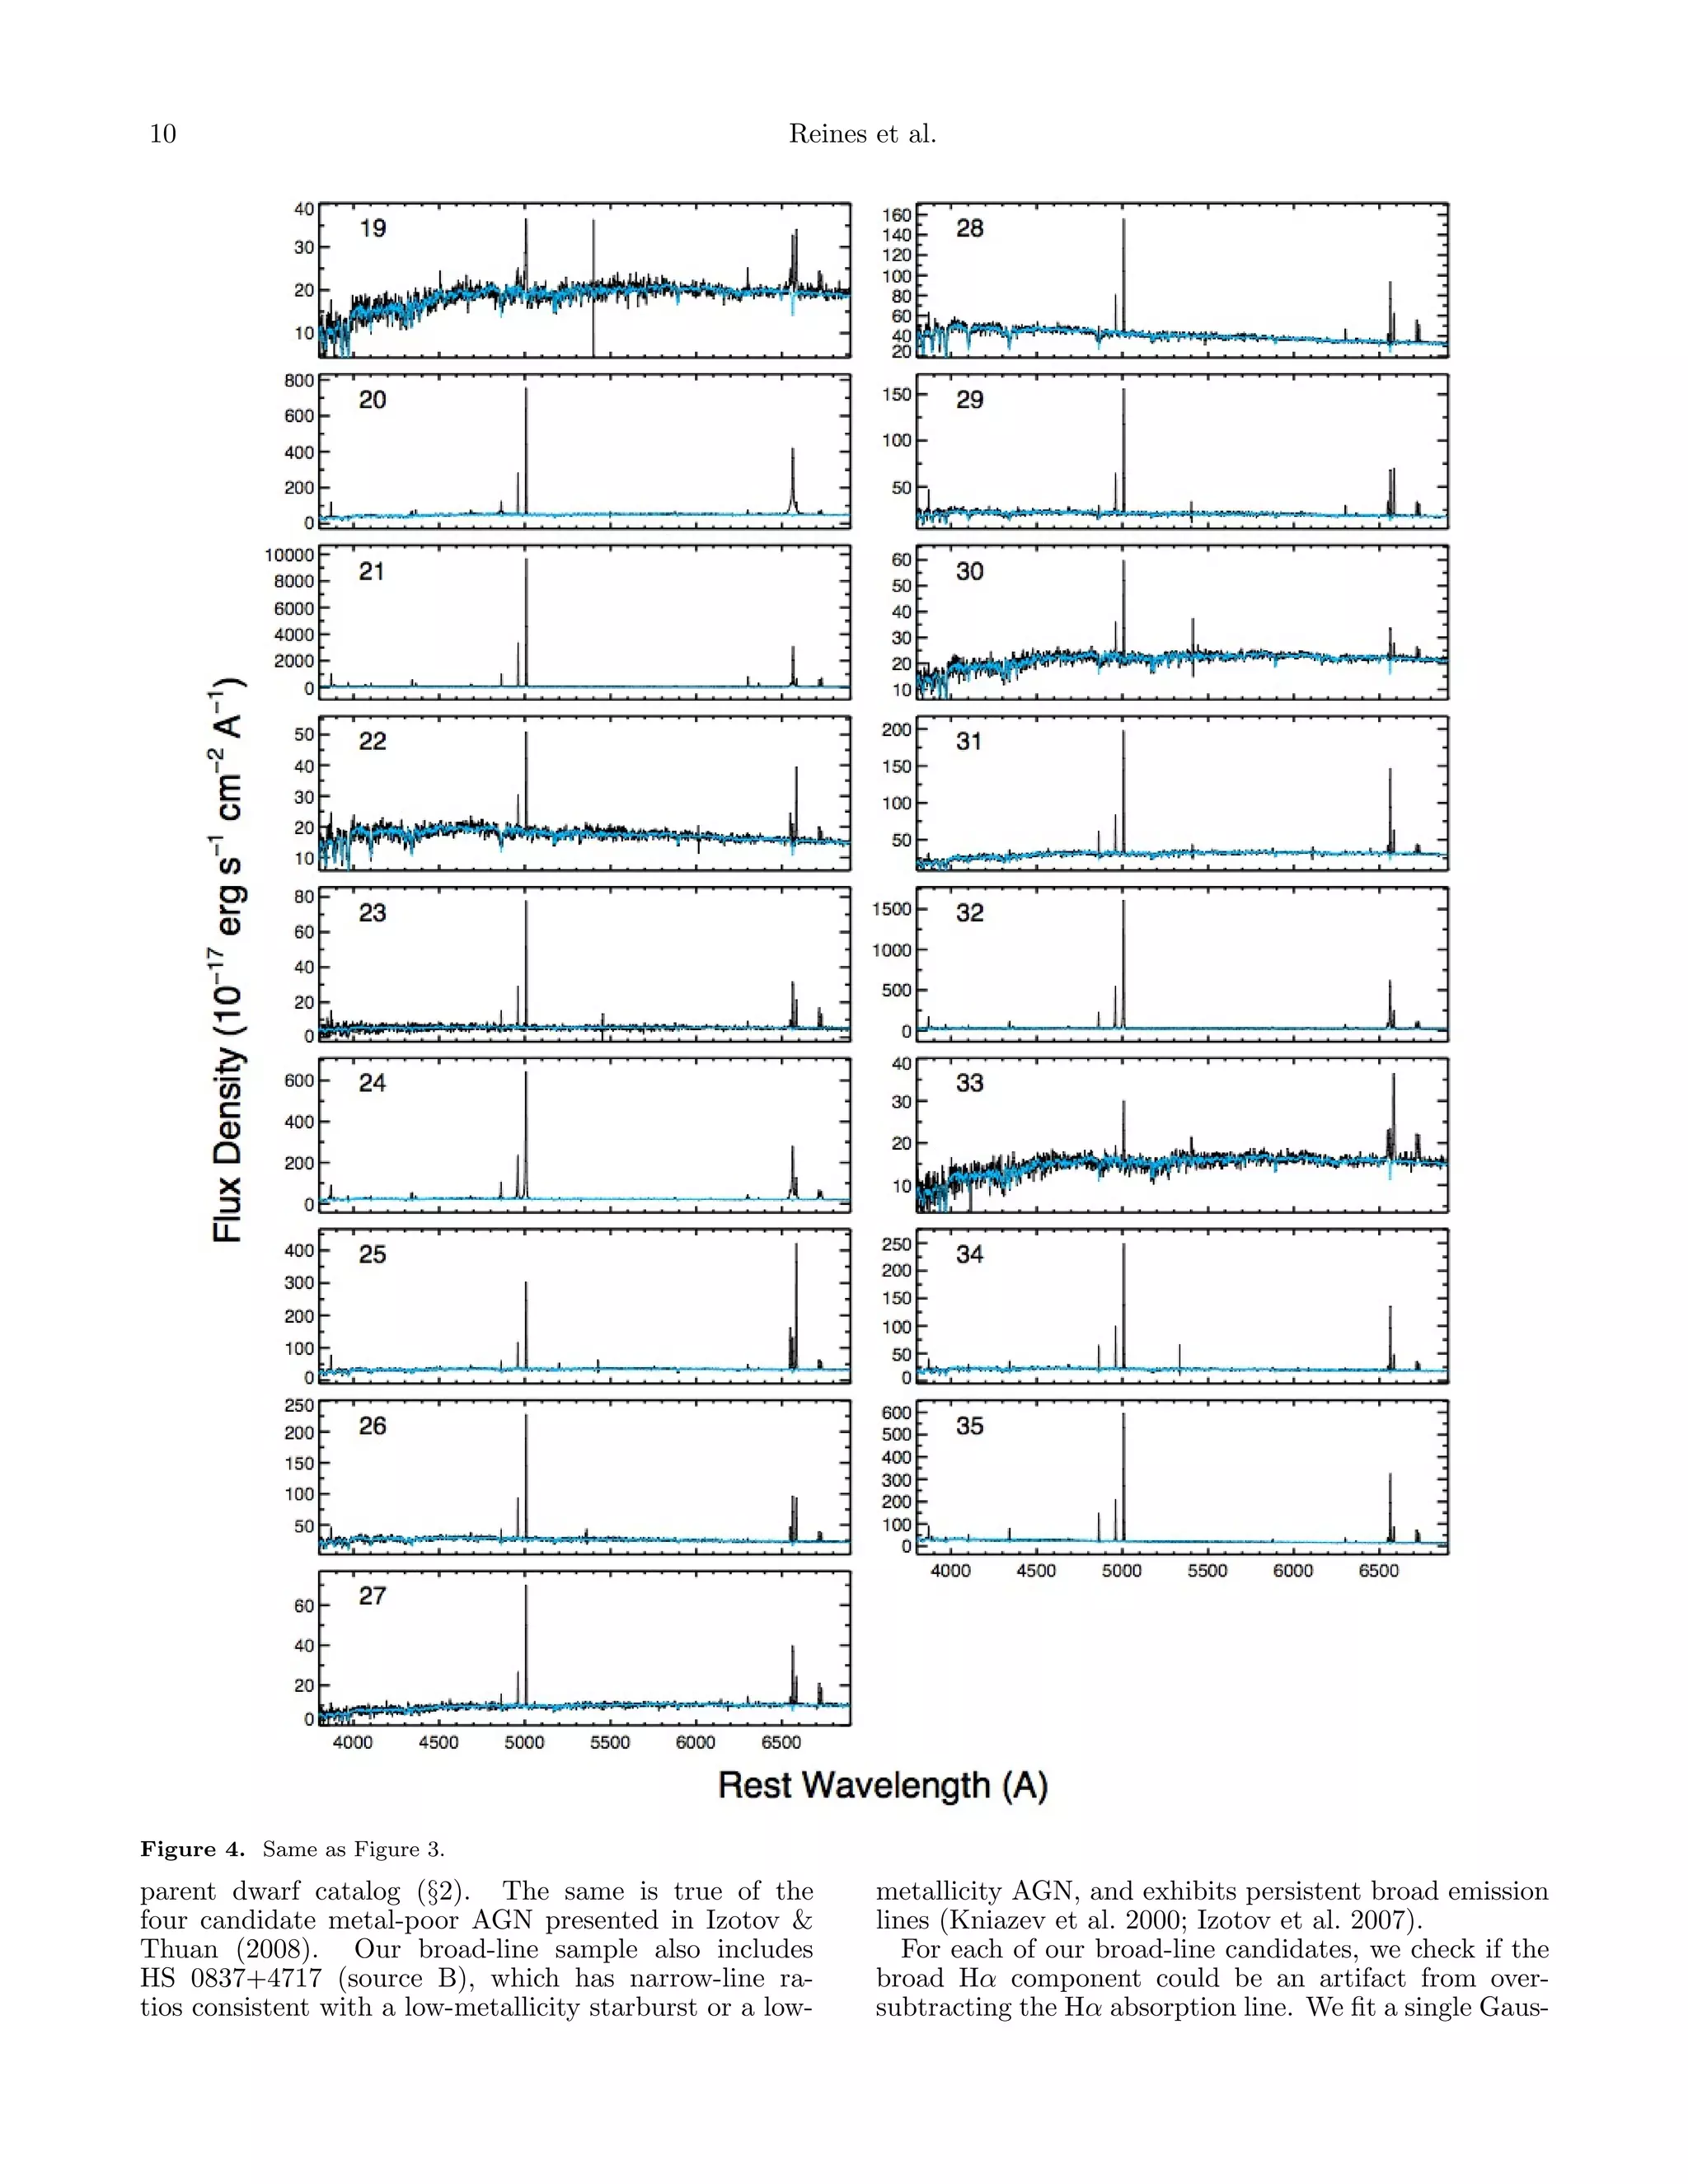
![Dwarf Galaxies with Active Massive Black Holes
9
Figure 3. SDSS redshift-corrected spectra of galaxies falling in the AGN region of the [O III]/Hβ versus [N II]/Hα diagram. Continuum
and absorption-line fits are shown in blue (see Section 3.1). An identification number (Table 1) is given in the upper left corner of each
plot.](https://image.slidesharecdn.com/dwarfgalaxieswithopticalsignaturesofactivemassiveblackholes-140109062630-phpapp01/75/Dwarf-galaxies-with_optical_signatures_of_active_massive_black_holes-9-2048.jpg)
![Dwarf Galaxies with Active Massive Black Holes
11
Figure 5. Example of a broad-line AGN candidate (ID 119). The narrow-line ratios of this source place it in the composite section of
the [O III]/Hβ versus [N II]/Hα diagram. Top: The redshift-corrected spectrum with the continuum and absorption-line fit plotted in
blue. Bottom: Chunks of the emission-line spectrum (after continuum and absorption-line subtraction). Best-fitting models are plotted in
red and the individual narrow Gaussian components are plotted in yellow. The broad Hα and Hβ components are plotted in dark blue.
Residuals are plotted in gray with a vertical offset for clarity. Reduced χ2 values are shown in the upper left-hand corner of the Hα +
[N II] and Hβ chunks. For comparison, the reduced χ2 values from the fits not including a broad component are shown in parenthesis.
Spectra of the other 24 broad-line AGN candidates are shown in the Appendix.
sian to the Hα absorption line in the model fit (Section
3.1), measure the corresponding equivalent width (EW)
and FWHM, and compare these values to the broad Hα
emission component. As shown in Figure 6, the EWs
of the broad emission features are ∼ 3 to 36 times the
EWs of the absorption features and the FWHMs of the
broad Hα components are ∼ 2 to 11 times the FWHMs
of the absorption lines. Moreover, in all but 1 case, the
FWHMs of the Hα absorption lines are less than 500 km
s−1 , our minimum threshold for the width of any broad
Hα emission. Thus, our broad Hα detections appear to
be robust and not a result of over-subtracting an absorption feature.
Figure 6. Ratios of the EWs and FWHMs of the broad components of Hα emission to the Hα absorption lines for the broad-line
AGN candidates (Section 3.4). Points are color-coded according
to their position in the [O III]/Hβ versus [N II]/Hα BPT diagram.
Dashed lines indicate ratios equal to 1. This plot demonstrates that
the broad Hα emission features are not a result of over-subtracting
the Hα absorption features. Absorption lines were not detected in
4 of the 25 broad-line AGN candidates and they are excluded here.
The broad-line AGN candidates are found throughout the BPT diagrams (Figures 1 and 2), as is the case
for other samples of Type 1 AGN (Greene & Ho 2007a;
Stern & Laor 2013). Ten of the galaxies fall in either the
AGN or composite region of the [O III]/Hβ vs. [N II]/Hα
diagram and we consider these the most secure broadline AGN candidates, half of which are new identifications6 . Accounting for just the BPT-AGN, the fraction of sources with a detectable broad Hα component
(i.e., the Type 1 fraction) is ∼17% (6/35). The other 15
broad-line sources fall in the star-forming region of the
[O III]/Hβ vs. [N II]/Hα diagram (Tables 3 and 4), 2 of
which fall in the Seyfert (and 2 in the LINER) region of
the [O III]/Hβ vs. [O I]/Hα diagram. While models of
low-metallicity AGNs overlap with low-metallicity starbursts (Groves et al. 2006), only one of the broad-line
sources in the star-forming part of the [O III]/Hβ vs.
[N II]/Hα diagram also has narrow-line ratios consistent
with a low-metallicity AGN (source B). For the majority
of cases, the narrow-lines are likely dominated by star
formation. Bona fide broad-line AGN falling in the starforming part of the diagnostic diagram can naturally be
explained by star-formation dominating the narrow-line
emission within the 3 SDSS aperture, which can cover
a substantial fraction of the host galaxy for these dwarfs.
It is also possible, however, that the broad Hα seen in objects lying in the star-forming region of the BPT diagram
is in fact from stellar phenomena.
Broad Hα from galaxies in the star-forming region of
the BPT diagram may well be from luminous Type II
SNe that happened to be detectable when the SDSS spectra were taken and fell within the spectroscopic aperture. Type II SNe can exhibit broad Hα emission with
luminosities upwards of ∼ 1040 erg s−1 , which is comparable to the luminosities of our broad-line sources and
other examples of AGNs with low-mass BHs (Filippenko
& Ho 2003; Greene & Ho 2007a). Some Type II SNe
also exhibit broad P Cygni profiles in Hα and we have
already excluded these sources from our broad-line sam6 Barth et al. (2008) identify a tentative broad component in ID
32 (Table 1).](https://image.slidesharecdn.com/dwarfgalaxieswithopticalsignaturesofactivemassiveblackholes-140109062630-phpapp01/75/Dwarf-galaxies-with_optical_signatures_of_active_massive_black_holes-11-2048.jpg)
![12
Reines et al.
Table 3
BPT Star-Forming Galaxies with Broad Hα: Galaxy Properties
ID
(1)
NSAID
(2)
SDSS Name
(3)
Plate-MJD-Fiber
(4)
z
(5)
log M
(6)
Mg
(7)
g−r
(8)
r50
(9)
S´rsic n
e
(10)
Aa
Bb
C
D
E
F
G
H
I
Ja
K
L
M
N
O
22083
15952
109990
76788
109016
12793
13496
74914
112250
41331
91579
33207
119311
88972
104565
J004042.10−110957.7
J084029.91+470710.4
J090019.66+171736.9
J091122.24+615245.5
J101440.21+192448.9
J105100.64+655940.7
J105447.88+025652.4
J111548.27+150017.7
J112315.75+240205.1
J114343.77+550019.4
J120325.66+330846.1
J130724.64+523715.5
J131503.77+223522.7
J131603.91+292254.0
J134332.09+253157.7
655-52162-89
549-51981-621
2432-54052-524
1786-54450-514
2373-53768-148
490-51929-279
507-52353-619
1752-53379-532
2497-54154-221
1015-52734-596
2089-53498-283
887-52376-454
2651-54507-488
2009-53904-640
2246-53767-49
0.0274
0.0421
0.0288
0.0266
0.0289
0.0325
0.0222
0.0501
0.0250
0.0272
0.0349
0.0262
0.0230
0.0378
0.0287
9.45
8.11
9.30
8.79
8.75
9.11
8.90
8.82
9.01
9.01
9.01
9.09
9.14
8.93
9.35
−18.14
−18.89
−19.08
−18.56
−17.90
−19.05
−18.56
−18.93
−18.33
−17.97
−17.44
−19.14
−18.90
−19.72
−18.58
0.56
−0.85
0.26
0.26
0.23
0.11
0.20
0.19
0.44
0.22
0.92
0.19
0.29
−0.14
0.37
1.0
0.9
2.3
2.2
0.9
0.8
0.9
1.5
0.8
1.1
1.1
1.2
1.7
1.4
3.3
2.3
6.0
1.1
0.6
1.9
6.0
2.9
5.3
6.0
0.9
5.9
1.3
3.9
3.1
0.9
Note. — Col.(1): Identification assigned in this paper. Col.(2): NSA identification number. Col.(3): SDSS name. Col.(4): Plate-MJDFiber of analyzed spectra. Col.(5): Redshift. Col.(6): Log galaxy stellar mass in units of M . Col.(7): Absolute g-band magnitude. Col.(8):
g − r color. Col.(9): Petrosian 50% light radius in units of kpc. Col.(10): S´rsic index, n. All values are from the NSA and assume h = 0.73.
e
Magnitudes are K-corrected to rest-frame values using kcorrect v4 2 and corrected for foreground Galactic extinction.
a Galaxies in Greene & Ho (2007) and Dong et al. (2012)
b HS 0837+4717 (Izotov et al. 2007). The [O III]/Hβ and [N II]/Hα ratios for this source are also consistent with a low-metallicity AGN.
Table 4
BPT Star-Forming Galaxies with Broad Hα: Emission Line Fluxes
ID
(1)
(Hβ)n
(2)
(Hβ)b
(3)
A
B
C
D
E
F
G
H
I
J
K
L
M
N
O
42(5)
2287(47)
340(6)
180(6)
408(10)
917(79)
1058(19)
164(6)
576(14)
227(9)
183(5)
685(16)
495(11)
3524(44)
34(4)
···
195(20)
···
···
···
311(13)
···
···
···
80(18)
···
···
···
···
···
[O III]λ5007
(4)
[O I]λ6300
(5)
[N II]λ6548
(6)
52(6)
14521(202)
560(9)
450(10)
1218(24)
1241(39)
1782(167)
394(10)
664(15)
299(10)
330(6)
1405(26)
441(20)
14615(162)
27(4)
21(5)
46(4)
29(3)
16(4)
32(5)
38(5)
54(6)
28(5)
62(7)
17(5)
30(3)
63(7)
15(5)
302(16)
9(2)
9(1)
54(2)
53(1)
16(1)
44(1)
361(31)
237(4)
23(1)
215(4)
39(2)
39(1)
111(3)
154(4)
365(4)
8(1)
(Hα)n
(7)
(Hα)b
(8)
113(6)
8066(82)
1155(14)
571(9)
1348(20)
3764(323)
3567(45)
549(10)
2264(30)
1065(31)
655(9)
2174(31)
1690(22)
11905(129)
106(3)
218(17)
1292(23)
749(21)
251(26)
107(17)
582(28)
365(27)
183(22)
196(27)
648(22)
155(10)
236(35)
521(30)
907(55)
46(8)
[N II]λ6583
(9)
[S II]λ6716
(10)
[S II]λ6731
(11)
26(3)
161(5)
157(3)
48(3)
129(4)
1069(77)
702(12)
68(4)
638(12)
116(5)
114(3)
329(8)
457(10)
1080(13)
23(2)
44(4)
115(4)
190(4)
99(4)
170(6)
293(57)
518(11)
86(4)
392(10)
135(6)
133(4)
371(10)
229(7)
981(15)
36(3)
32(3)
107(3)
141(3)
66(3)
125(4)
263(89)
373(7)
64(3)
305(7)
90(4)
95(2)
288(7)
169(5)
727(10)
22(2)
Note. — Col.(1): Identification assigned in this paper. Col.(2)-(11): Emission line fluxes with units of 10−17 erg s−1 cm−2 . Errors are shown in parenthesis. No
extinction correction has been applied. The subscripts n and b refer to the narrow and broad components of the line, respectively. A three-dot ellipsis indicates that no
broad component of Hβ is detected.
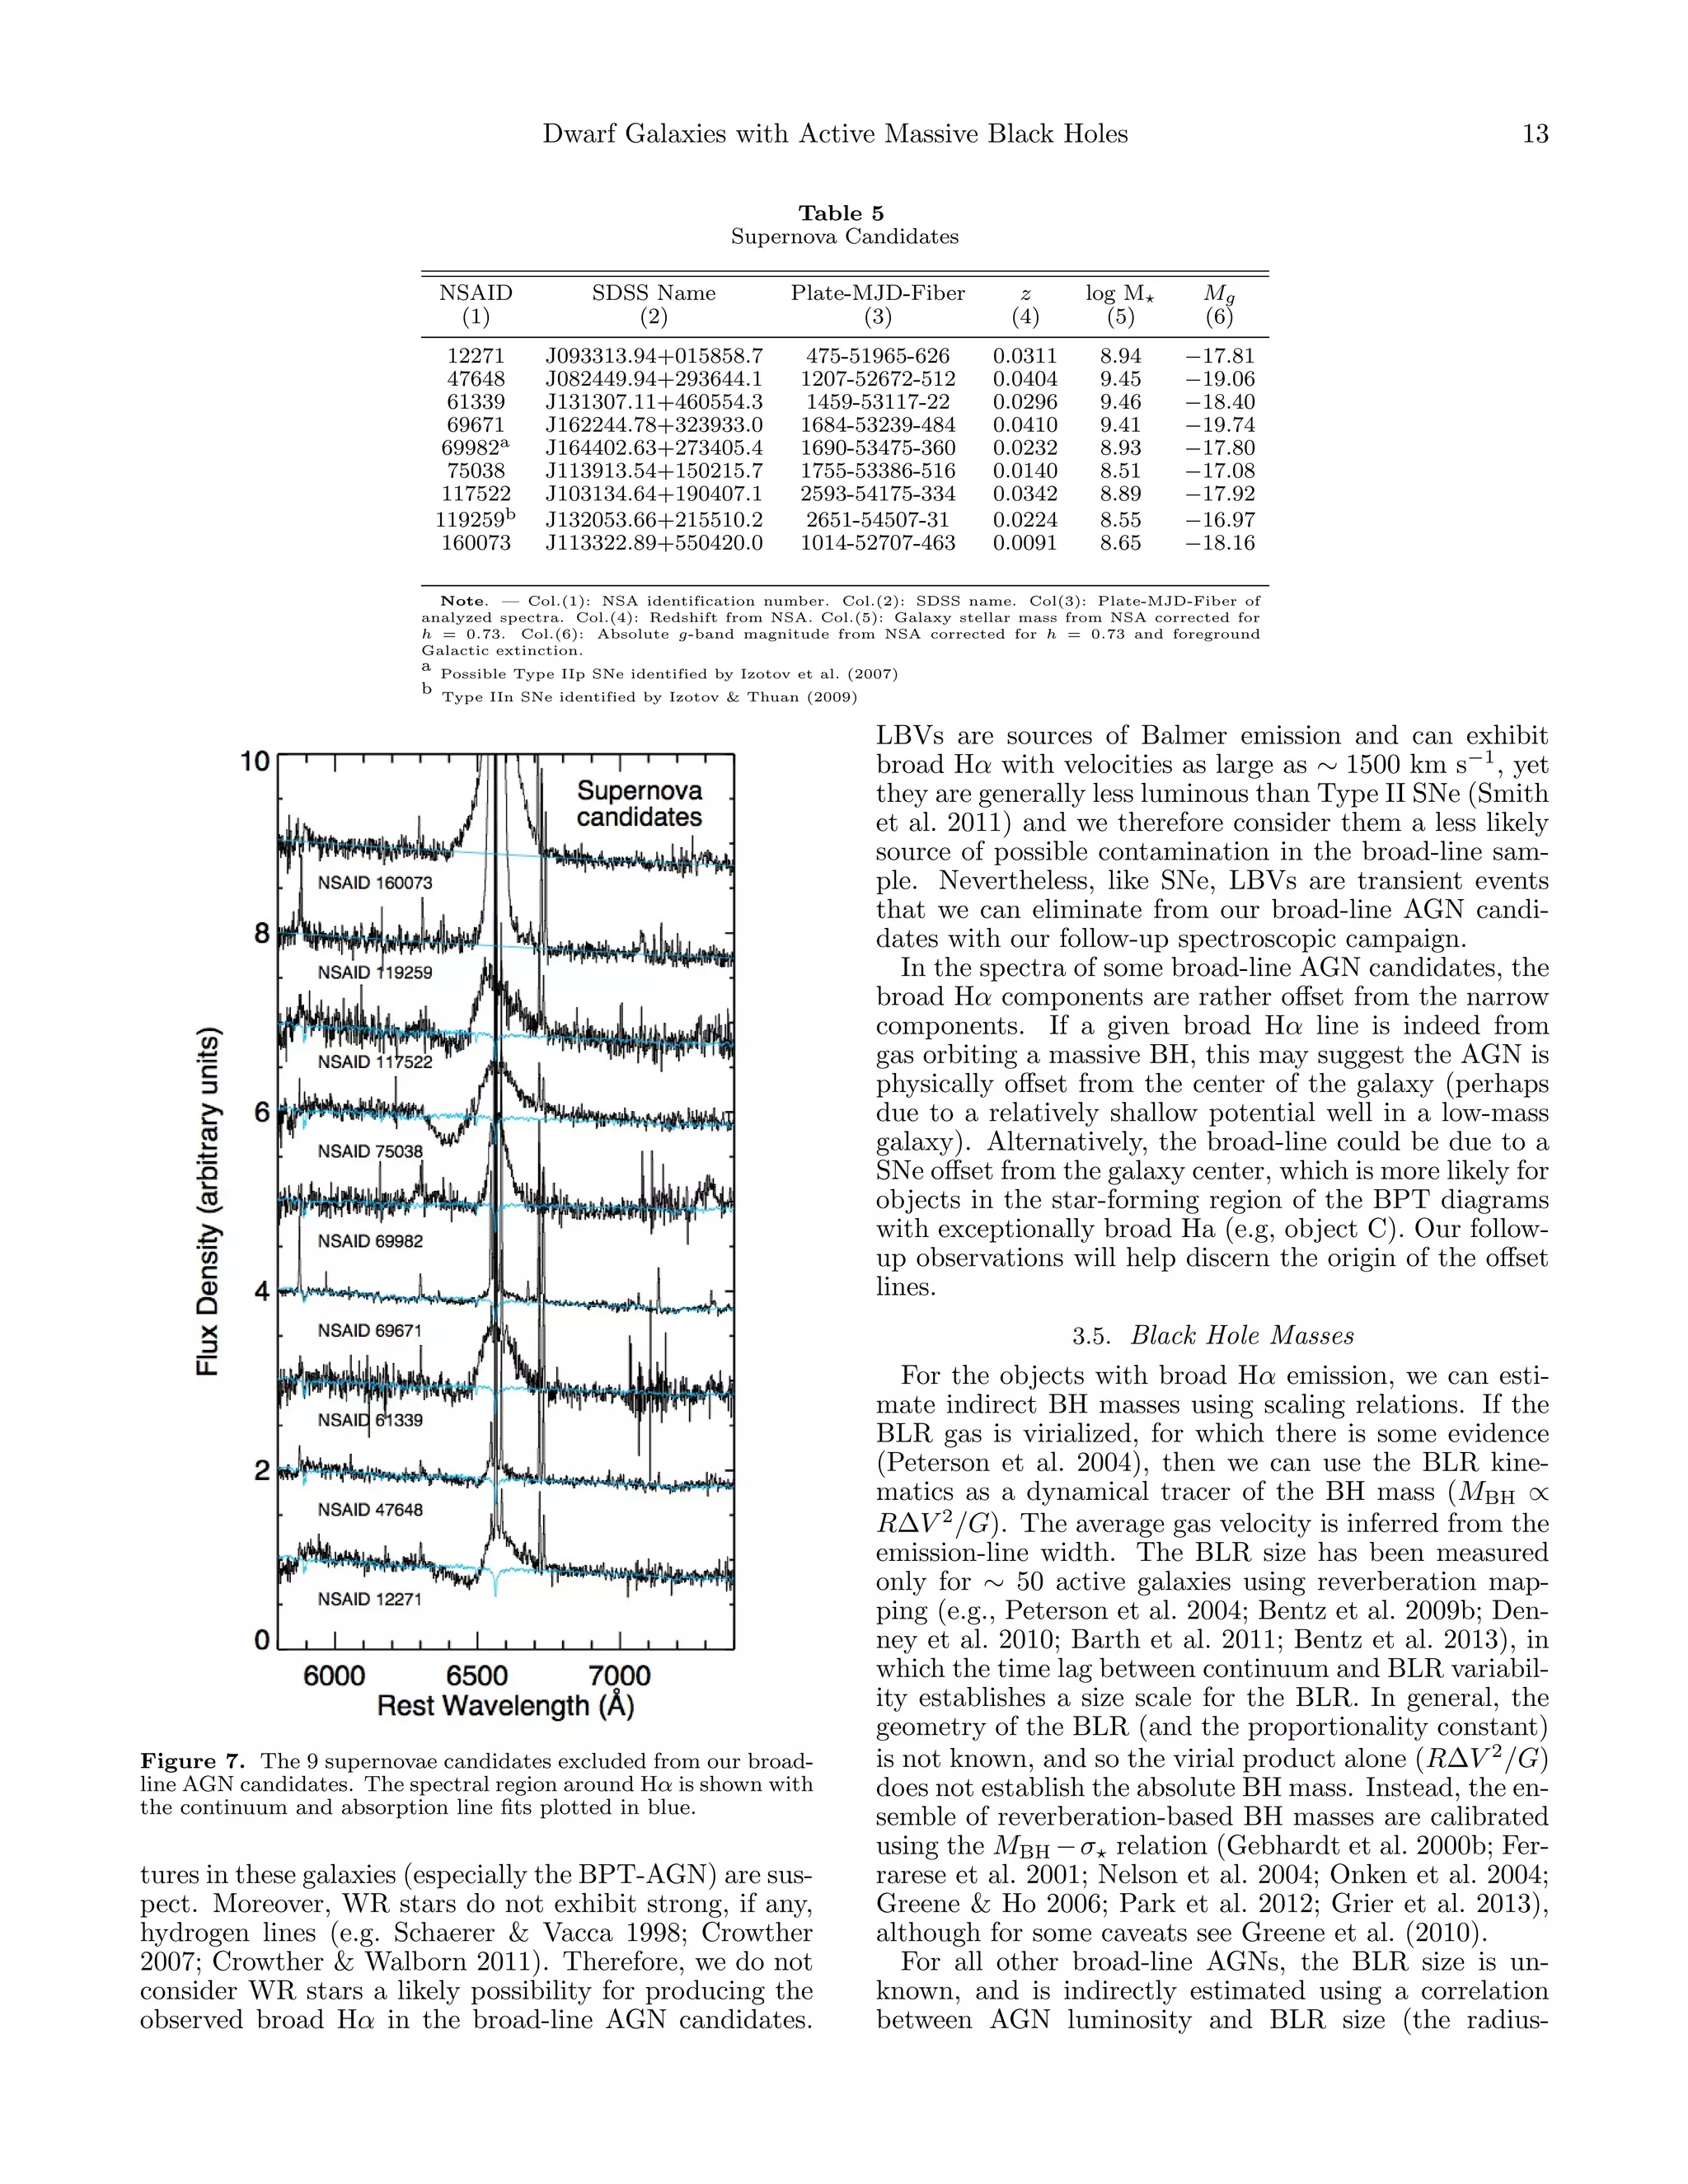
ple. We identified 9 such objects by eye (Table 5), and
these were subsequently confirmed by the automated SNe
detection code used in Graur & Maoz (2013) (O.Graur,
private communication). Two objects, NSAID 119259
and NSAID 69982, have also been identified as Type II
SNe by Izotov & Thuan (2009a) and Izotov et al. (2007),
respectively. Figure 7 shows the spectral region around
Hα for the SNe candidates. In some cases, the P Cygni
profile is very subtle with only slight blue-shifted absorption indicated by an asymmetric emission line profile.
Another way we can identify SNe in our broad-line sample is to examine the temporal evolution of the broad Hα
emission. We would expect the broad line to persist for
an AGN, whereas it should significantly decrease or disappear over a timespan of several years for SNe. Therefore, we are currently obtaining follow-up spectroscopy
of the broad-line sources, the results of which will be
presented in a forthcoming paper.
We also consider stellar winds from evolving massive
stars undergoing mass loss, such as those from WolfRayet (WR) stars and Luminous Blue Variables (LBVs).
WR stars are identified in the integrated spectra of galaxies by the blended emission from helium, carbon and nitrogen at λ4650 − 4690 known as the “WR bump” and
this feature is only detected in four of our broad-line
AGN candidates by Brinchmann et al. (2008)7 . Two are
BPT-AGN, including NGC 4395 and one of the galaxies from the Barth et al. (2008) sample (IDs 21 and
32), and two are BPT-star-forming galaxies (IDs B and
F). We note that broad He II λ4686 can also be produced by AGN and thus the identifications of WR fea7 The work of Brinchmann et al. (2008) makes use of DR6,
whereas we use DR8. 18 of our 25 broad-line AGN candidates
are found in DR6.](https://image.slidesharecdn.com/dwarfgalaxieswithopticalsignaturesofactivemassiveblackholes-140109062630-phpapp01/75/Dwarf-galaxies-with_optical_signatures_of_active_massive_black_holes-12-2048.jpg)
![16
Reines et al.
Figure 8. Panel a): Virial BH mass distribution for broad-line AGN candidates. BPT AGNs and composites are shown in orange. BPT
star-forming galaxies, for which the origin of the broad-line emission is somewhat ambiguous, are shown in blue. Panels b–f ): Distributions
of host galaxy properties provided in the NSA for the 136 galaxies with narrow-line ionization signatures of BH accretion. BPT AGNs and
composites are shown in the orange hashed histograms, and the distributions of BPT-AGNs only are shown in red. Our parent sample of
dwarf emission-line galaxies is shown in black, normalized to the number of galaxies in the orange histogram (136 BPT AGN + composites).
We show the distributions of galaxy stellar masses (with stellar masses of the Magellanic Clouds indicated in blue), total absolute g-band
magnitude, g − r color, Petrosian 50% light radius, and S´rsic index. All magnitudes are K-corrected to rest-frame values using kcorrect
e
v4 2 and corrected for foreground Galactic extinction. NSA values have been modified assuming h = 0.73.
n values, although BHs are also found in low-n disky
galaxies. Figure 9 shows the SDSS images of a selection
of galaxies in our sample with BH accretion signatures.
5. DEMOGRAPHICS
The fraction of optically-selected, active BHs in our
parent sample of dwarf galaxies is ∼0.5% (136/25974)9 .
However, there are a number of obstacles preventing us
from determining the true occupation fraction and BH
mass function in this low-mass regime. First of all, our
optical diagnostics are only sensitive to actively accreting BHs, and even at their Eddington limit low-mass BHs
are relatively faint. Furthermore, small galaxies generally have ongoing star formation, gas, and dust that can
mask or extinguish the optical signatures of BH accretion. Therefore, while there may an accreting BH present
9 Including the additional 15 broad-line AGN candidates in the
star-forming region of the BPT diagram does not have a significant
impact on the active fraction, increasing it to ∼0.6%.
at the center of a galaxy, the total observed line emission
in the SDSS aperture may be dominated by star formation. Indeed, the SDSS aperture of 3 is comparable to
the median half-light radius of our dwarf galaxy sample. Even without significant ongoing star formation,
AGN signatures may be heavily diluted by host galaxy
light such that the emission lines are effectively hidden
(Moran et al. 2002). Additionally, low-metallicty AGN,
which may be expected in lower-mass galaxies, can fall
(and hide) in the upper left region of the star-forming
plume of galaxies in the [O III]/Hβ versus [N II]/Hα diagnostic diagram (Groves et al. 2006). Therefore, while
we can identify bona-fide AGNs based on their location in
the BPT diagram, the selection of massive BHs is likely
highly incomplete. Even if we understand our incompleteness from these effects, to derive a true space density requires that we know the distribution of Eddington
ratios in these low-mass systems as compared to more
massive galaxies (e.g., Heckman et al. 2004; Gallo et al.](https://image.slidesharecdn.com/dwarfgalaxieswithopticalsignaturesofactivemassiveblackholes-140109062630-phpapp01/75/Dwarf-galaxies-with_optical_signatures_of_active_massive_black_holes-16-2048.jpg)
![Dwarf Galaxies with Active Massive Black Holes
17
Figure 9. A selection of galaxies from our sample of dwarfs hosting active massive BHs. The SDSS color composite images have a size
of 50 × 50 . The identification numbers assigned in this work are in the upper left corners of the images, with the SDSS name below.
2010; Aird et al. 2012) where we believe the occupation
fraction is close to unity. It is interesting to note, however, that our active fraction is quite similar to that of
∼ 107 M BHs radiating at ∼10% of their Eddington
limit (Heckman et al. 2004; Greene & Ho 2007b).
Using broad emission lines to identify AGN in dwarf
galaxies poses a different set of problems. The broadline signature is weaker for low-mass BHs and can be
difficult to detect in galaxy-dominated spectra. There is
also the possibility that the broad-line region disappears
altogether below some critical luminosity or Eddington
ratio (e.g., Nicastro 2000; Laor 2003; Elitzur & Ho 2009;
Trump et al. 2011; Marinucci et al. 2012). There are
a number of candidate “true” Type 2 AGNs (e.g., Tran
2003; Bianchi et al. 2008) that show no sign of a broadline region in direct or polarized light, and no clear signs
of obscuration in X-rays. It is thus possible that the
Type 1 fraction drops towards lower luminosity, which
could add significant complications in attempting to use
these AGN as a tracer of the demographics of BHs in
dwarf galaxies.
6. CONCLUSIONS
Using optical spectroscopy from the SDSS, we have
systematically assembled the largest sample of dwarf
galaxies (108.5
M
109.5 M ) hosting massive BHs
to date. These dwarf galaxies have stellar masses comparable to the Magellanic Clouds and contain some of
the least-massive supermassive BHs known. Contrary to
common lore, low-mass, physically small dwarf galaxies
can indeed form massive BHs.
We find photoionization signatures of BH accretion
in 136 galaxies using the narrow-line [O III]/Hβ versus [N II]/Hα diagram as our primary diagnostic. Of
these, 35 have AGN-dominated spectra and 101 have
composite spectra suggesting ionization from both an
AGN and massive stars. For the small fraction of these
active galaxies with detectable broad Hα emission, we
estimate a median virial BH mass of MBH ∼ 2 × 10⁵ M .
Our sensitivity to broad Hα emission limits our ability
to detect broad-line AGN with BH masses much below
∼ 105 M radiating at less than ∼10% of their Eddington luminosity. We find broad Hα in an additional 15
galaxies, yet their spectra exhibit narrow-line ratios consistent with star-forming galaxies. We caution that at
these low-luminosities and low-metallicities, particularly
for galaxies with high star formation rates, we are susceptible to contamination from stellar processes.
Ultimately, we need a complete census of massive
BHs in dwarf galaxies to place stringent constraints on
theories for the formation of supermassive BH seeds.
While optical diagnostics certainly have a role to play,
we need to move towards using alternative search techniques and observations at other wavelengths to make
further progress (e.g., radio and X-ray; Reines et al. 2011;
Reines & Deller 2012; Gallo et al. 2010; Miller et al. 2012;
Kamizasa et al. 2012).
We are grateful to the entire SDSS collaboration for
providing the data that made this work possible, to
Michael Blanton and all those involved in creating the
NASA-Sloan Atlas, and to Craig Markwardt for making
his MPFIT code publicly available. We thank the referee for a very helpful review that improved the paper.
A.E.R. appreciates helpful discussions with Mark Whittle, Jong-Hak Woo and Marta Volonteri. Support for
A.E.R. was provided by NASA through the Einstein Fellowship Program, grant PF1-120086. J.E.G. is partially
supported by an Alfred P. Sloan fellowship.](https://image.slidesharecdn.com/dwarfgalaxieswithopticalsignaturesofactivemassiveblackholes-140109062630-phpapp01/75/Dwarf-galaxies-with_optical_signatures_of_active_massive_black_holes-17-2048.jpg)

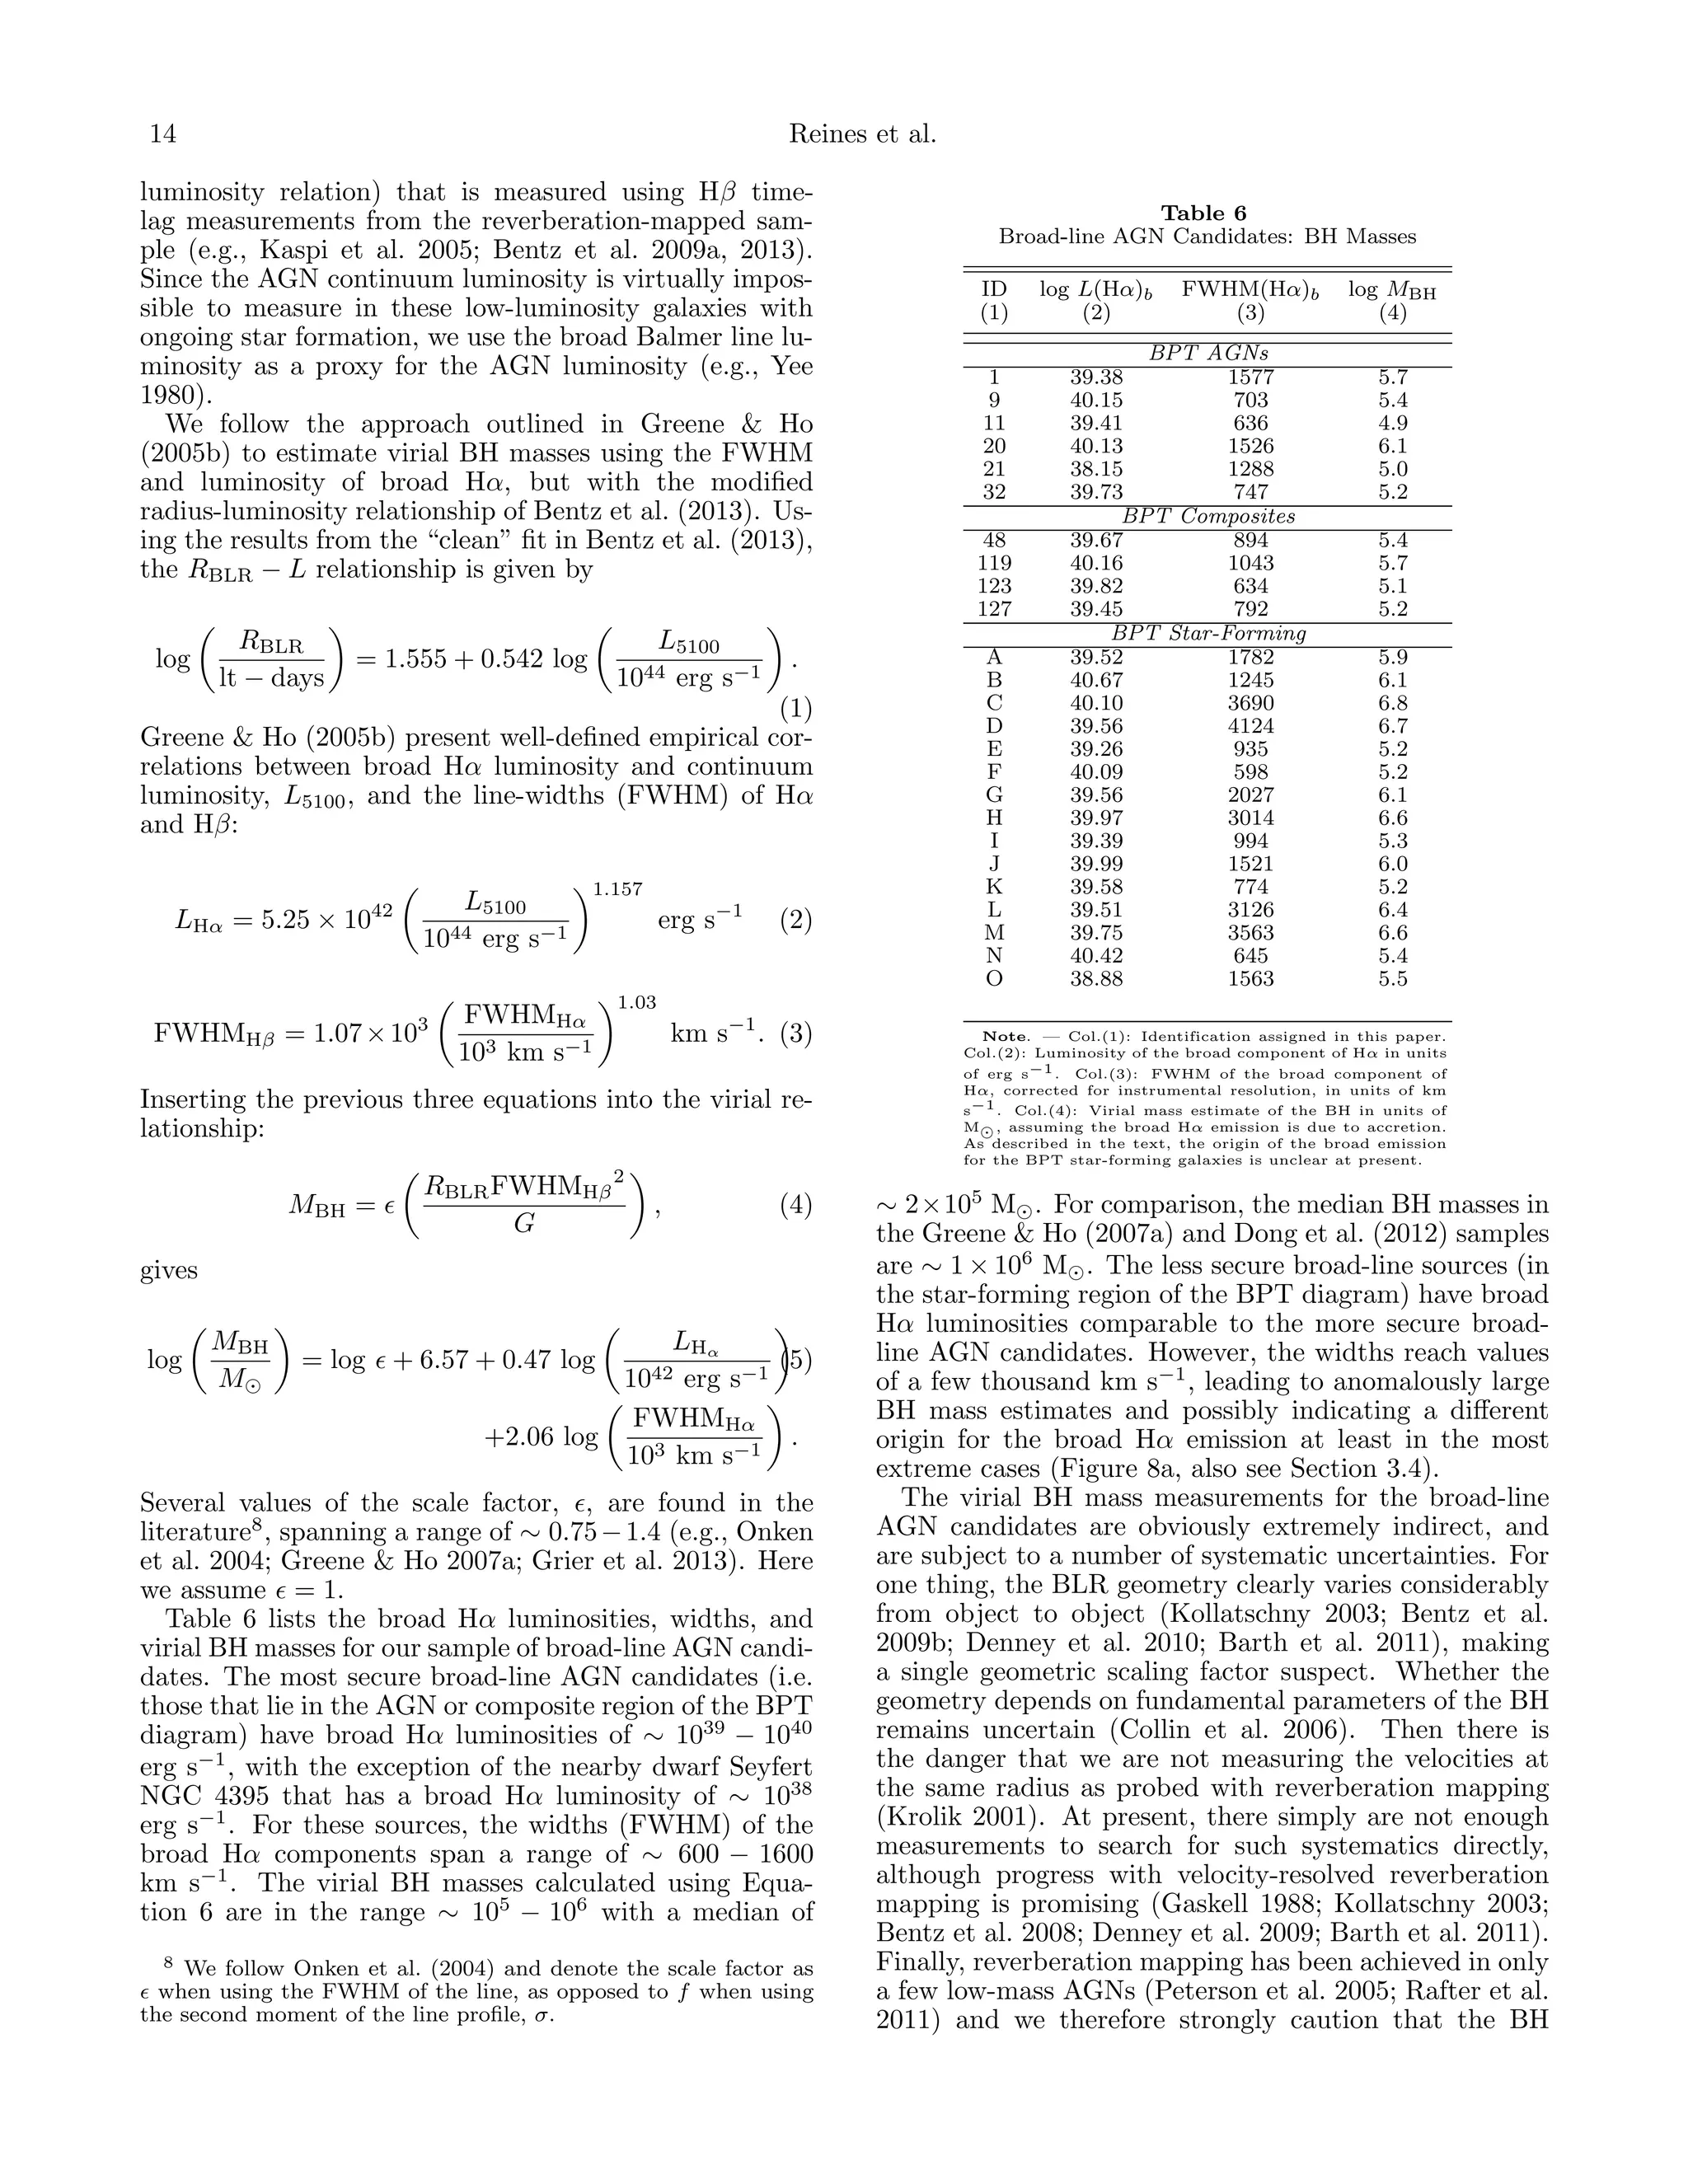
This document presents a sample of 151 dwarf galaxies that exhibit optical spectroscopic signatures of accreting massive black holes. The sample was identified by systematically searching ~25,000 emission-line galaxies from the Sloan Digital Sky Survey with stellar masses comparable to or less than the Large Magellanic Cloud. Many of the galaxies show narrow-line signatures of black hole accretion, and some also exhibit broad H-alpha emission, indicating gas orbiting in the deep potential of a massive black hole. This increases the number of known active galaxies in this low stellar mass range by over an order of magnitude. The median stellar mass of the host galaxies is around 108.5 solar masses, around 1-2 magnitudes fainter than previous samples of


