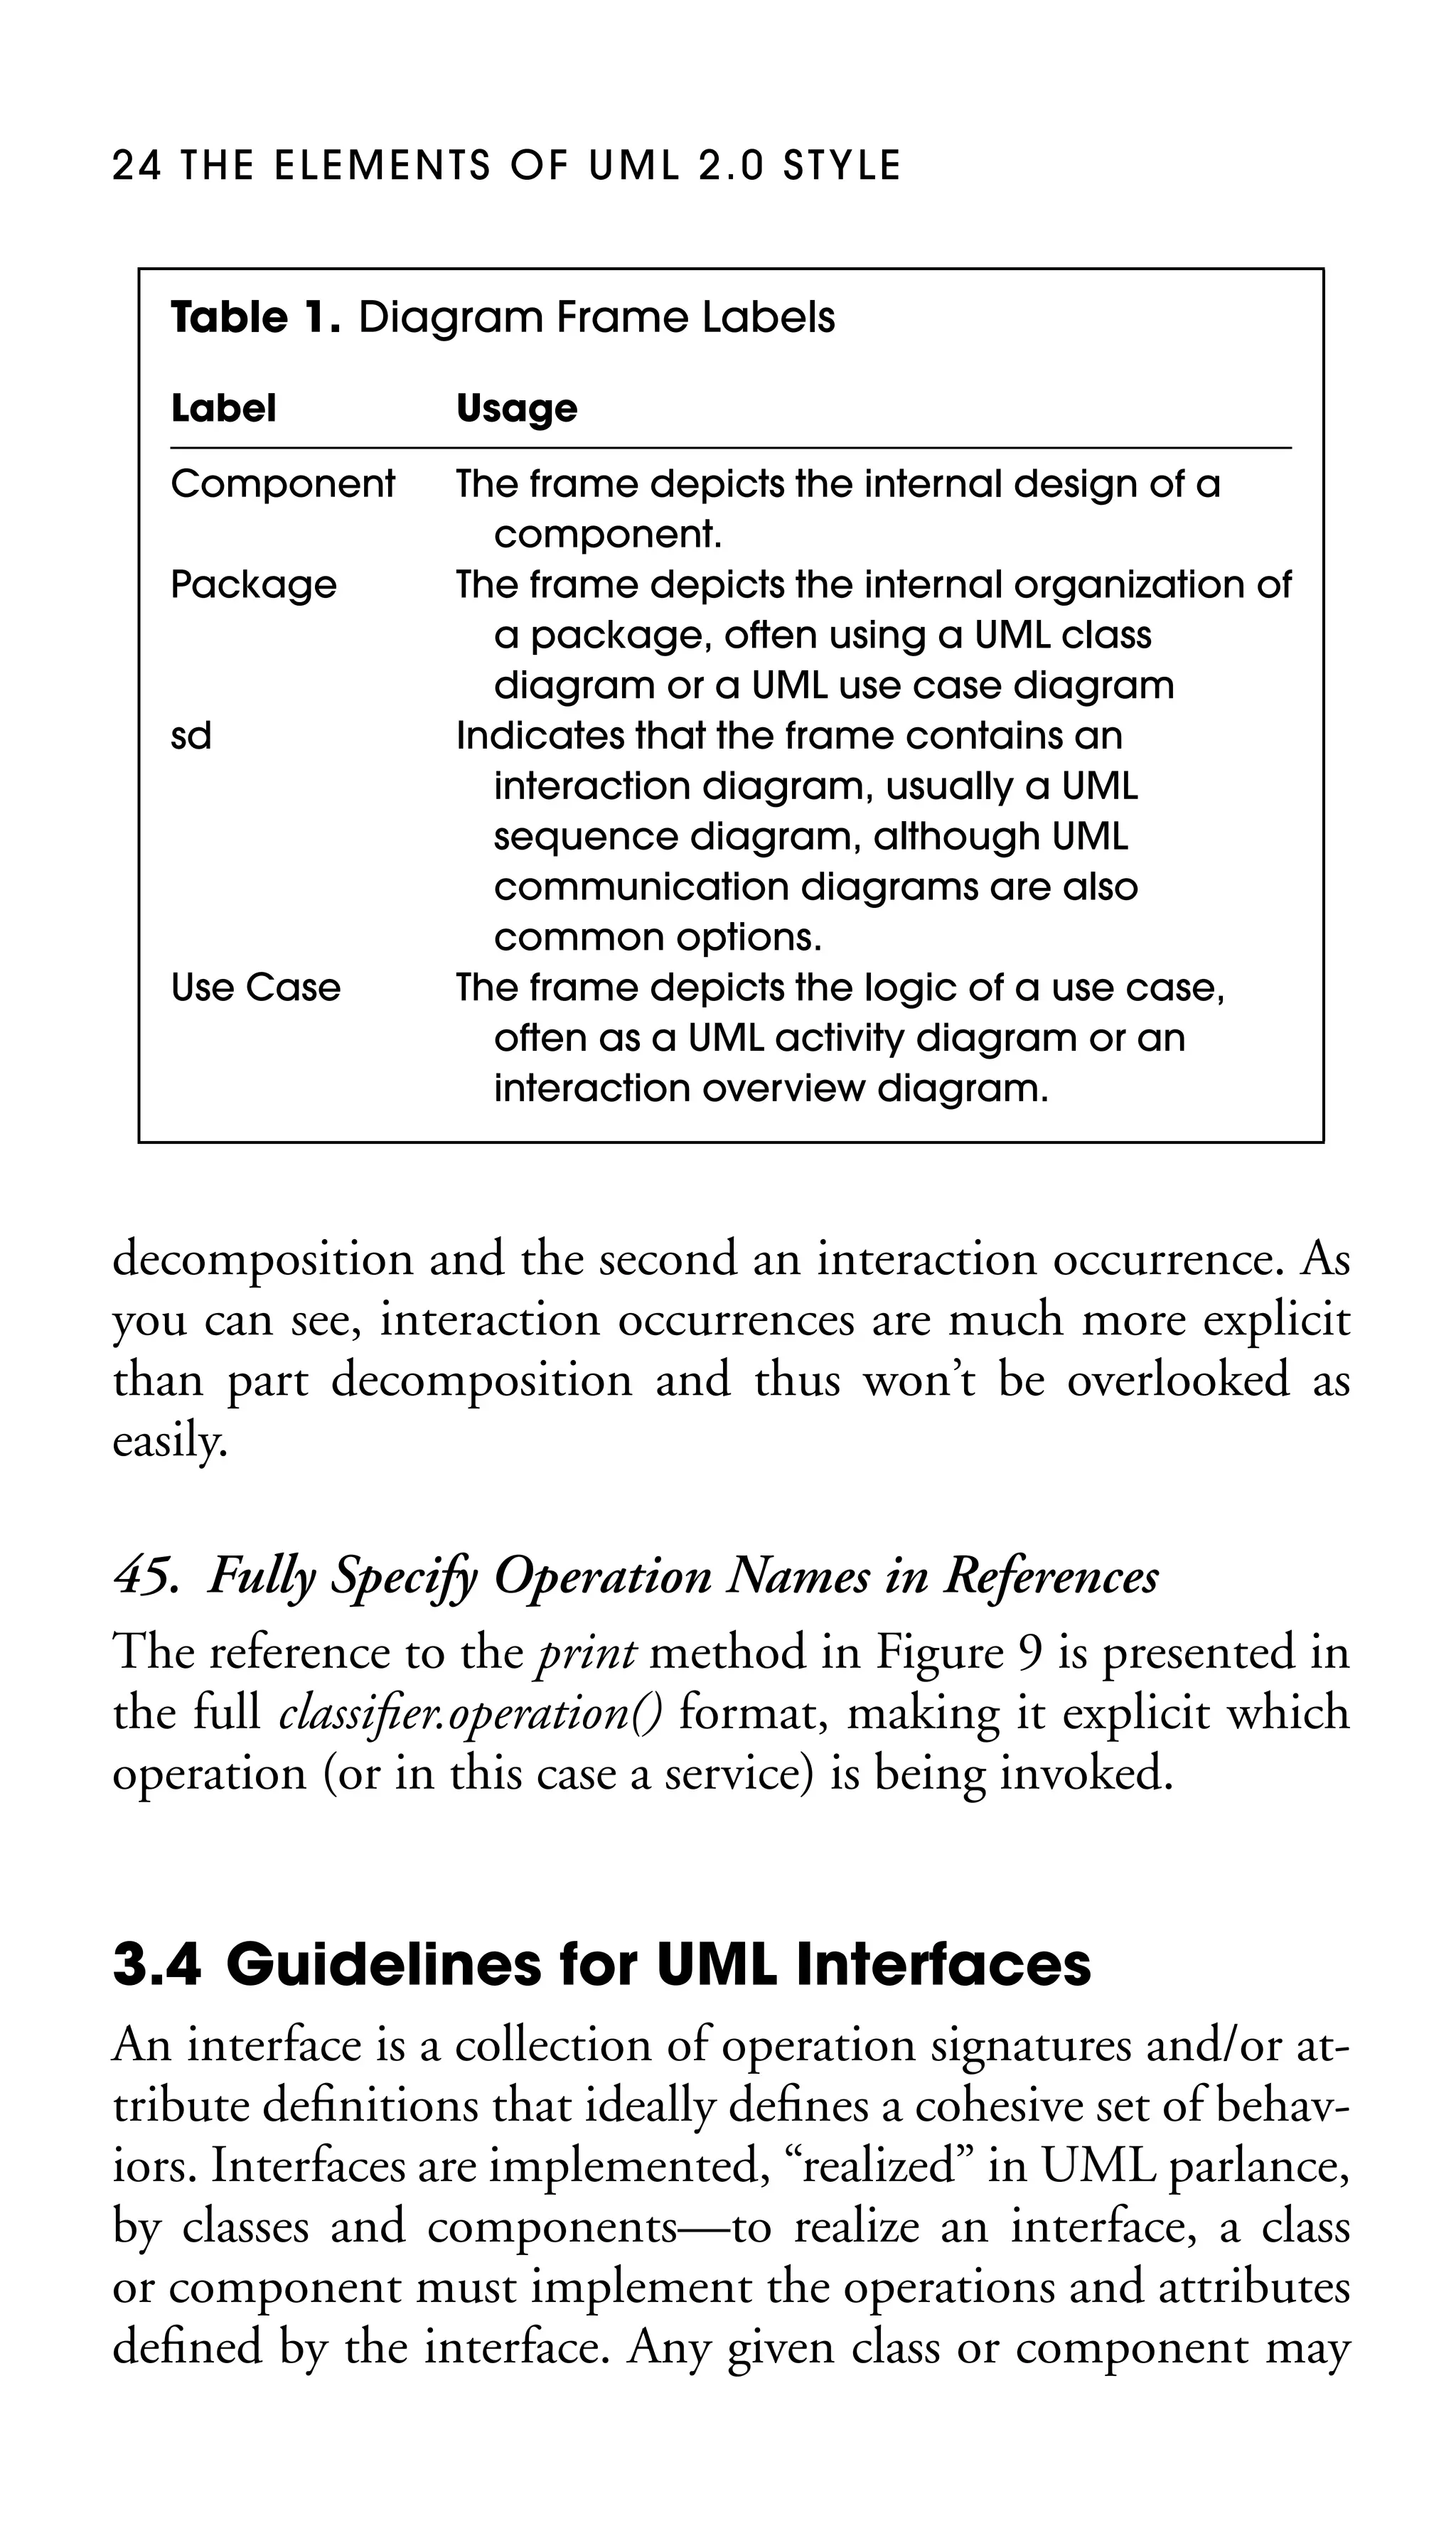
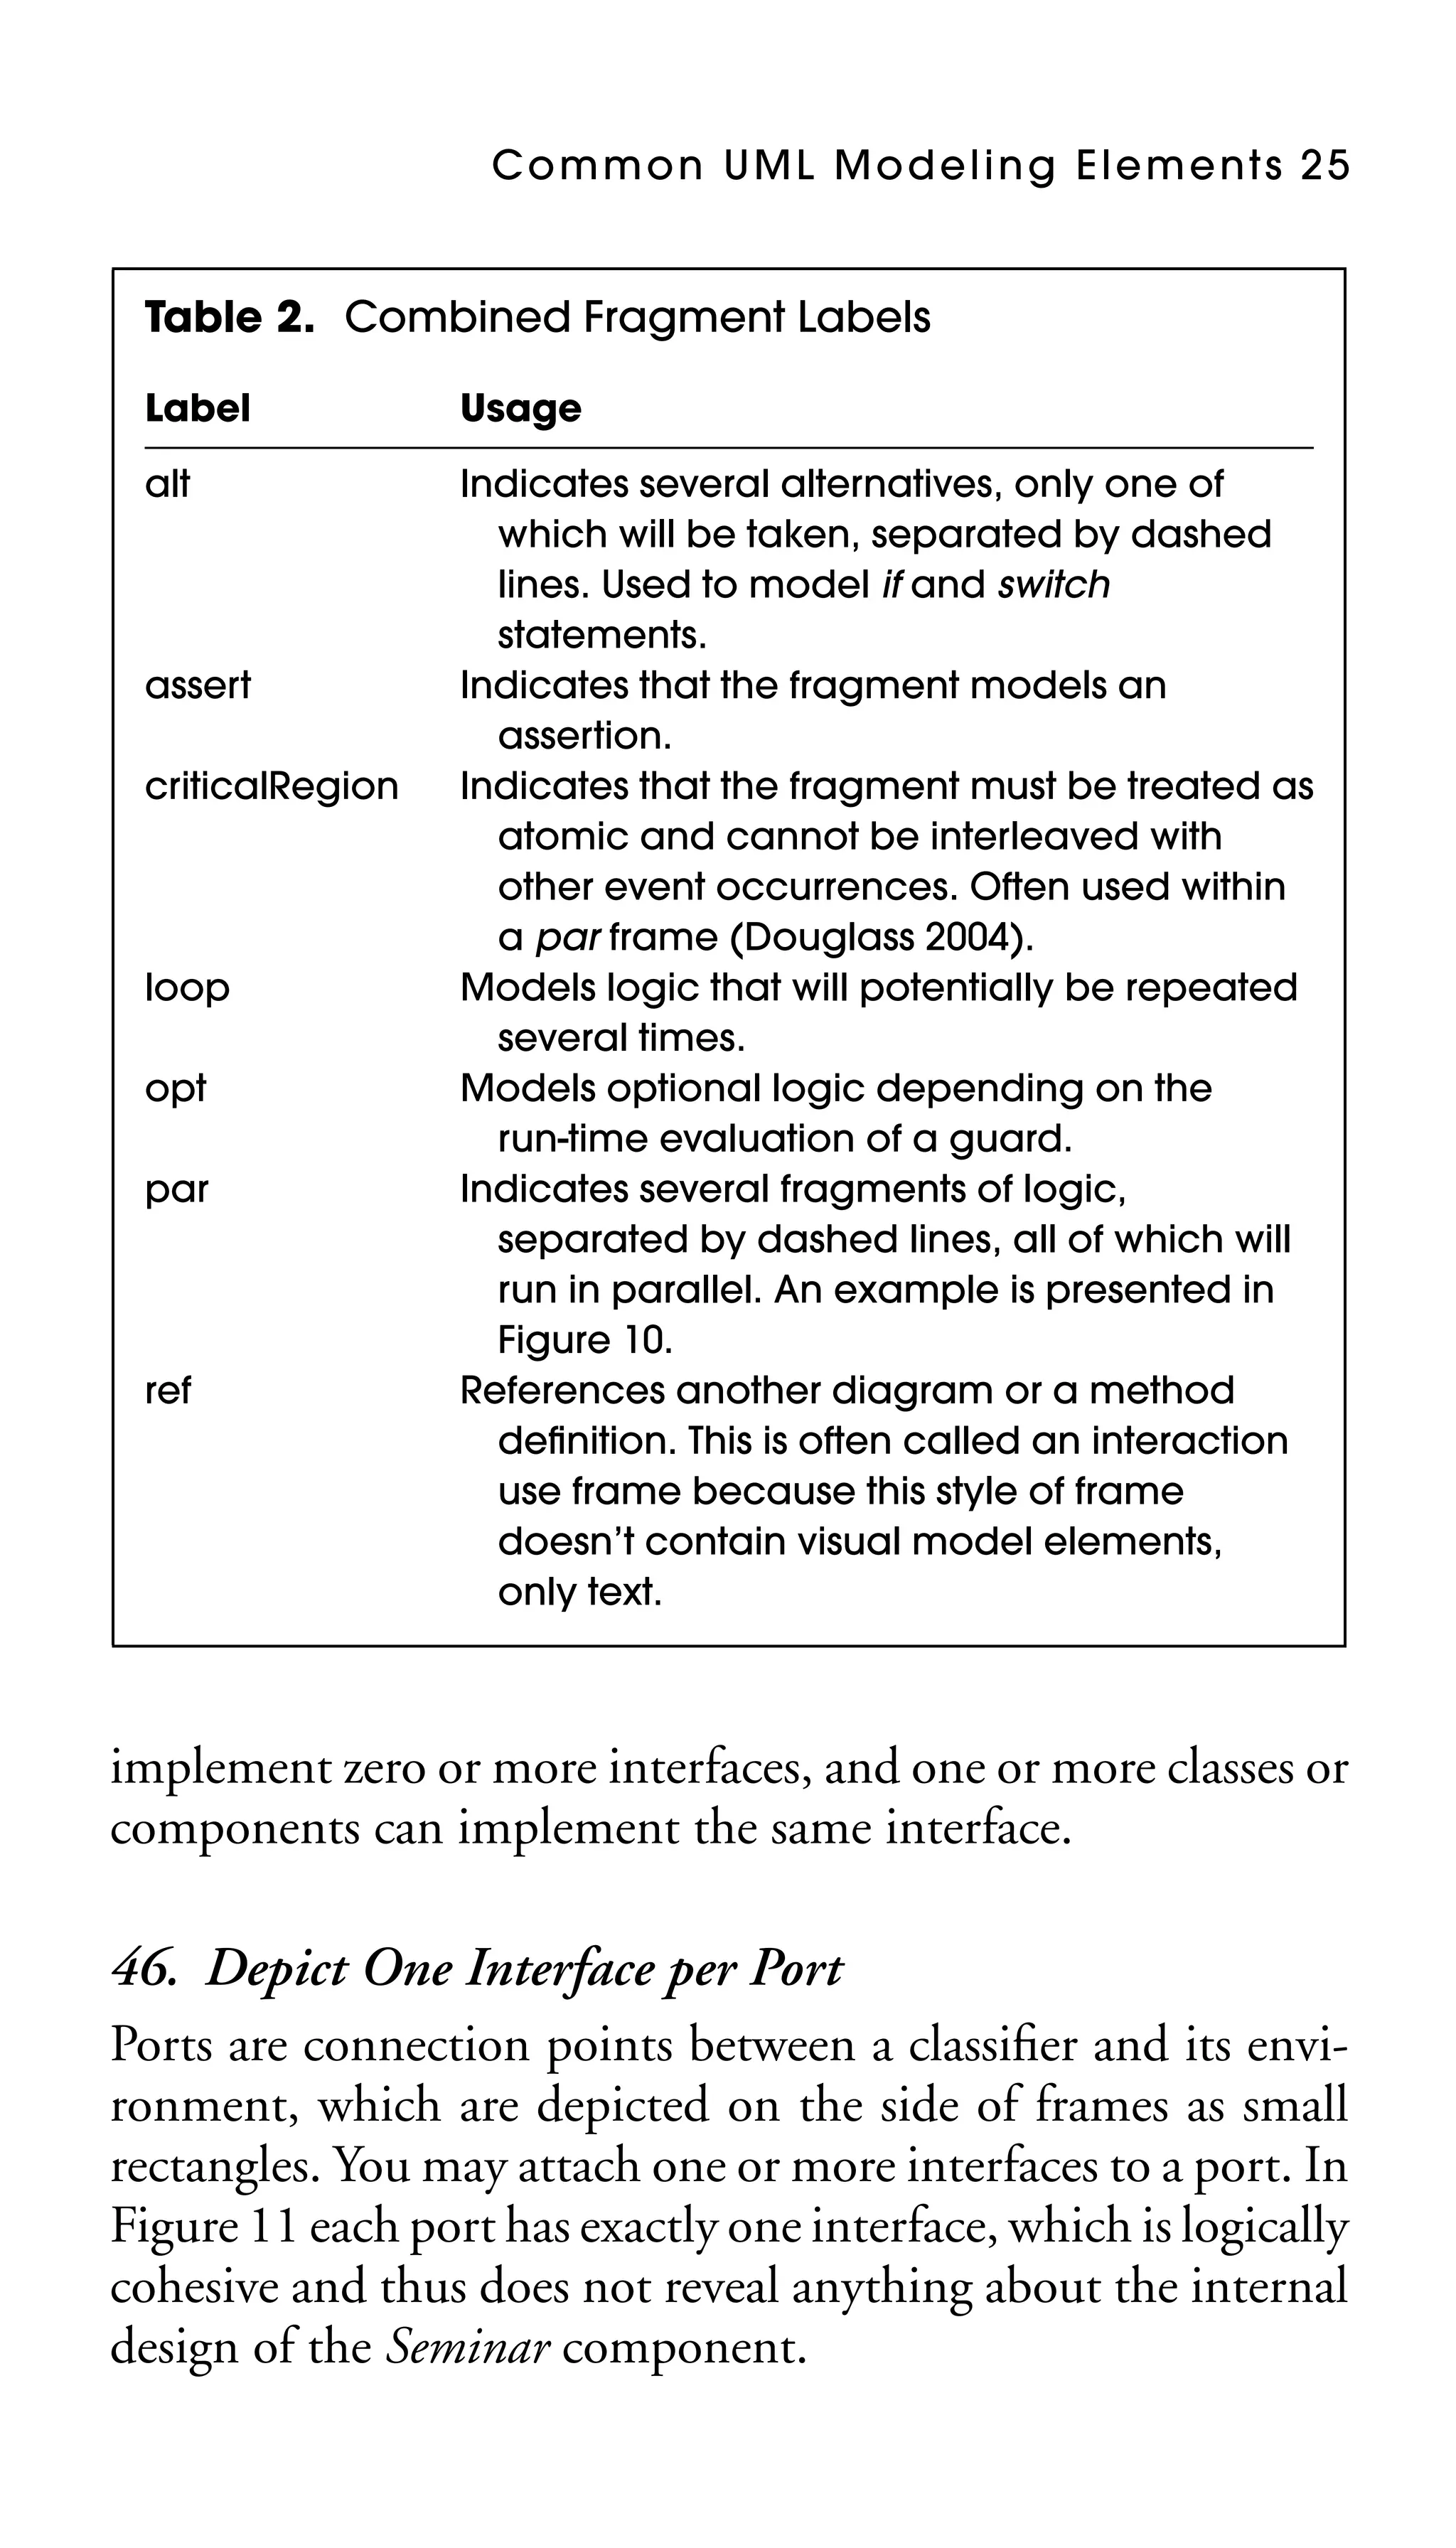
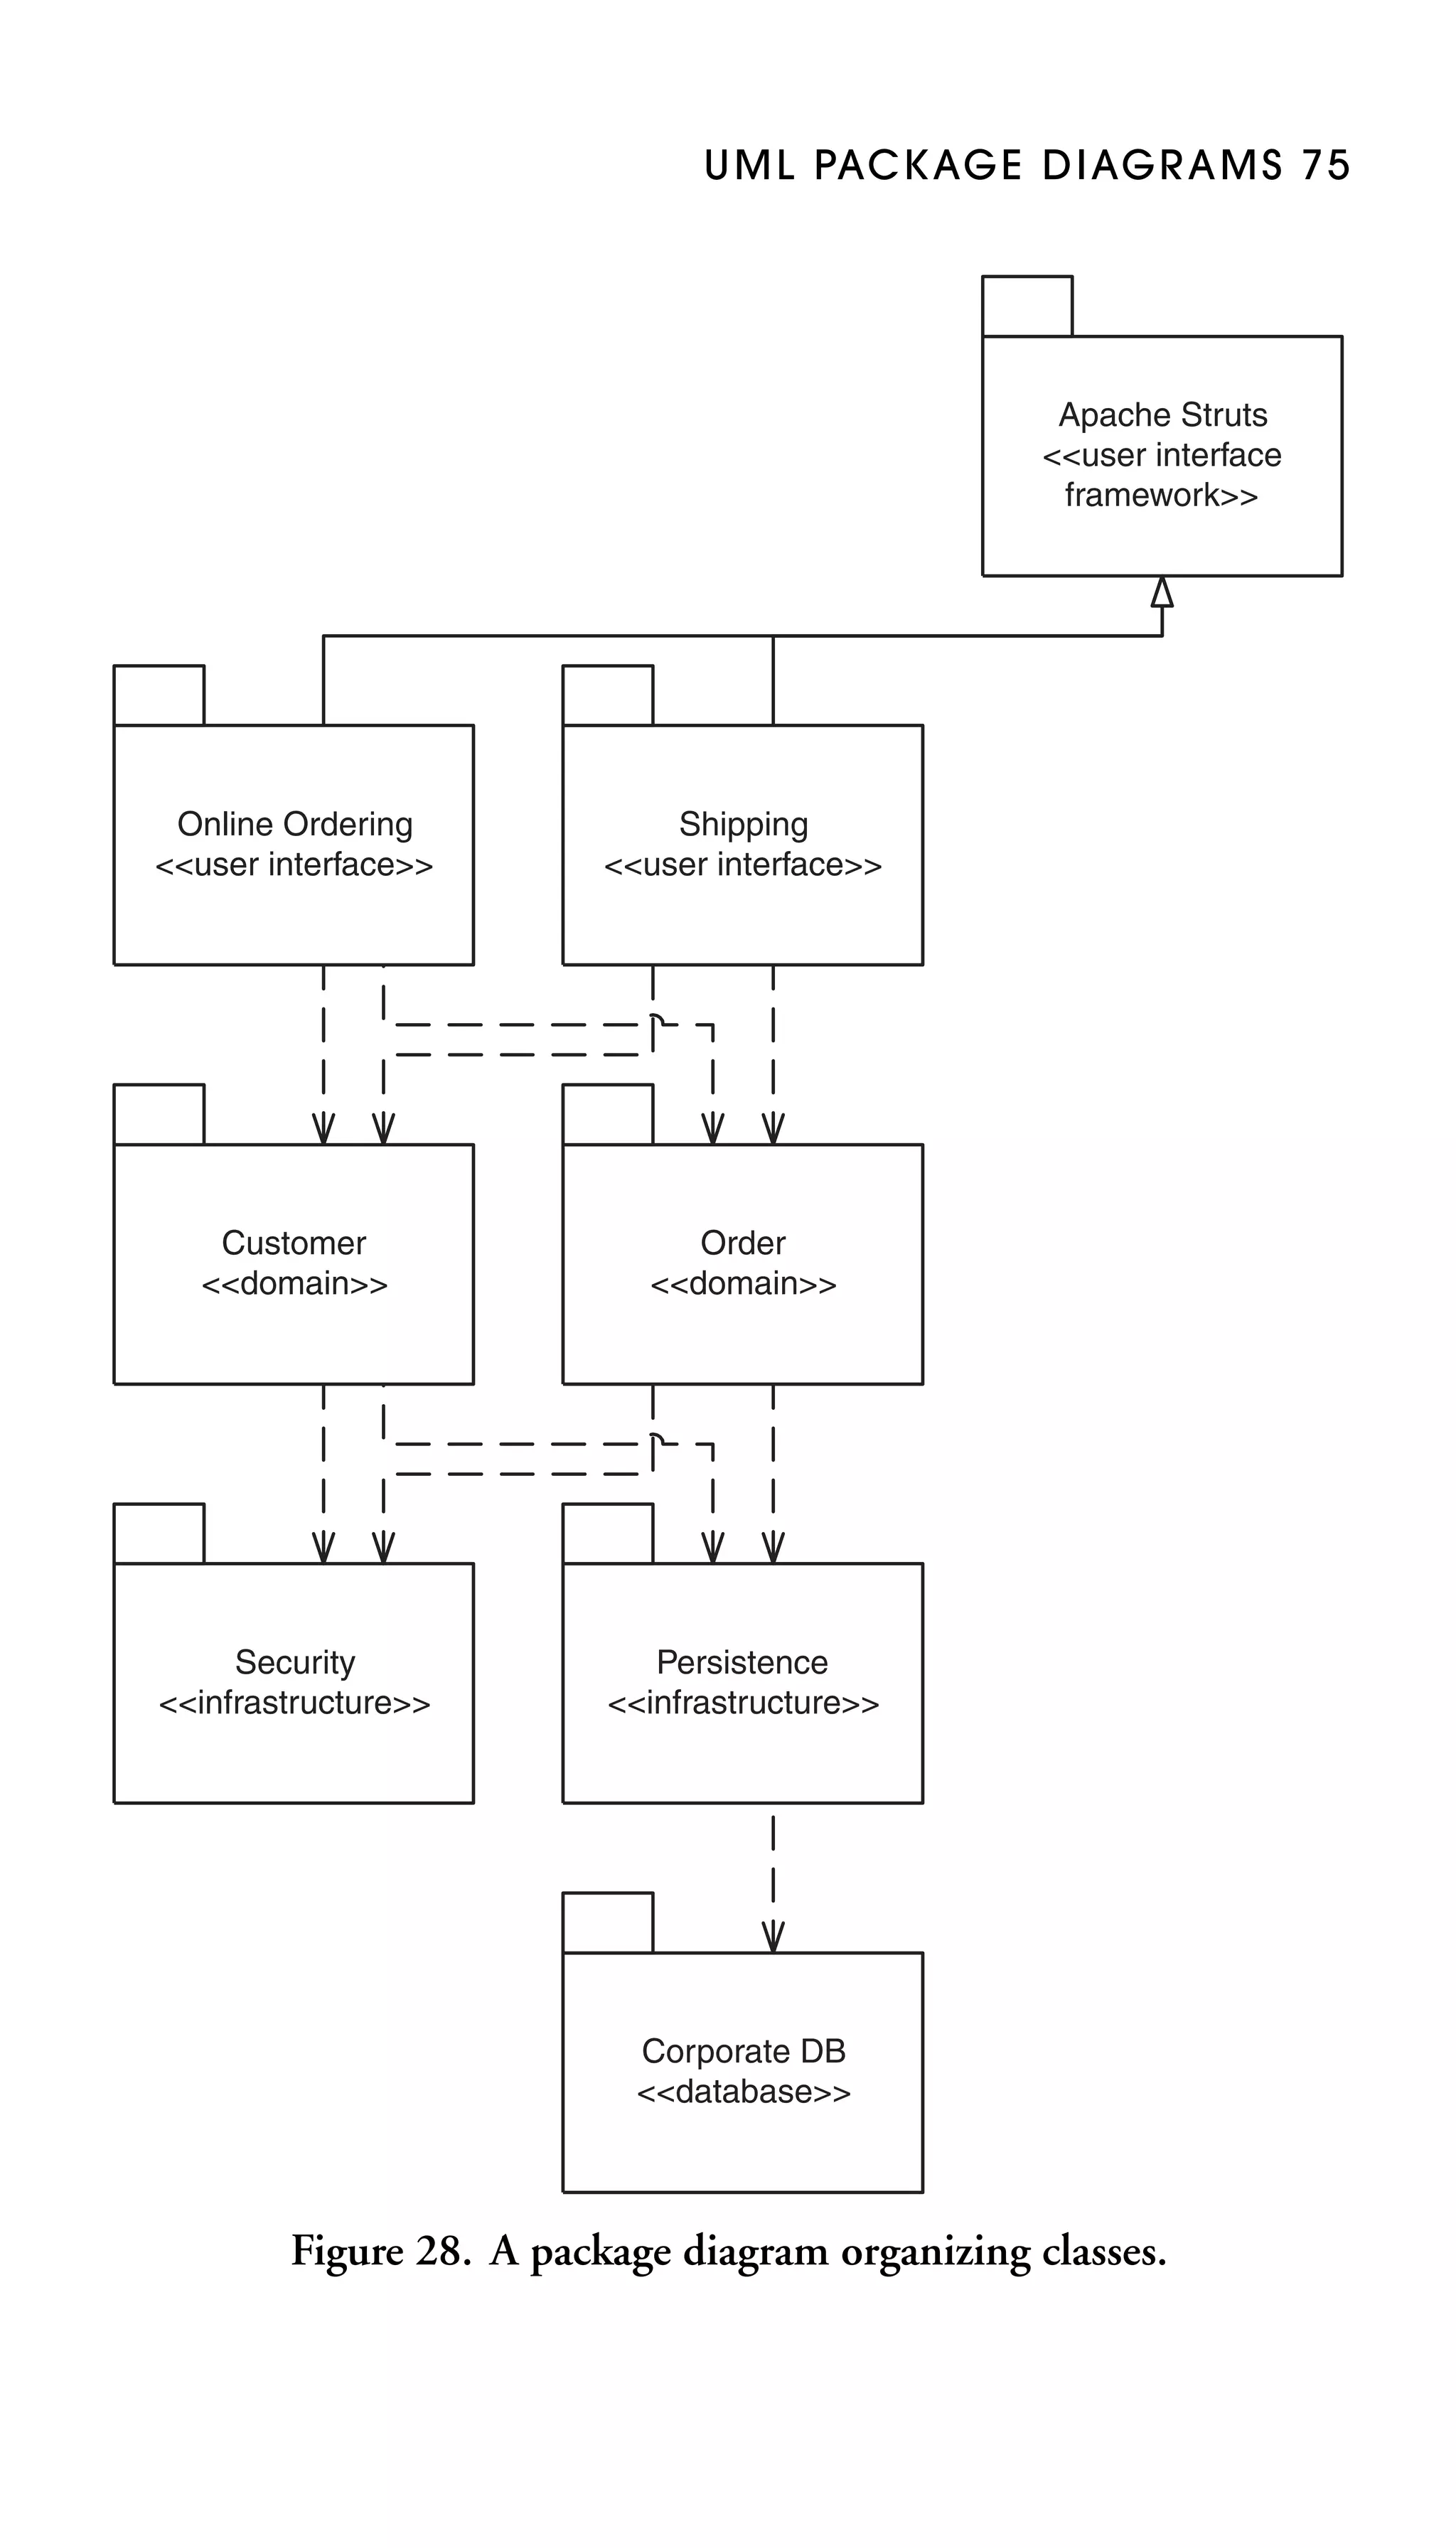
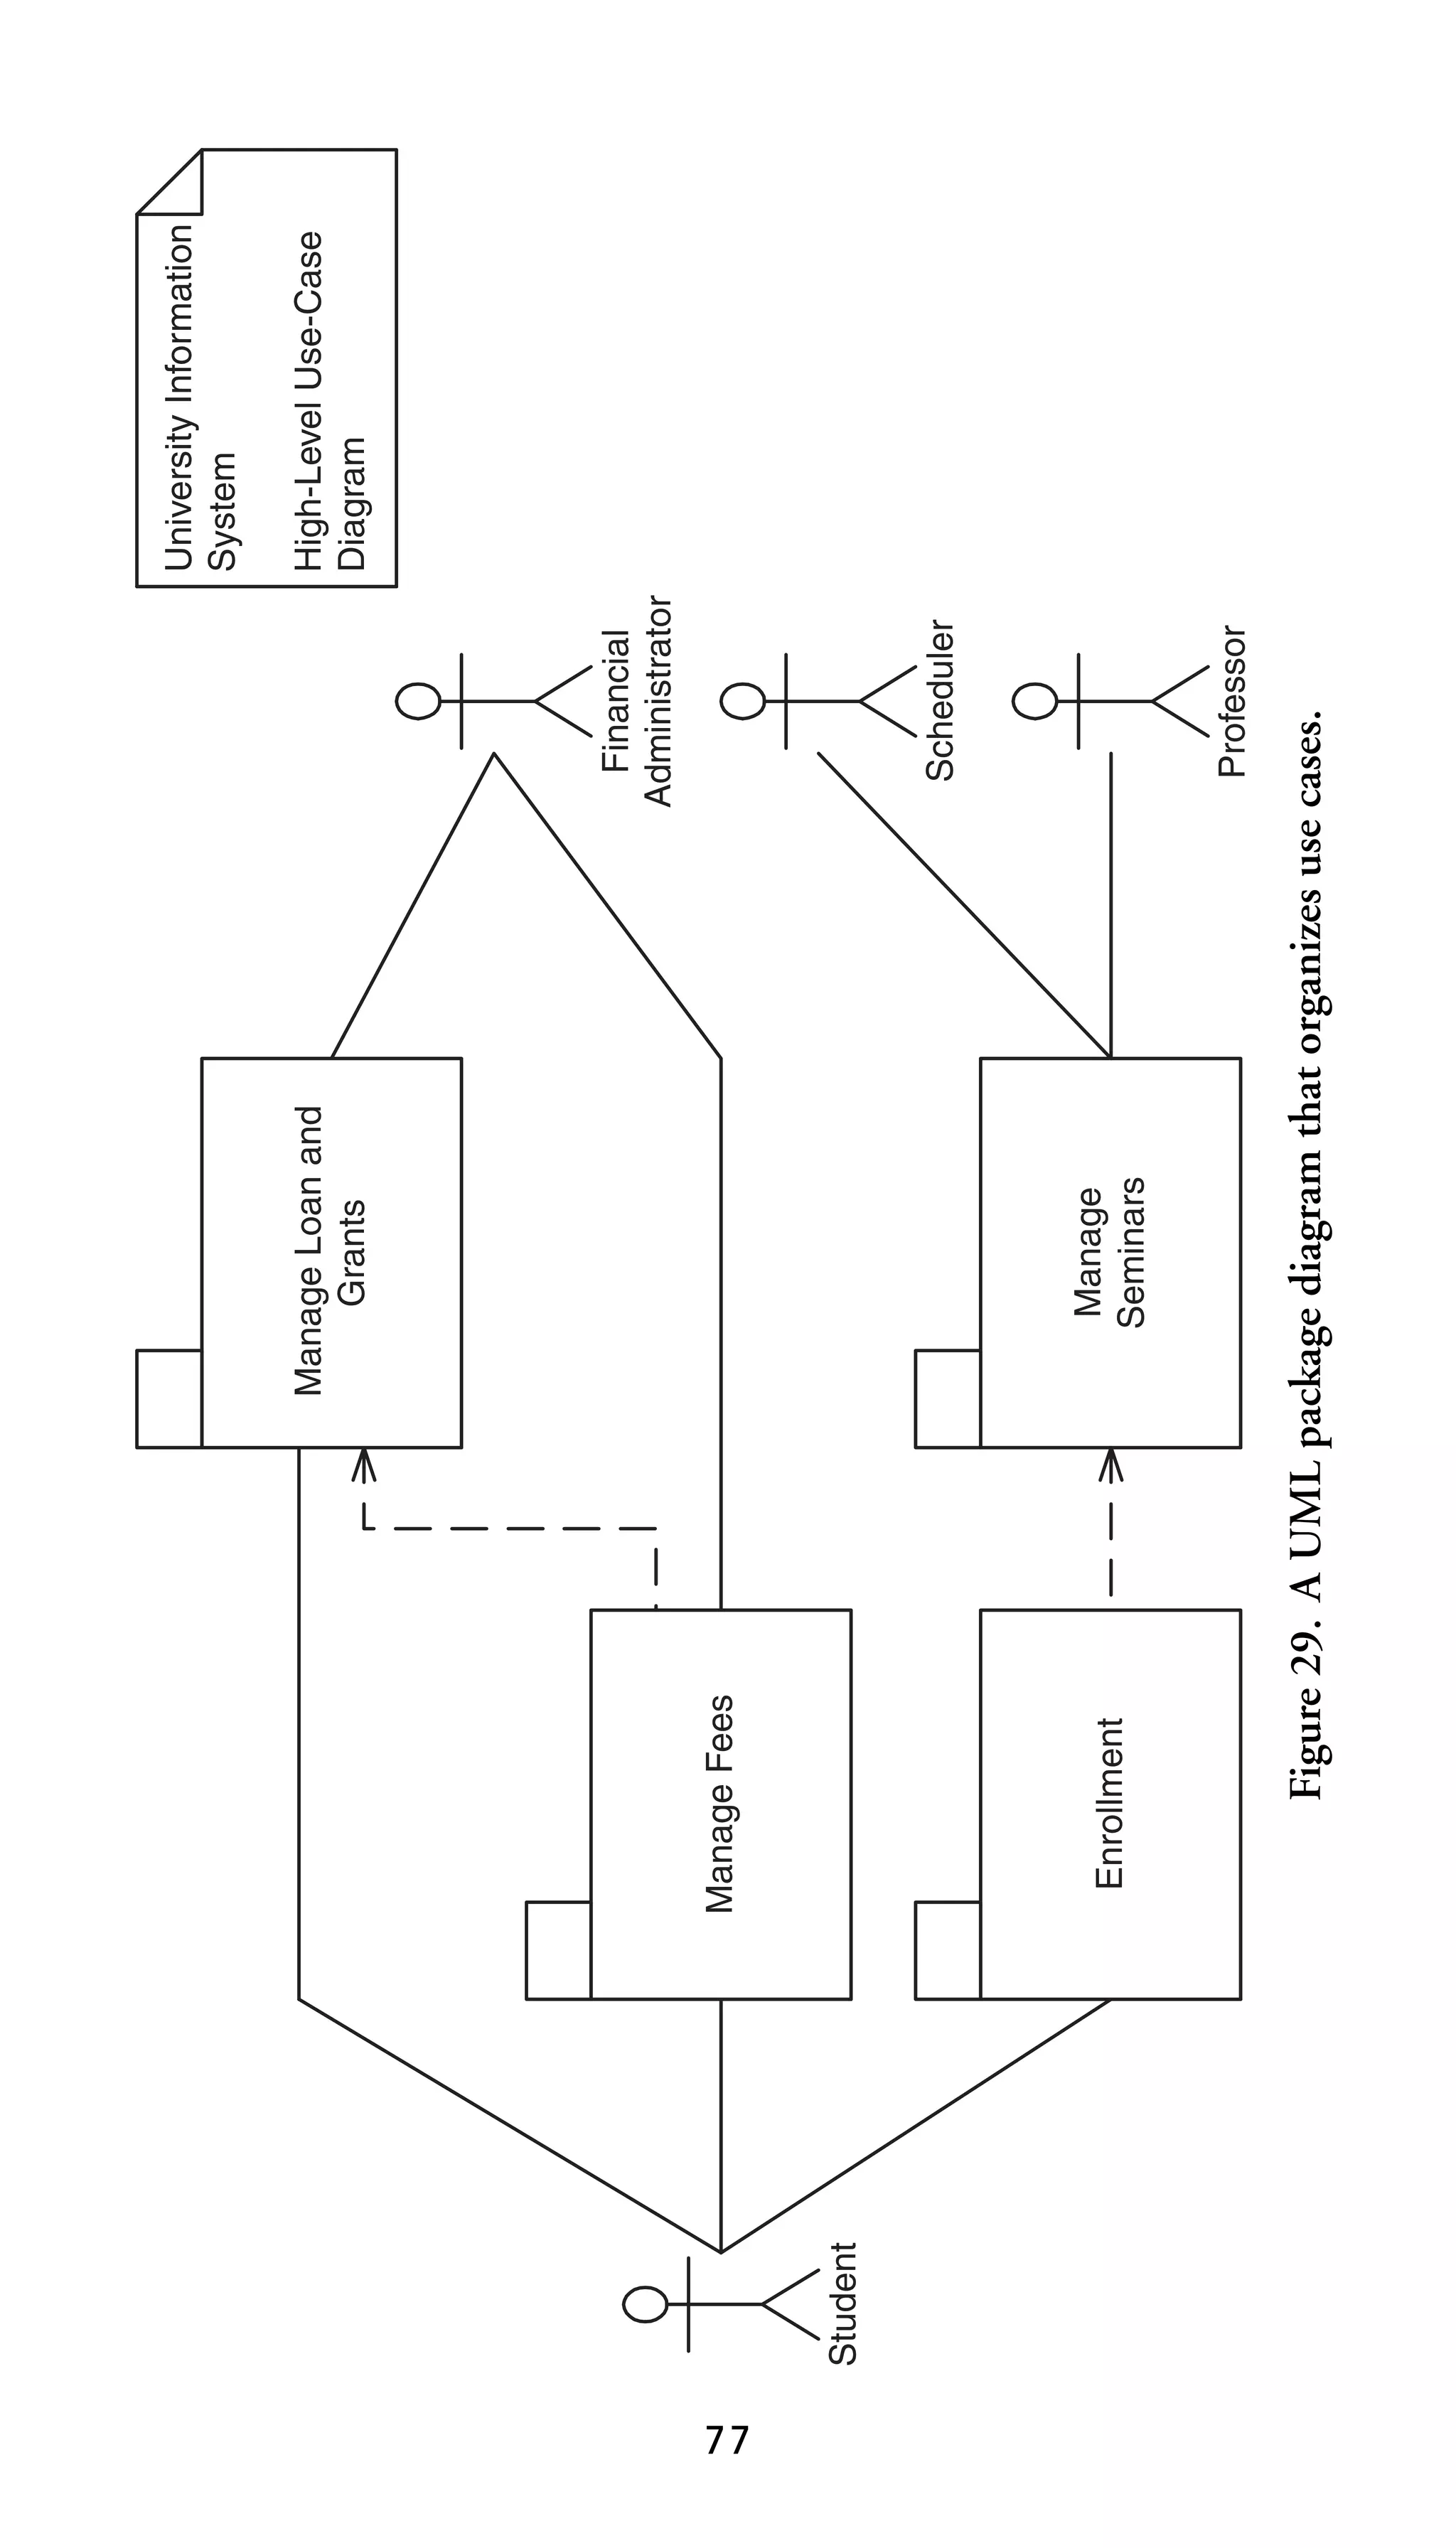
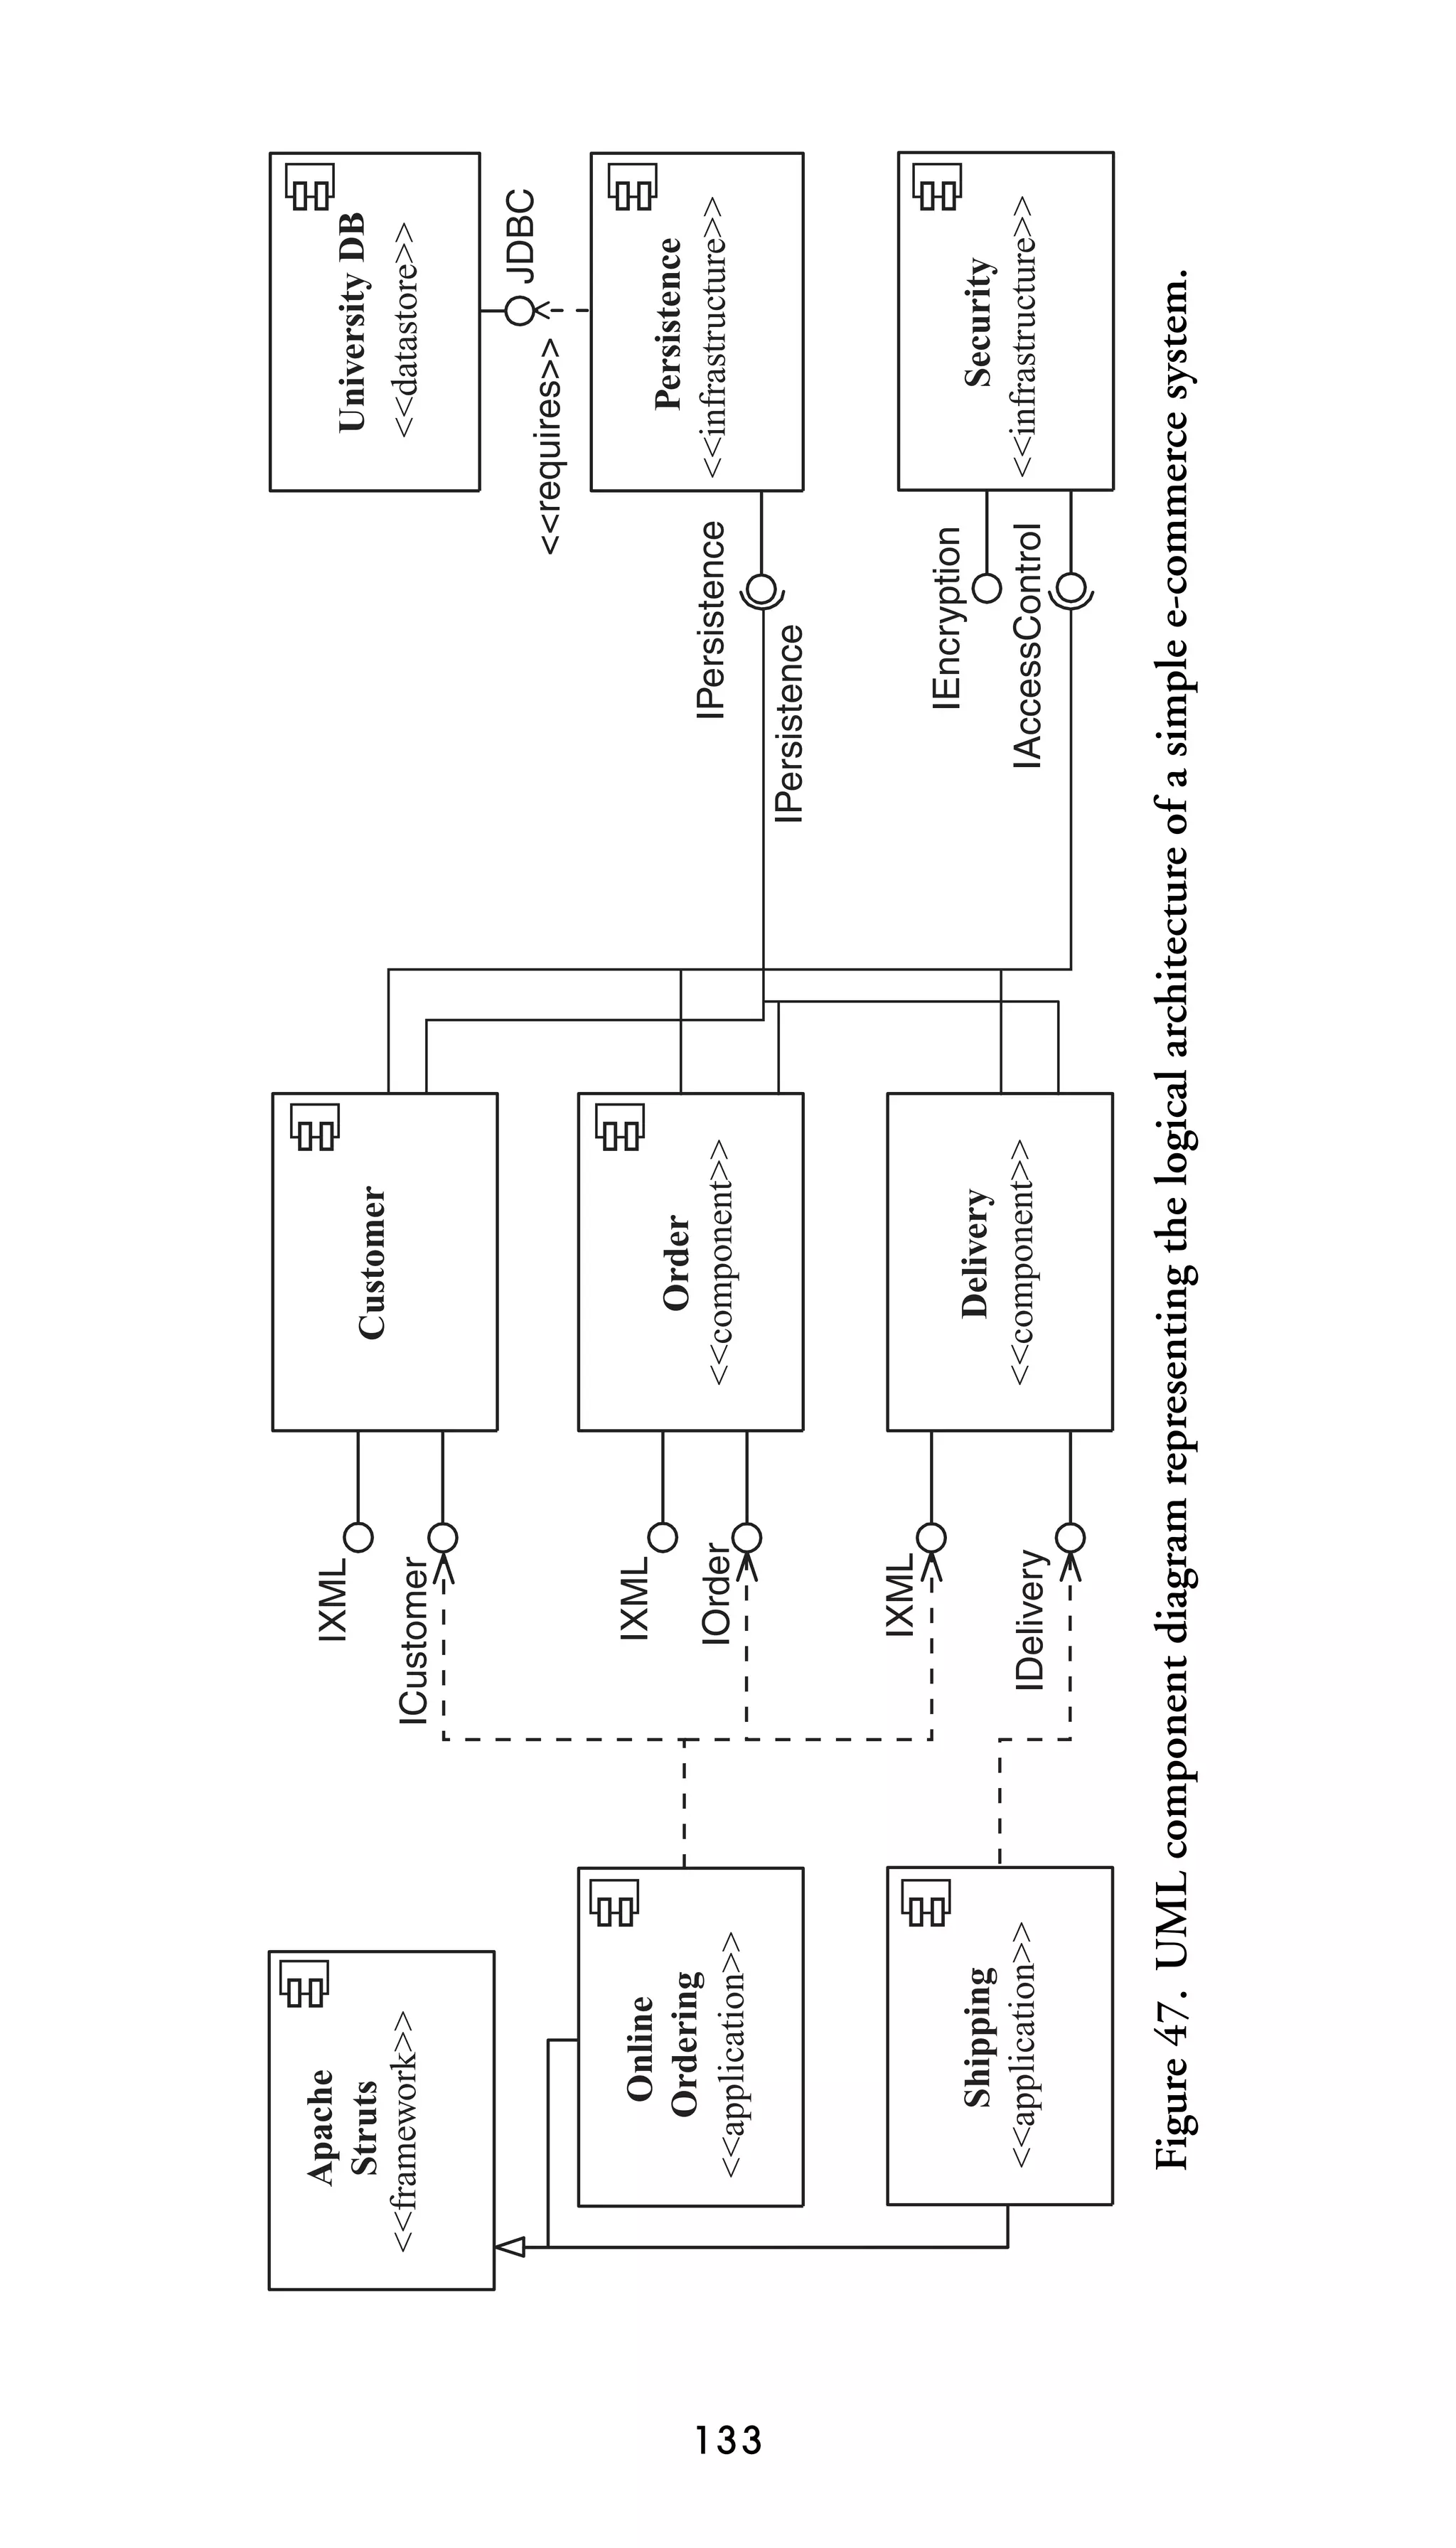
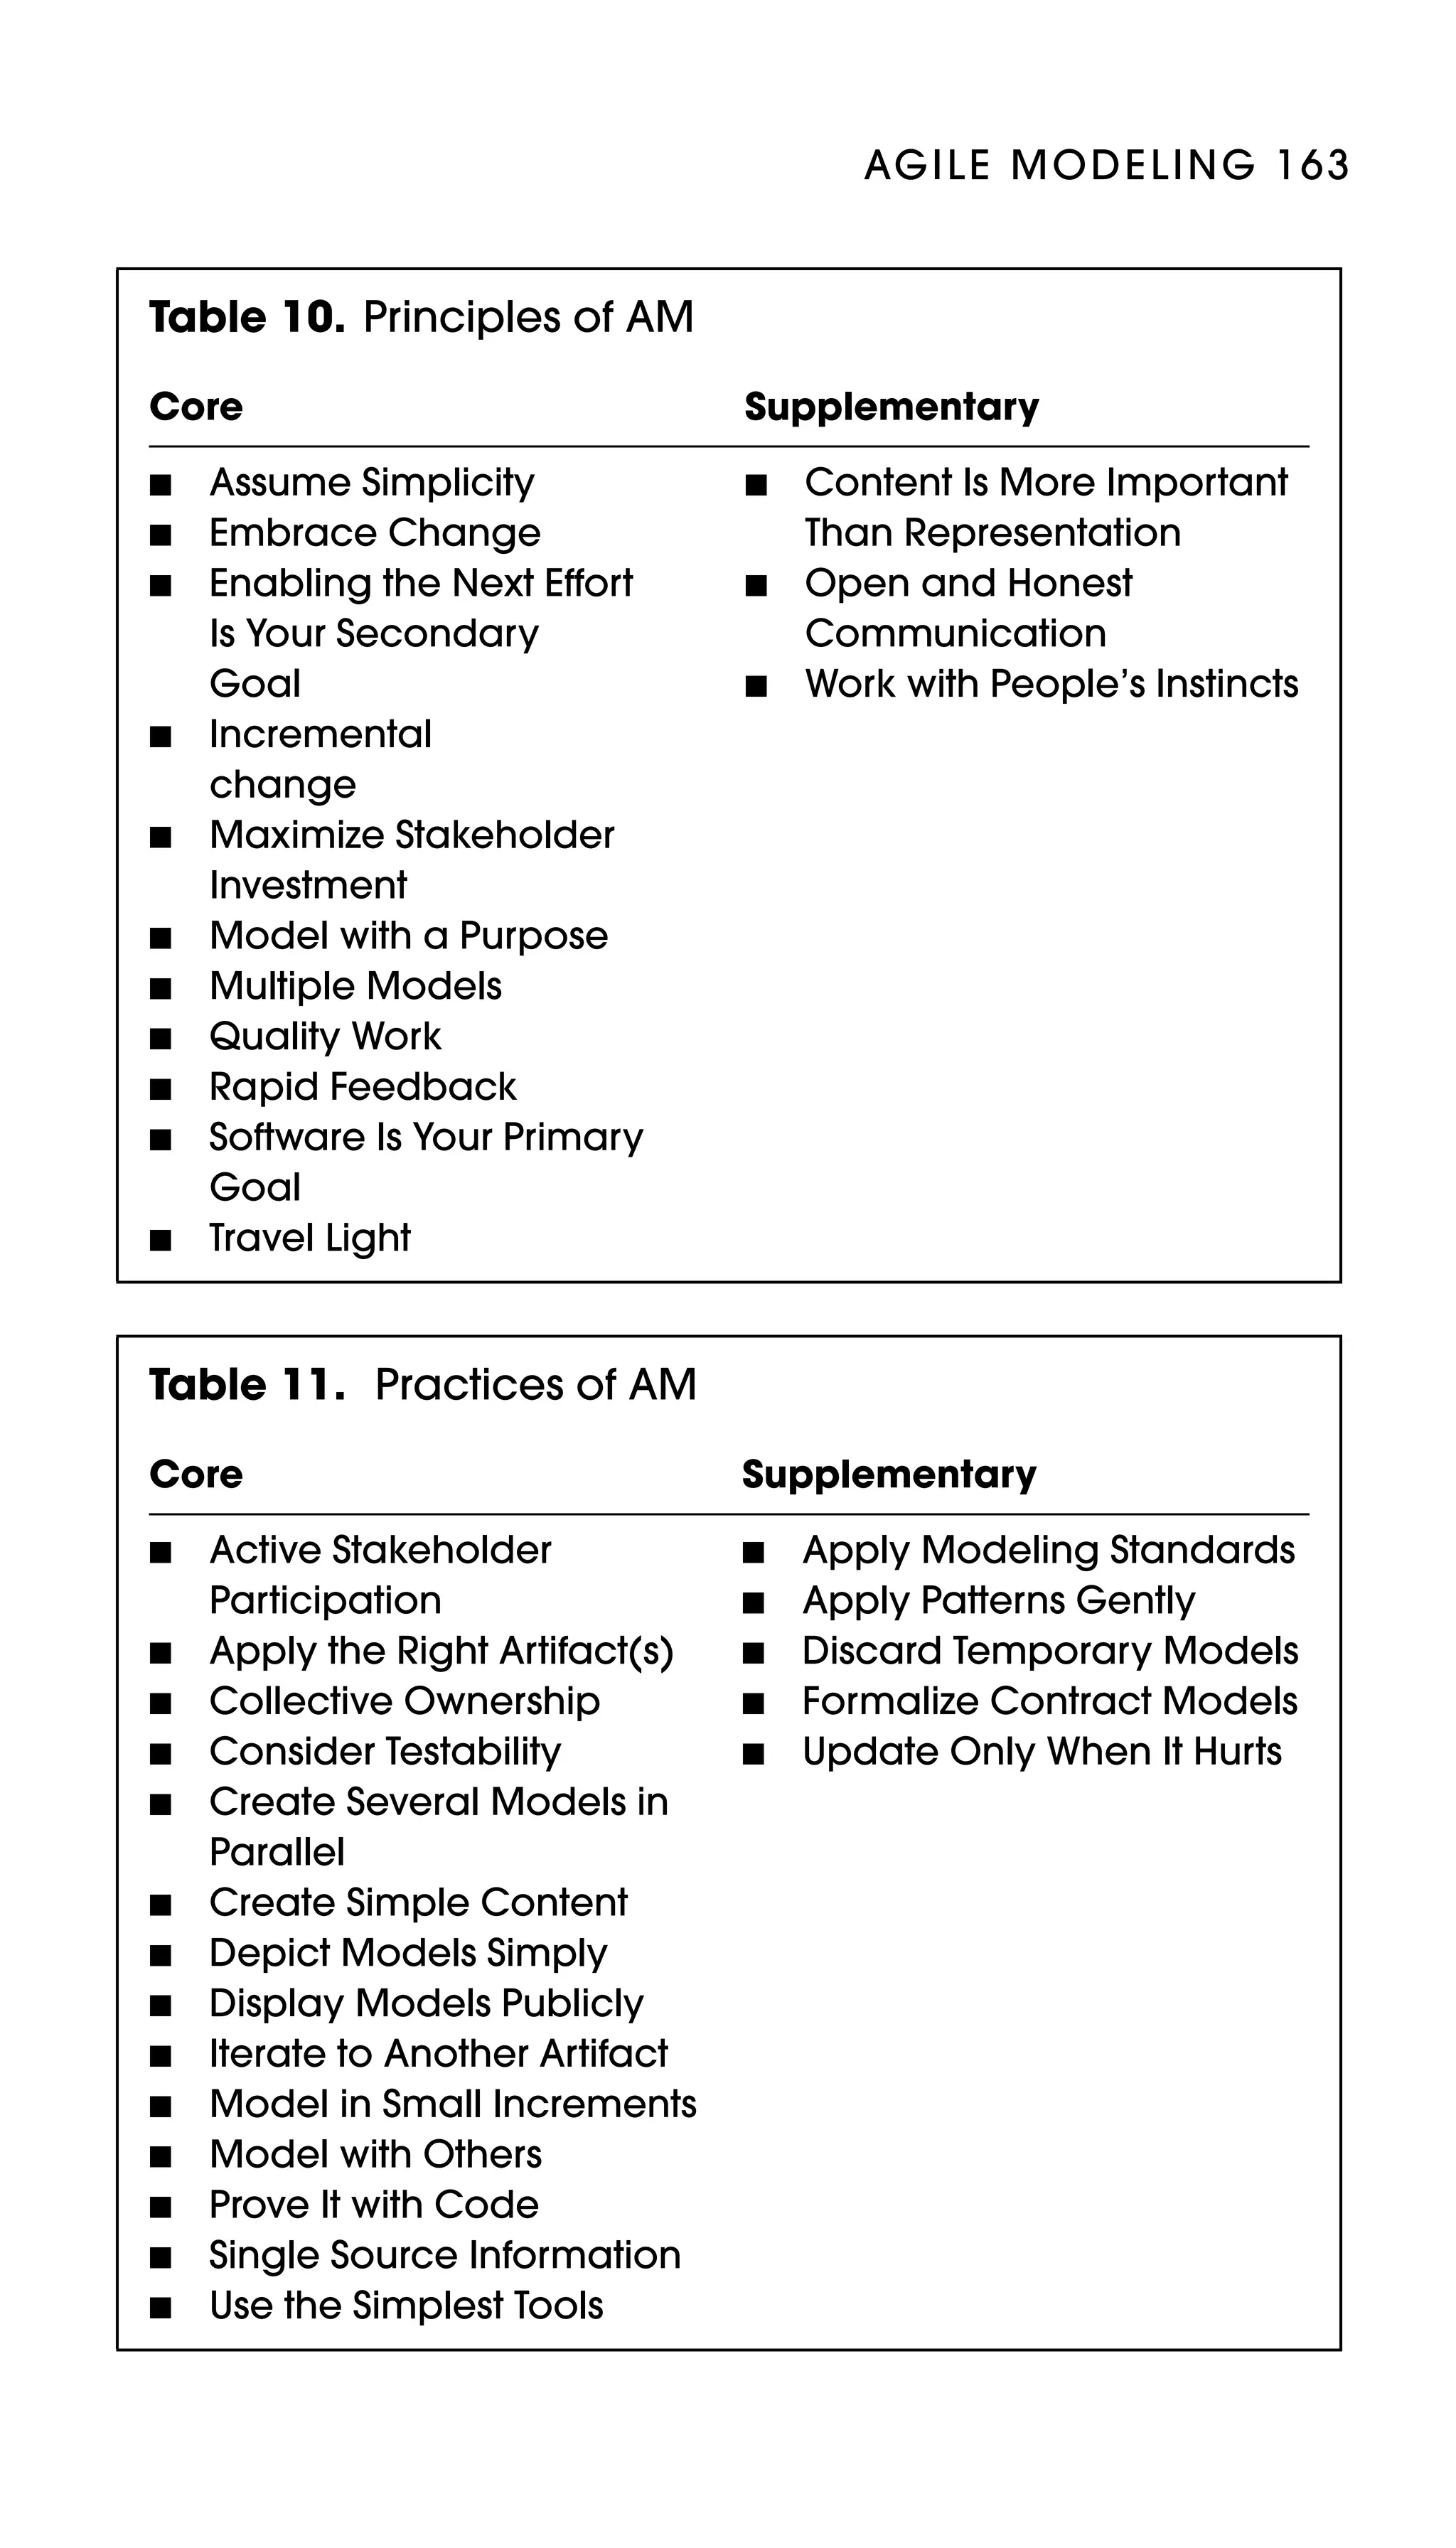
This document provides an introduction and guidelines for creating effective UML diagrams using the Unified Modeling Language (UML) 2.0 standard. It covers general diagramming guidelines as well as specific guidelines for common UML diagrams like use case diagrams, class diagrams, sequence diagrams, and others. The purpose is to define a set of rules and best practices for developing high-quality, readable, and consistent UML diagrams based on proven principles and experience.


![22
ref PrintRun
: TranscriptBatch
[for each seminar]
printer: SharedServices
<<system>>
ref SharedServices.print()
calculateMark()
print(studentTranscript)
getMark()
: Seminar
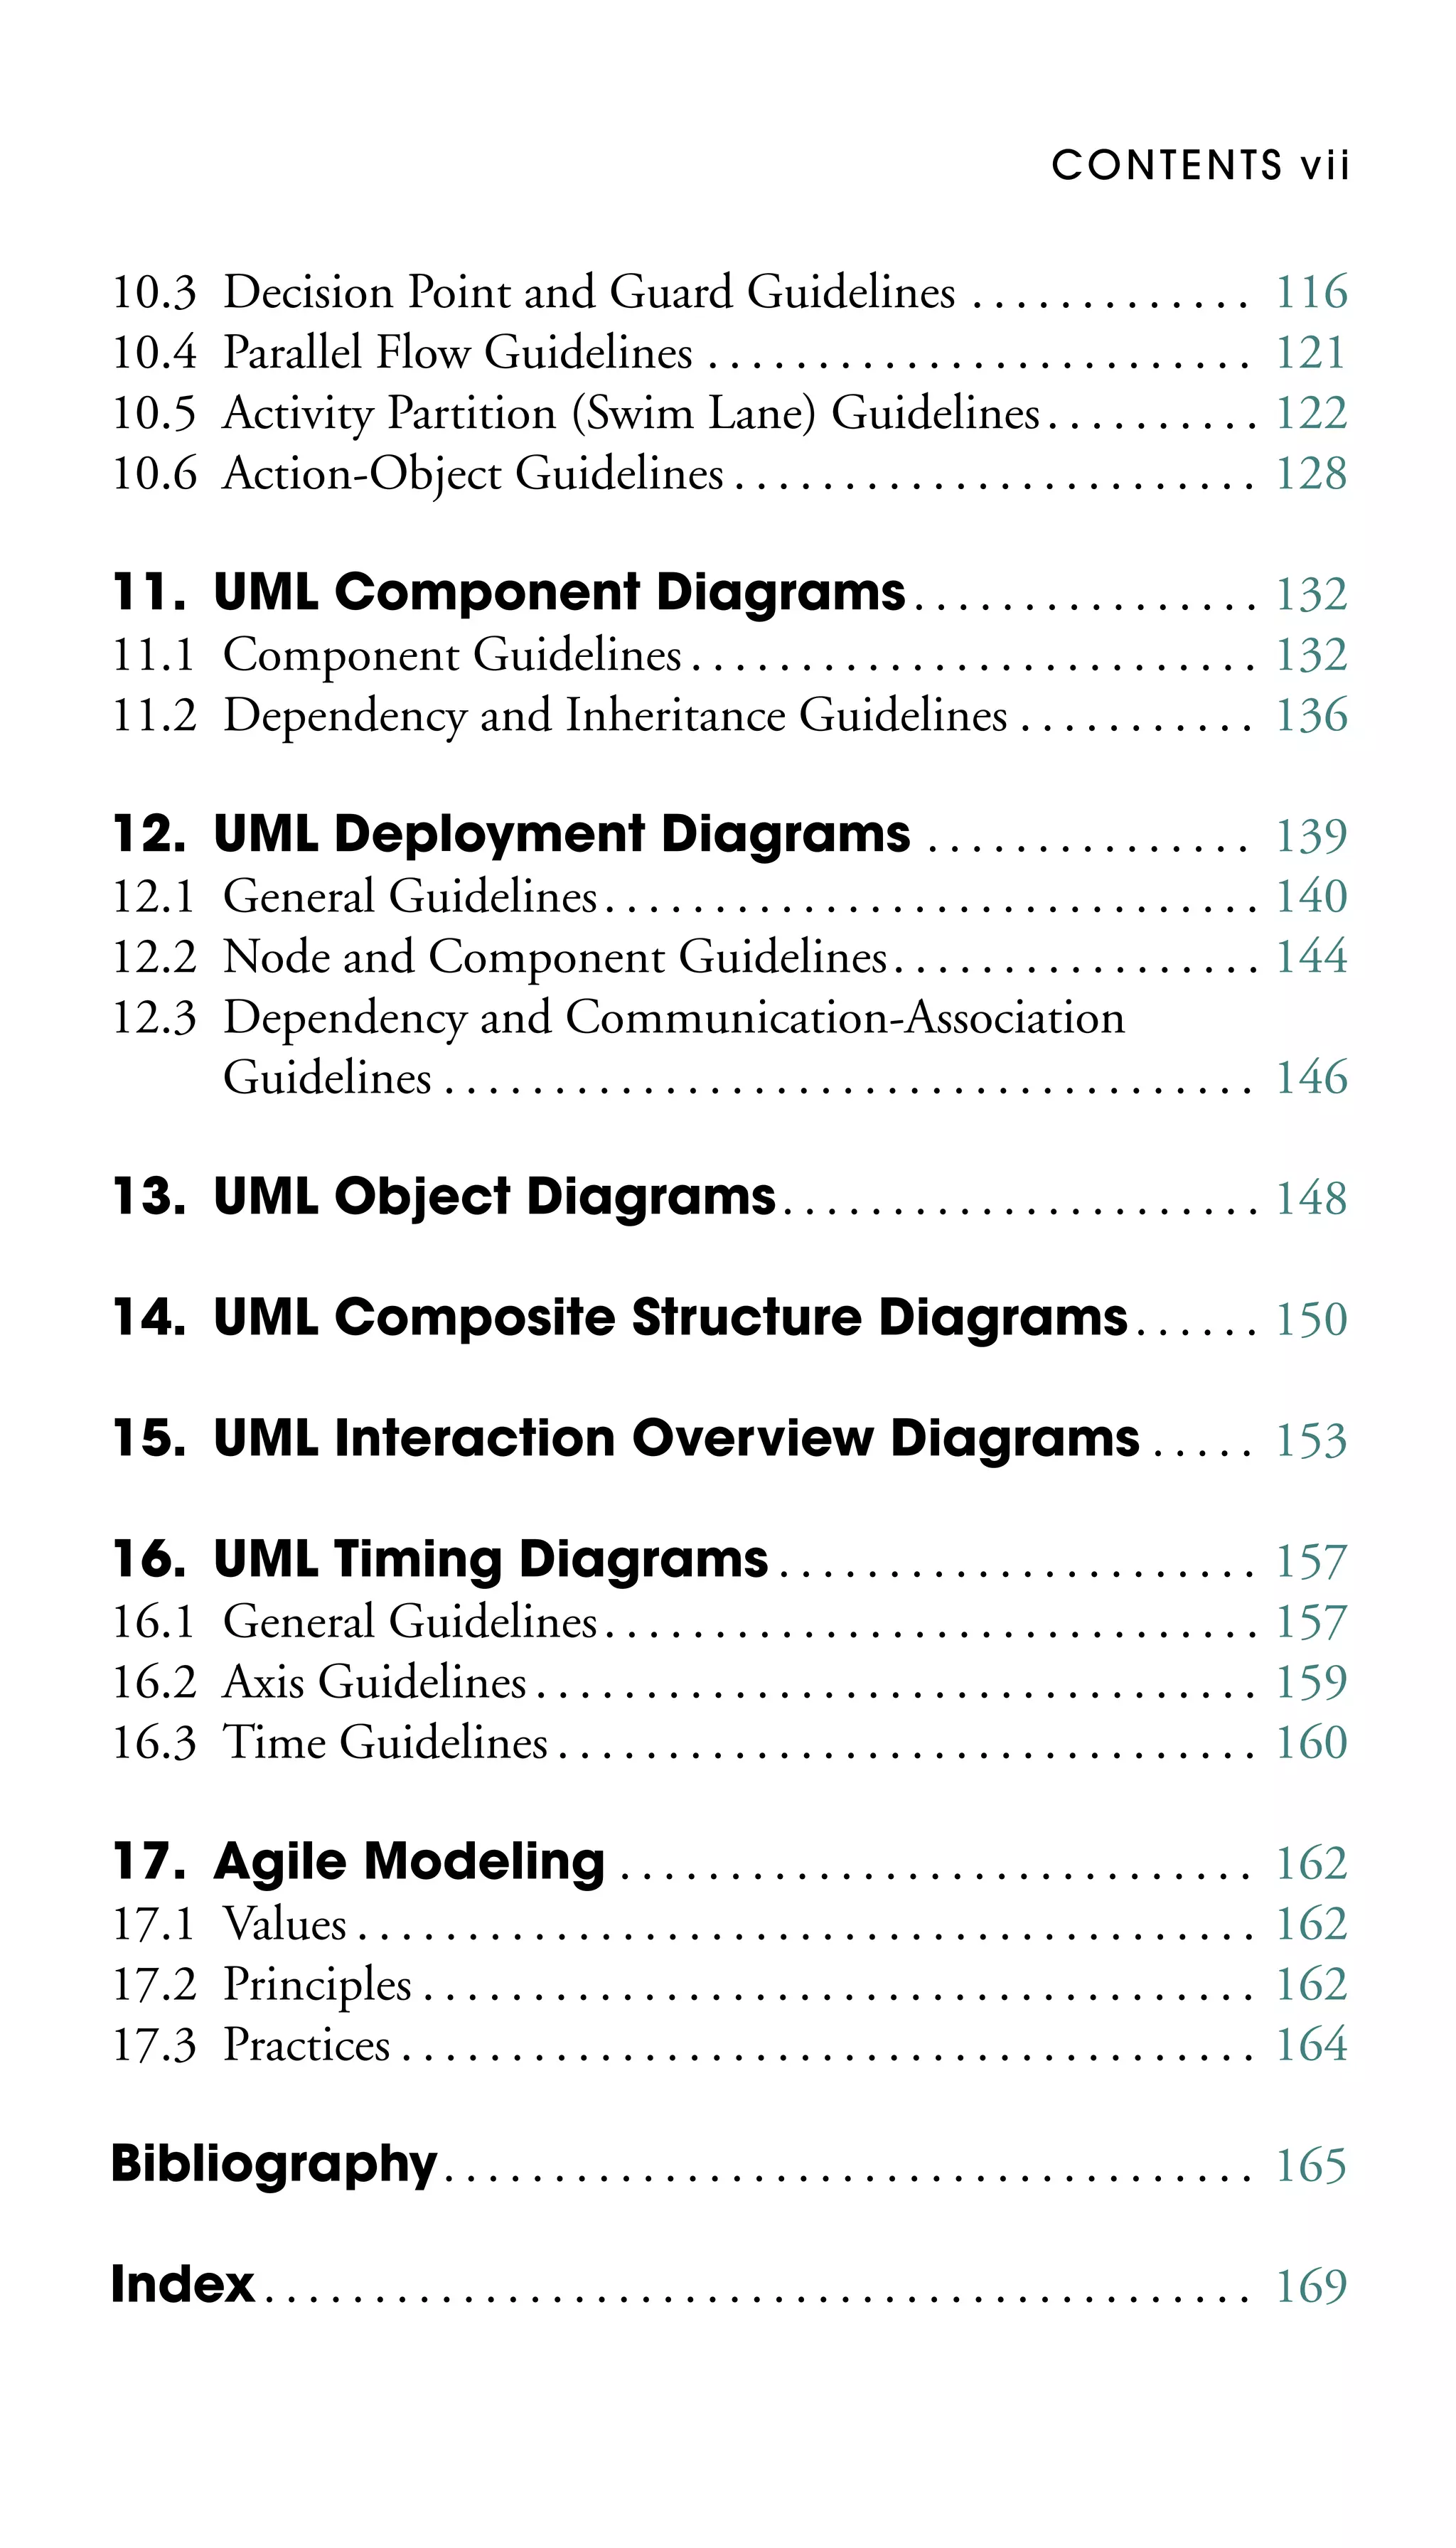
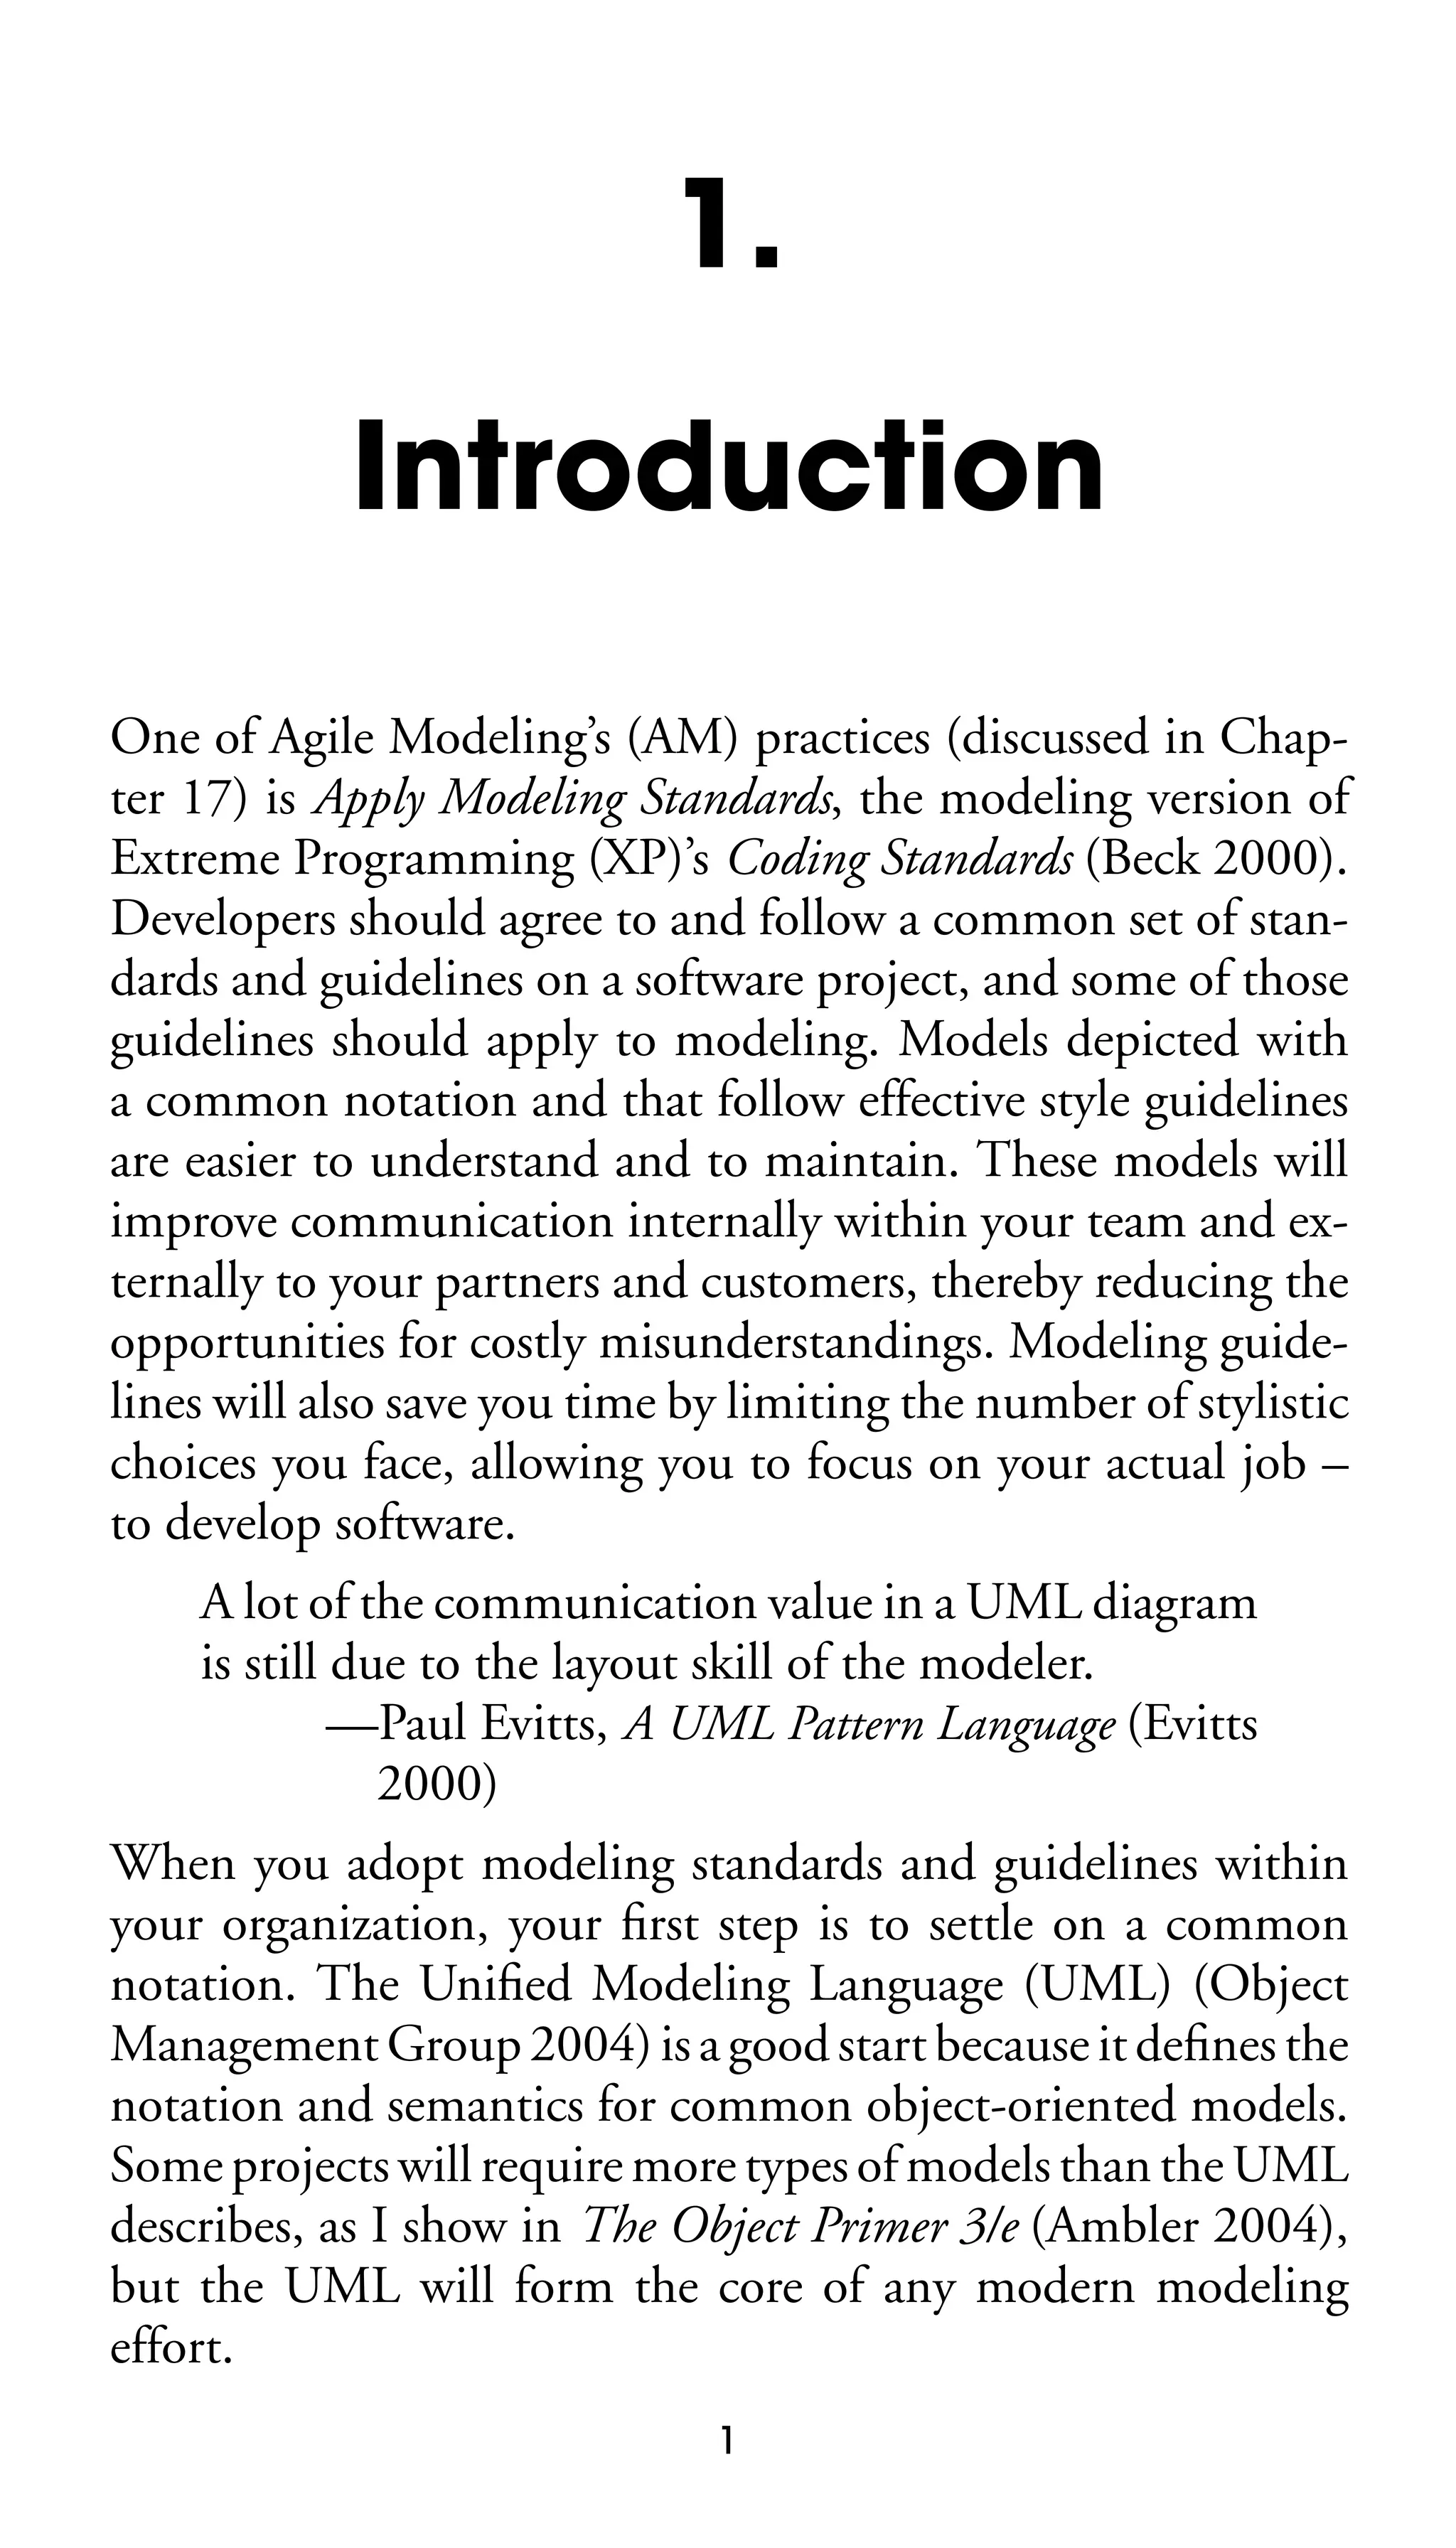
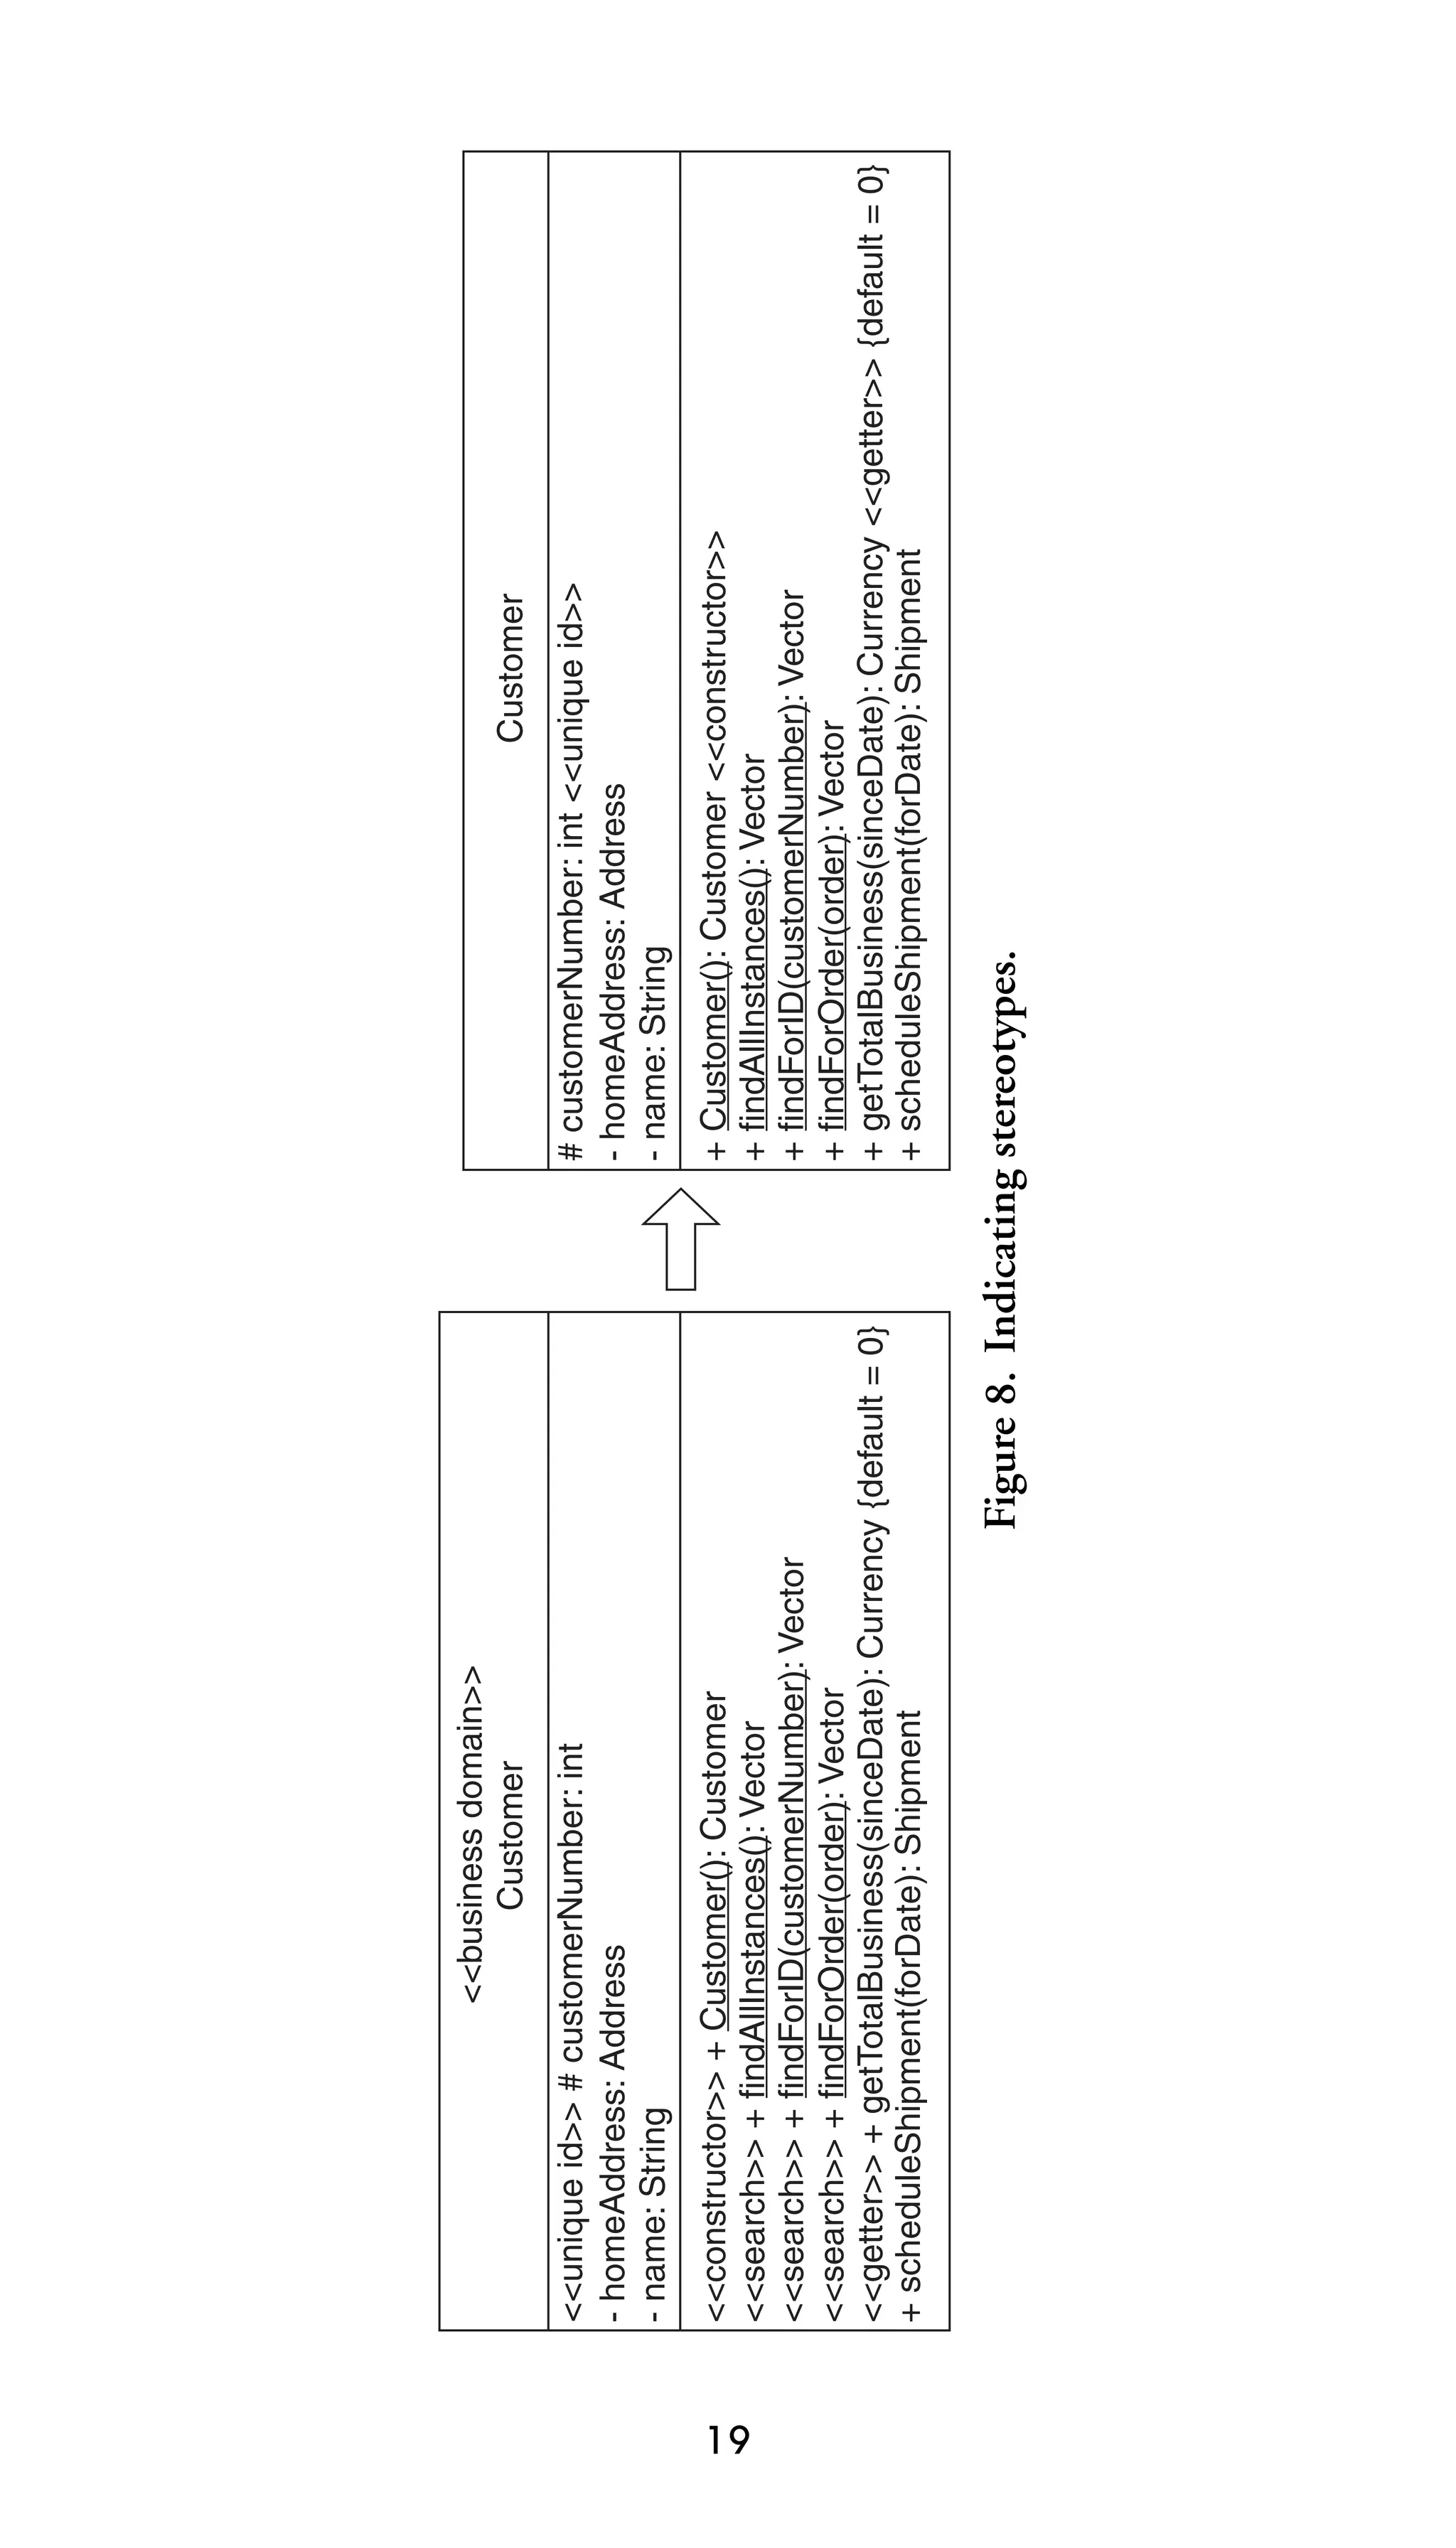
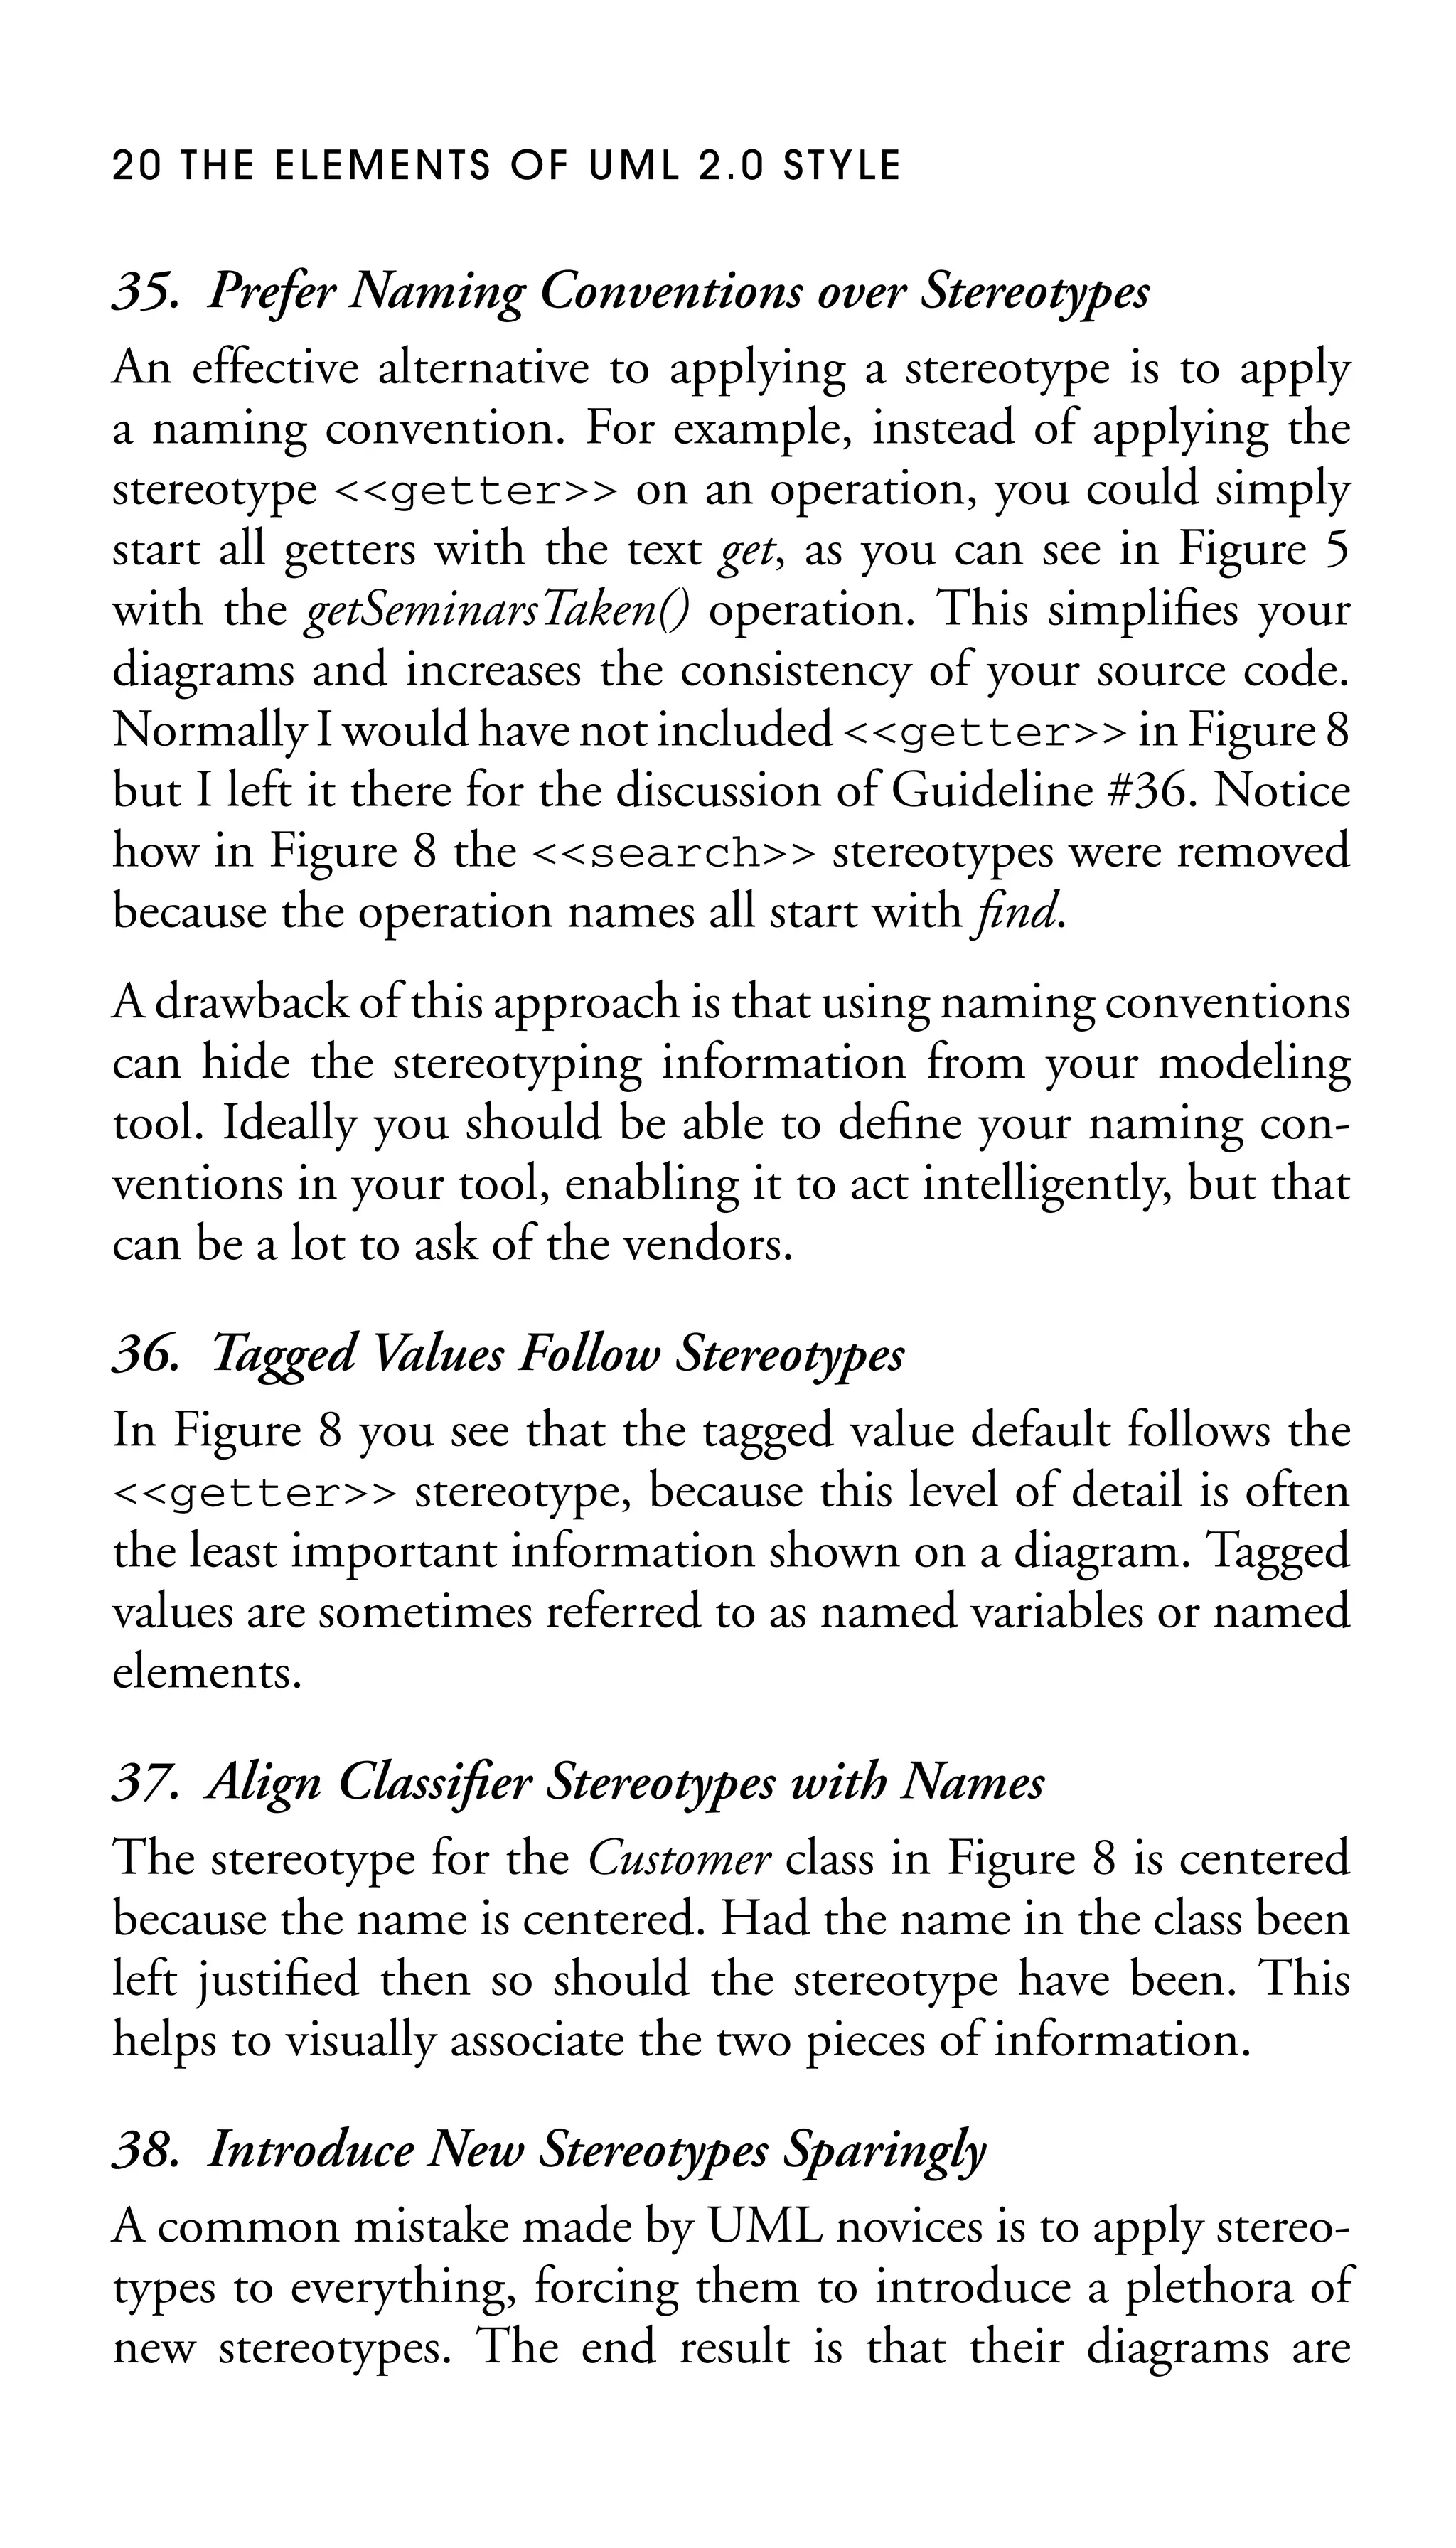
Figure 9. A frame encompassing a sequence diagram.
loop
student:
Student
getSeminars()
: TranscriptBuilder
new(student)
sd Batch Transcript Printing](https://image.slidesharecdn.com/2005-050521616786theelementsofuml2style-131128083647-phpapp02/75/the-elements-of-uml-2-style-35-2048.jpg)
![U M L U S E - CA S E D I AG R A M S 4 3
that you are taking a functional decomposition approach to
your usage requirements. Functional decomposition is a design activity, and you should avoid reflecting design decisions
within your requirements artifacts.
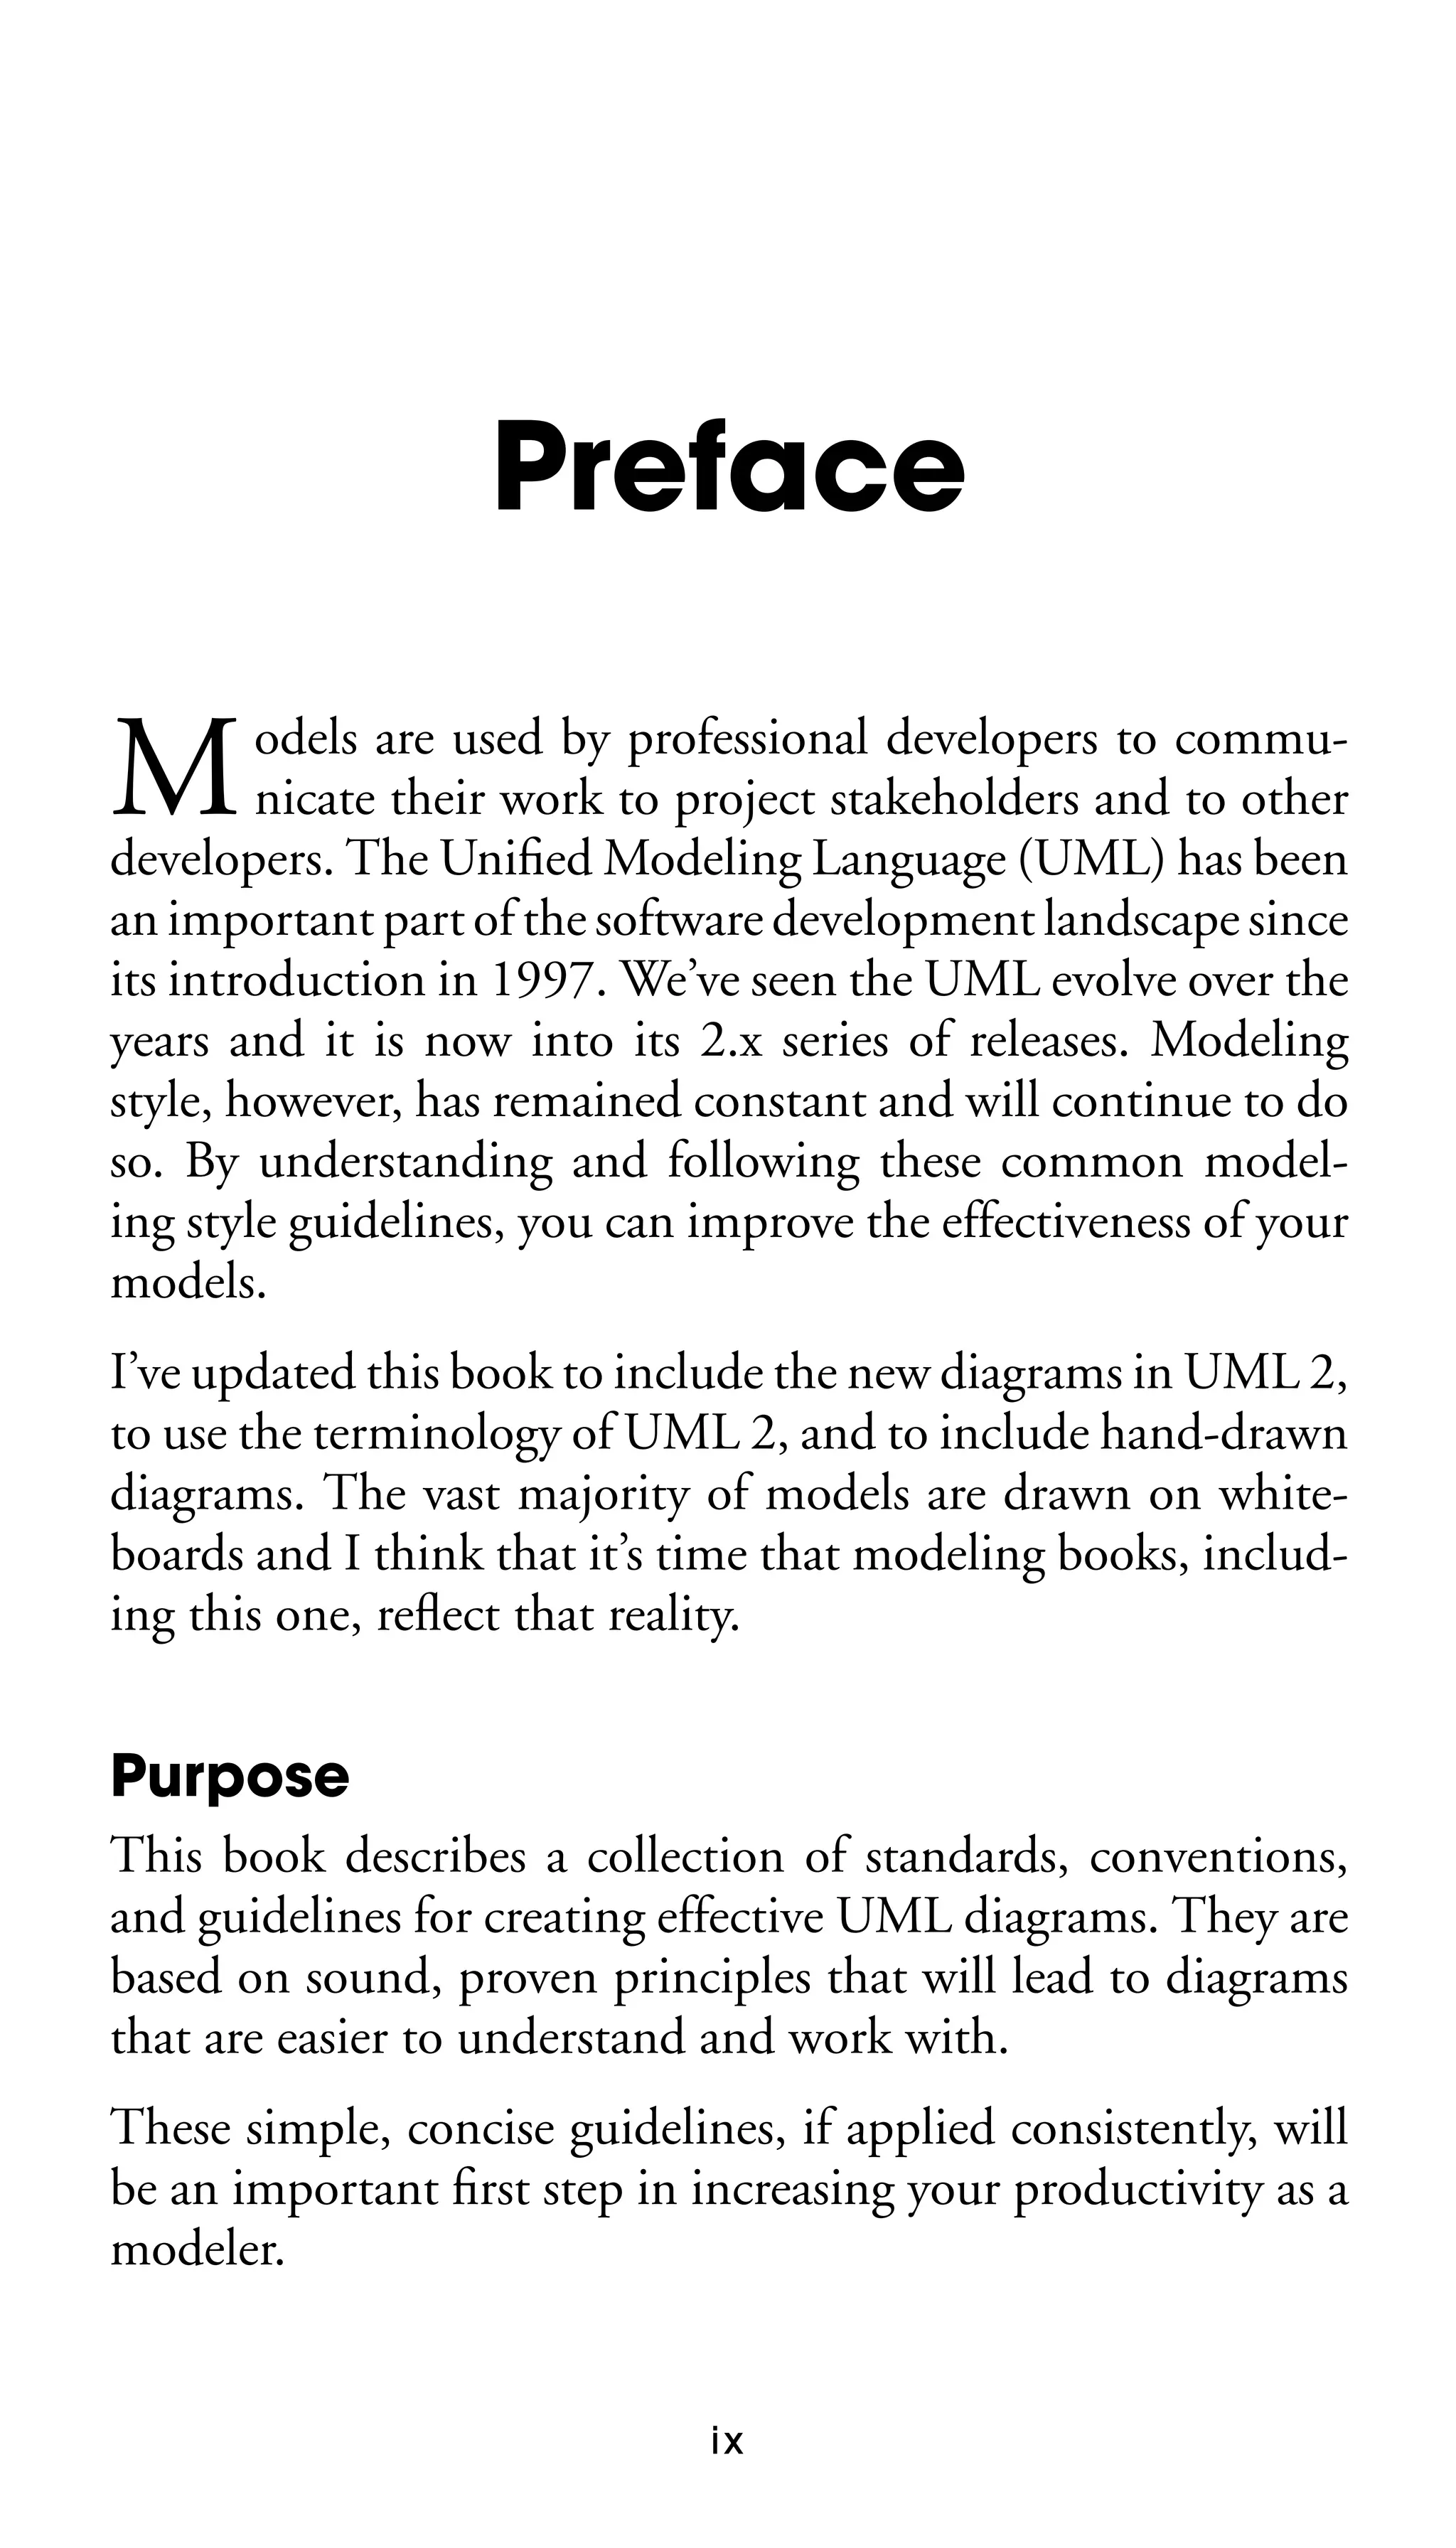
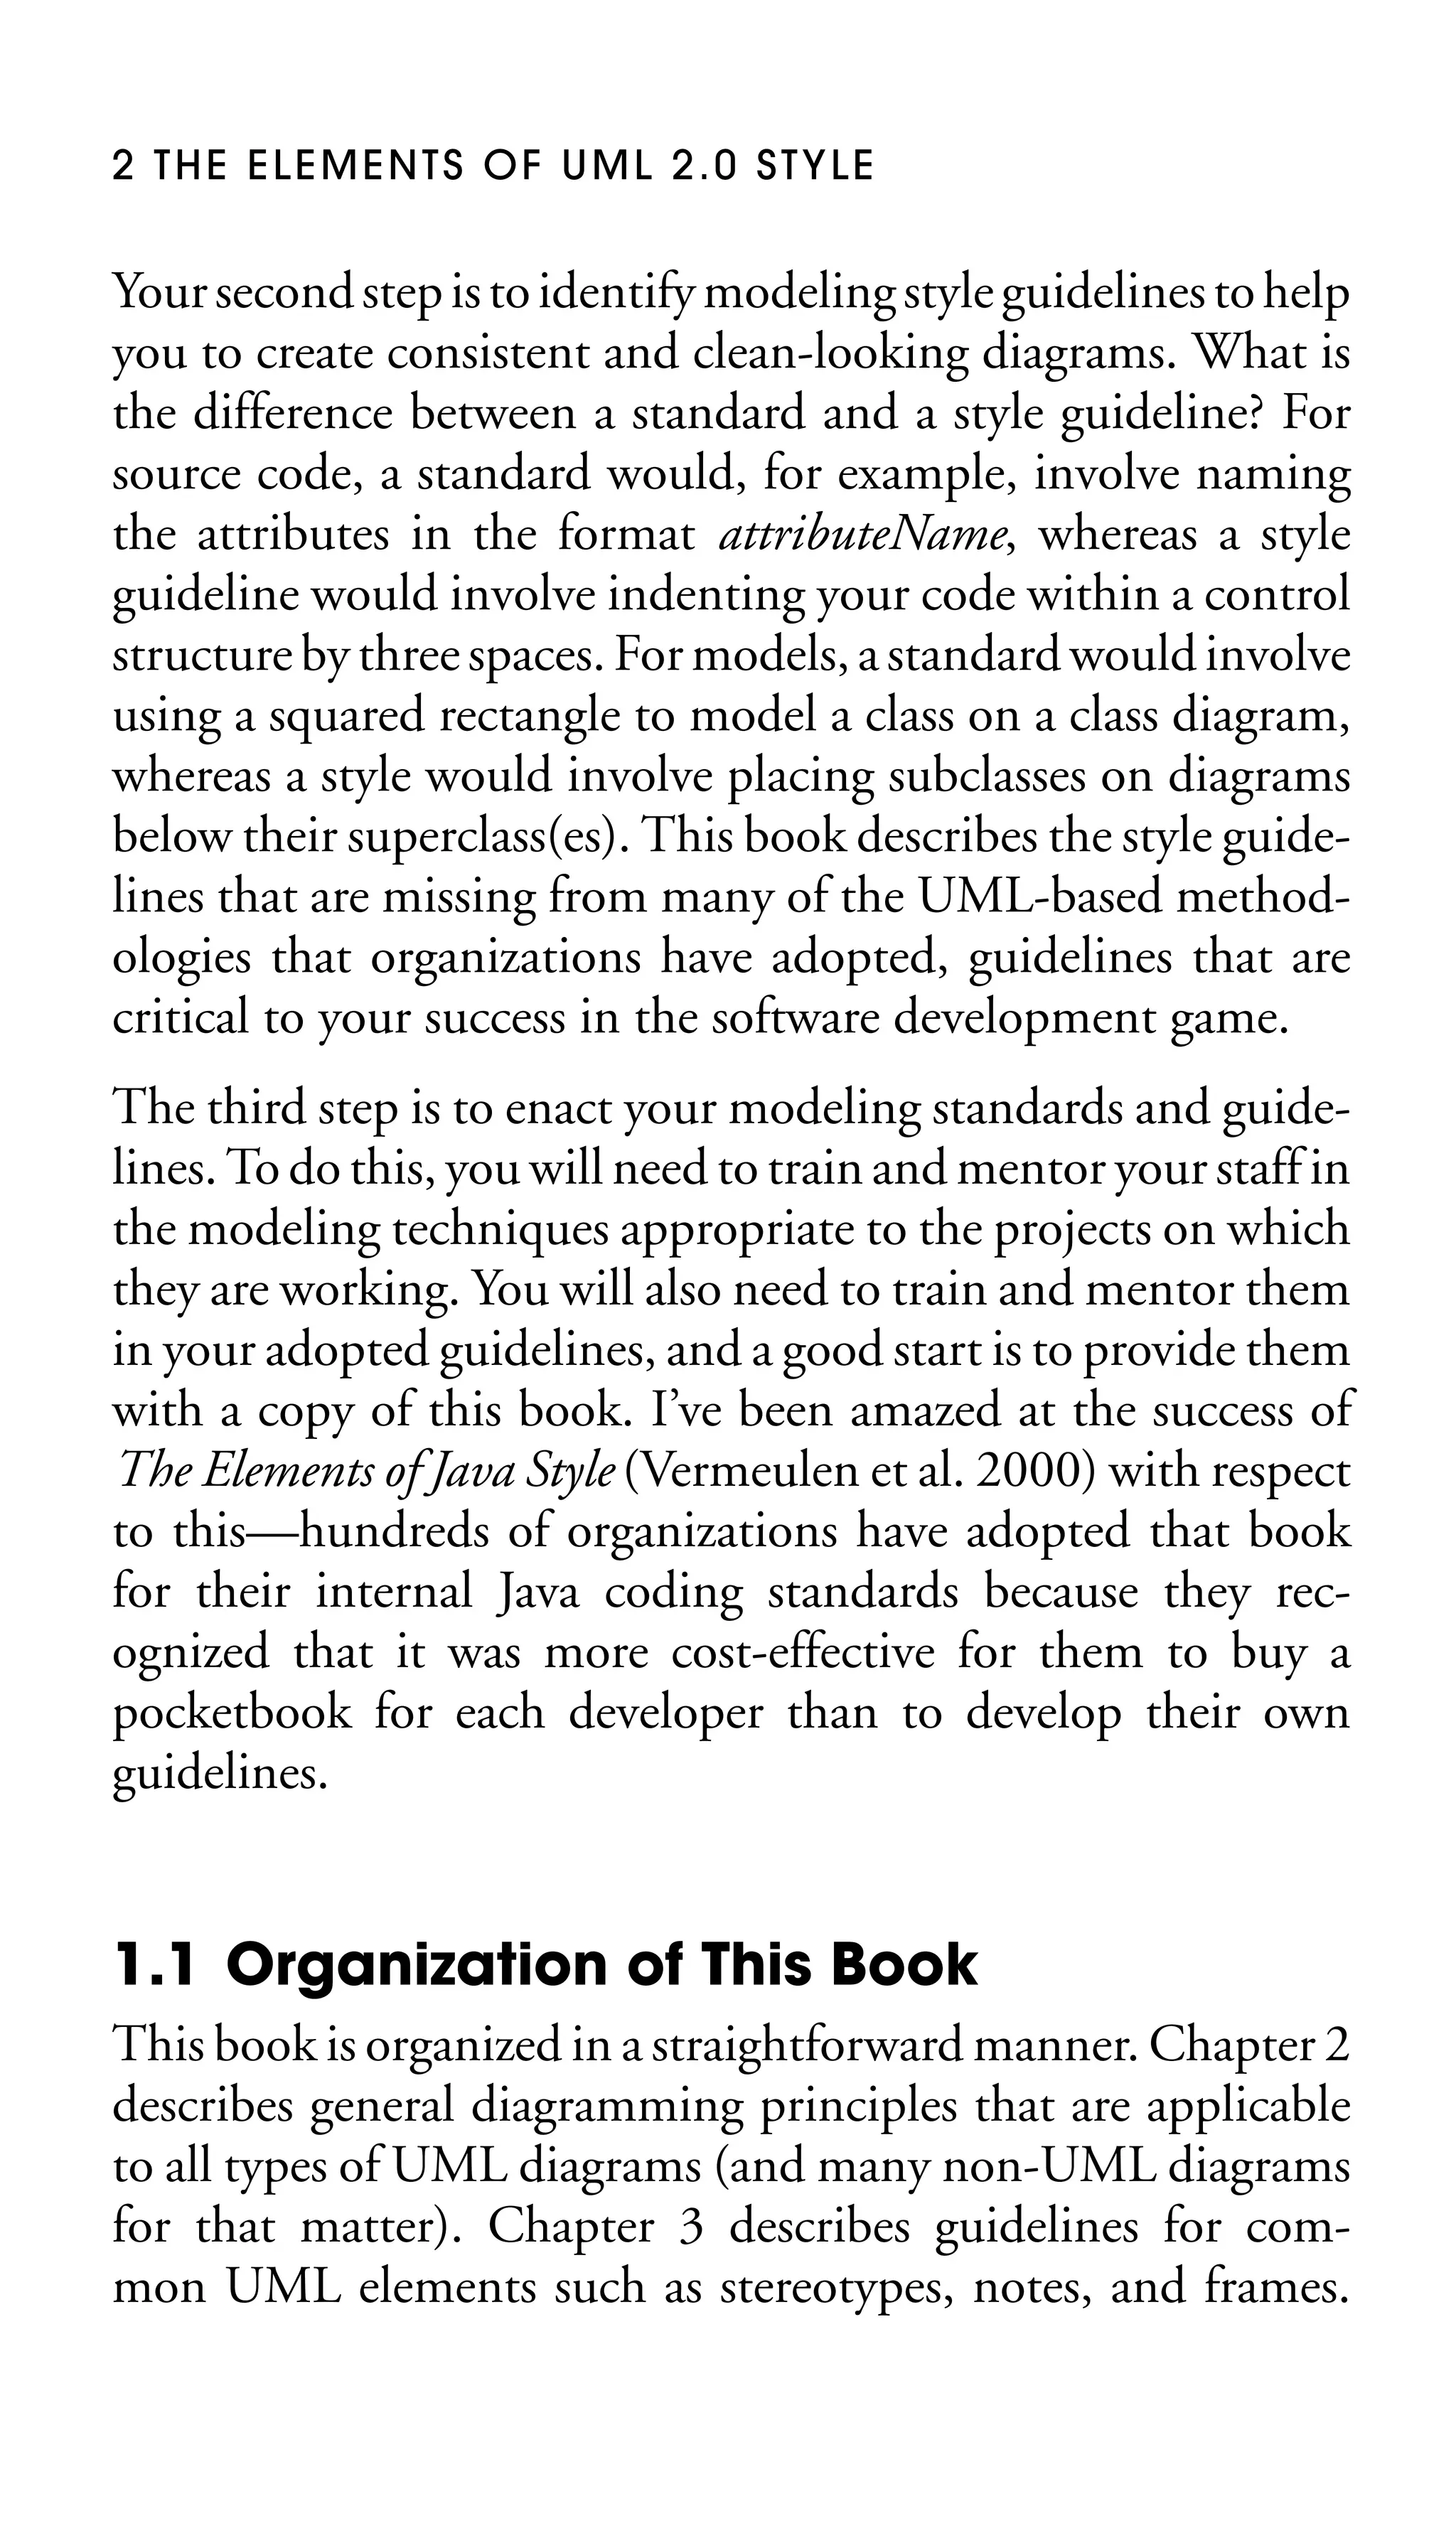
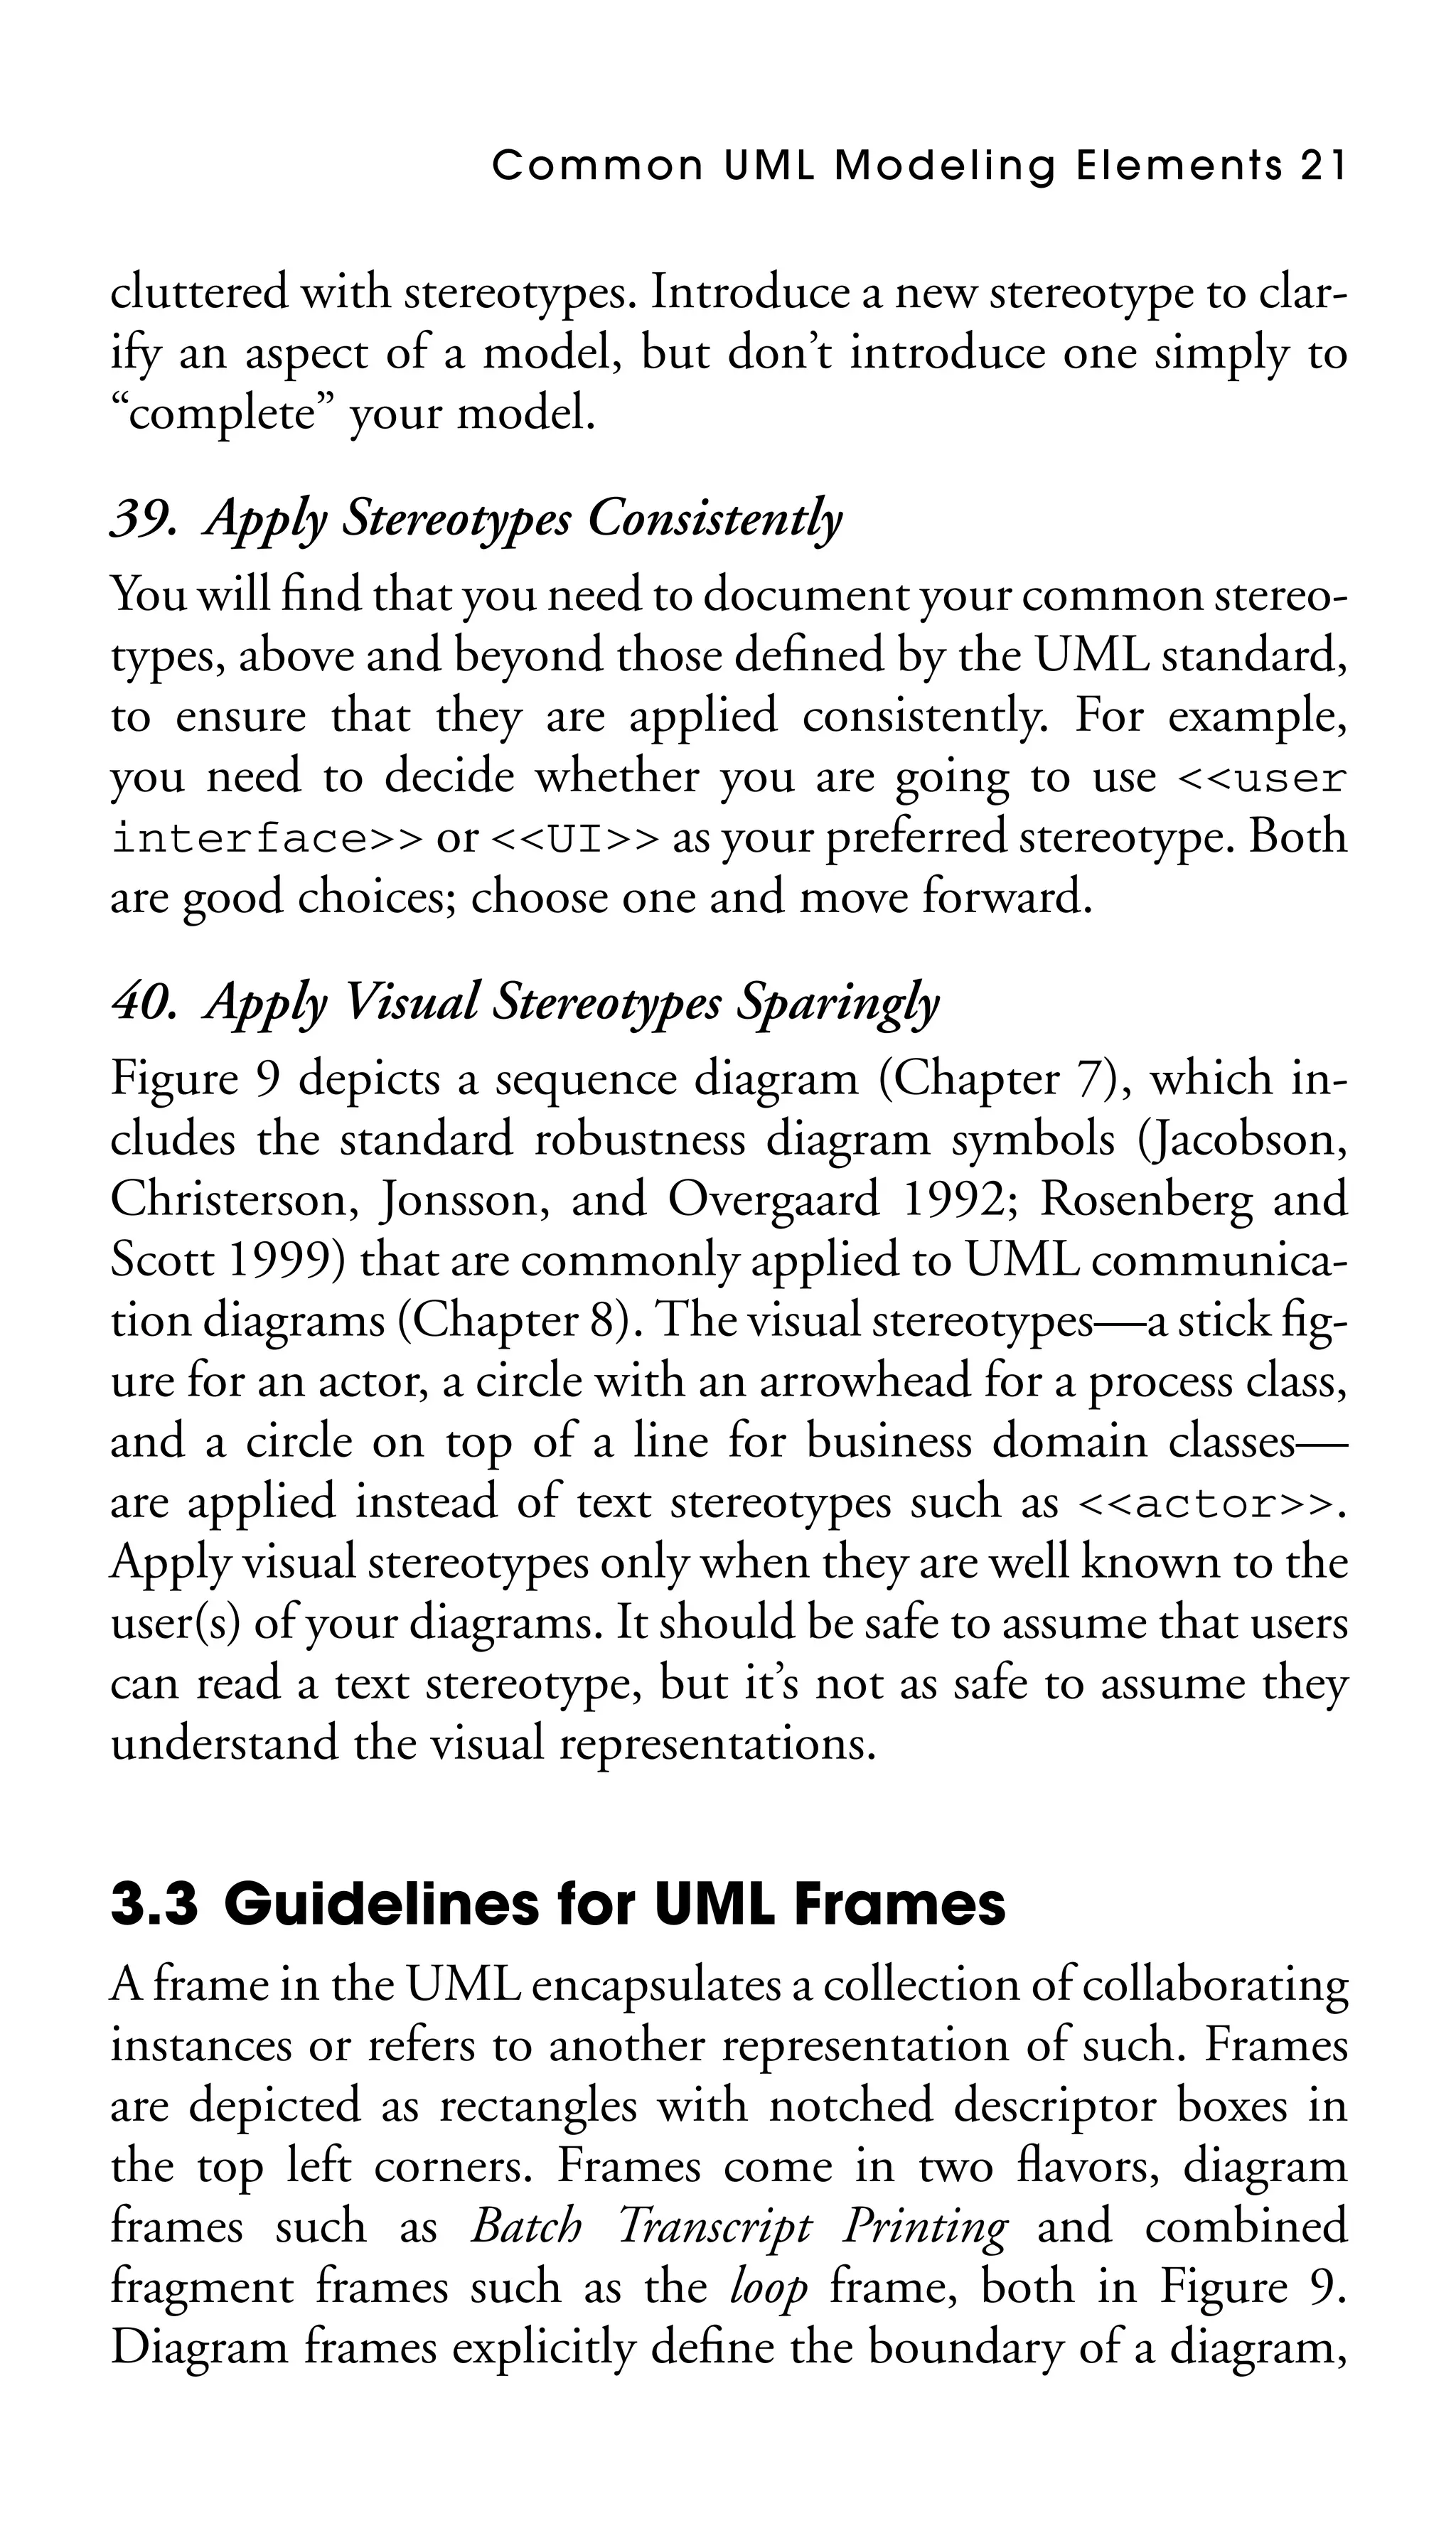
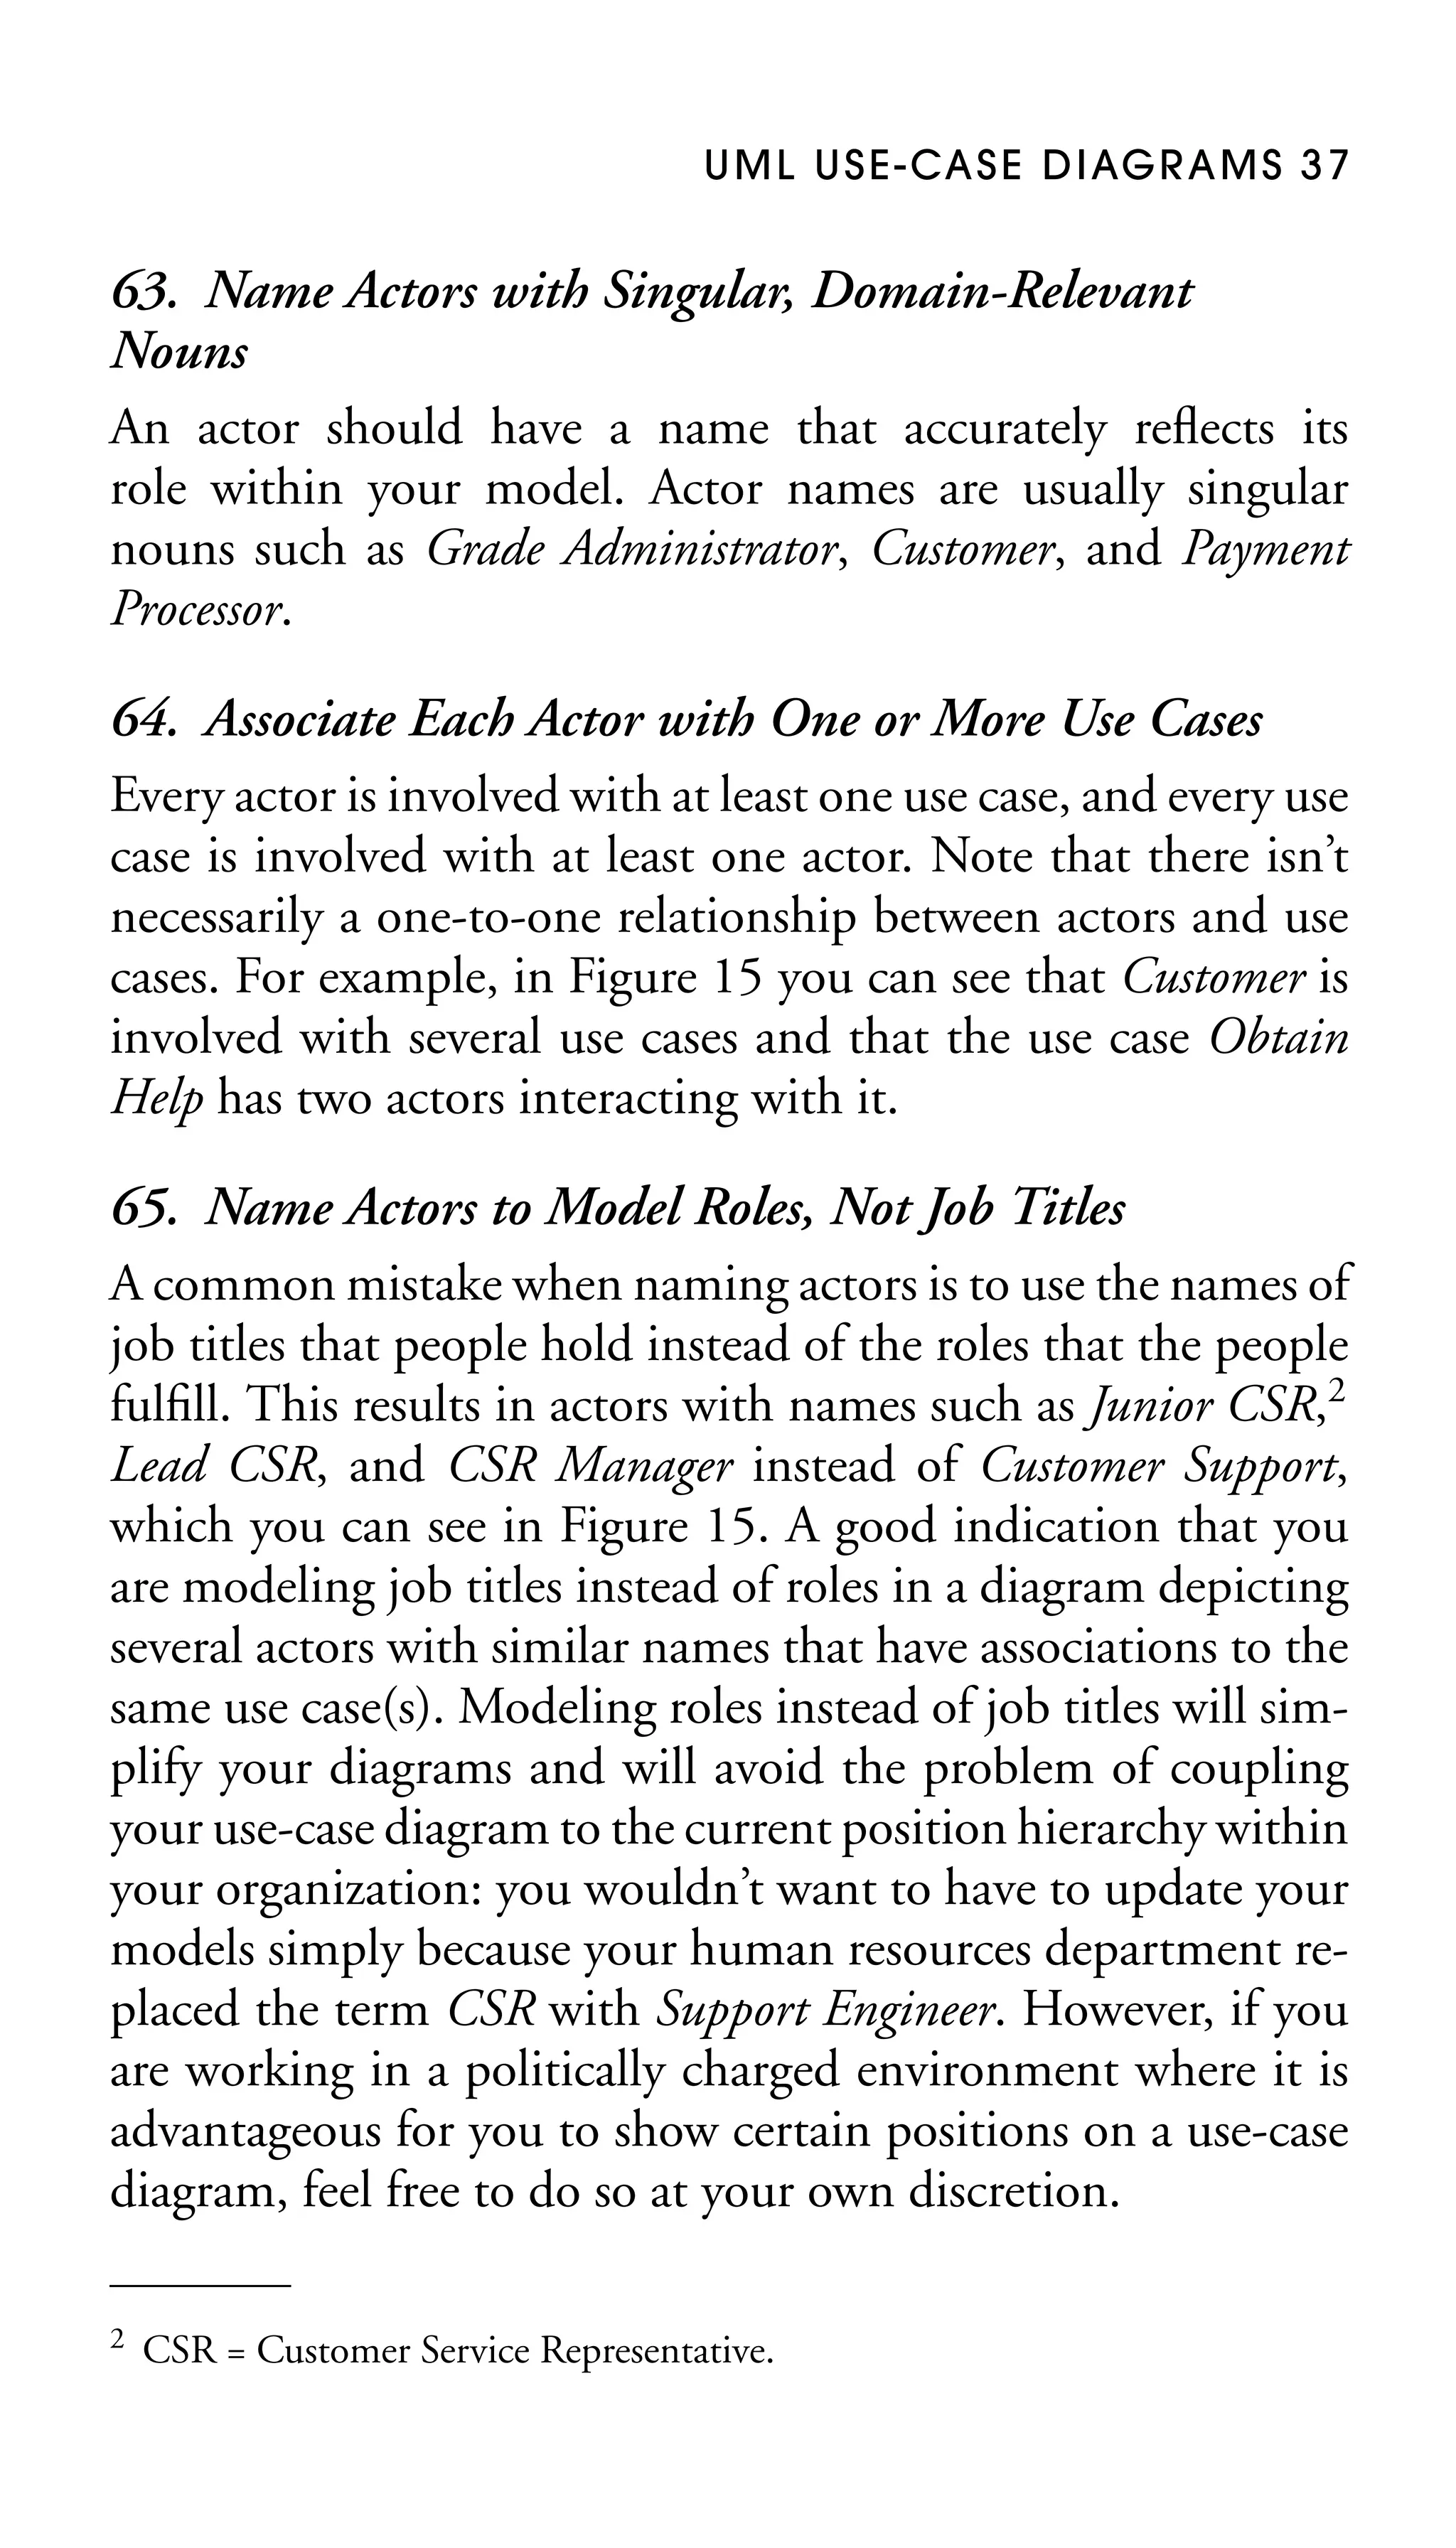
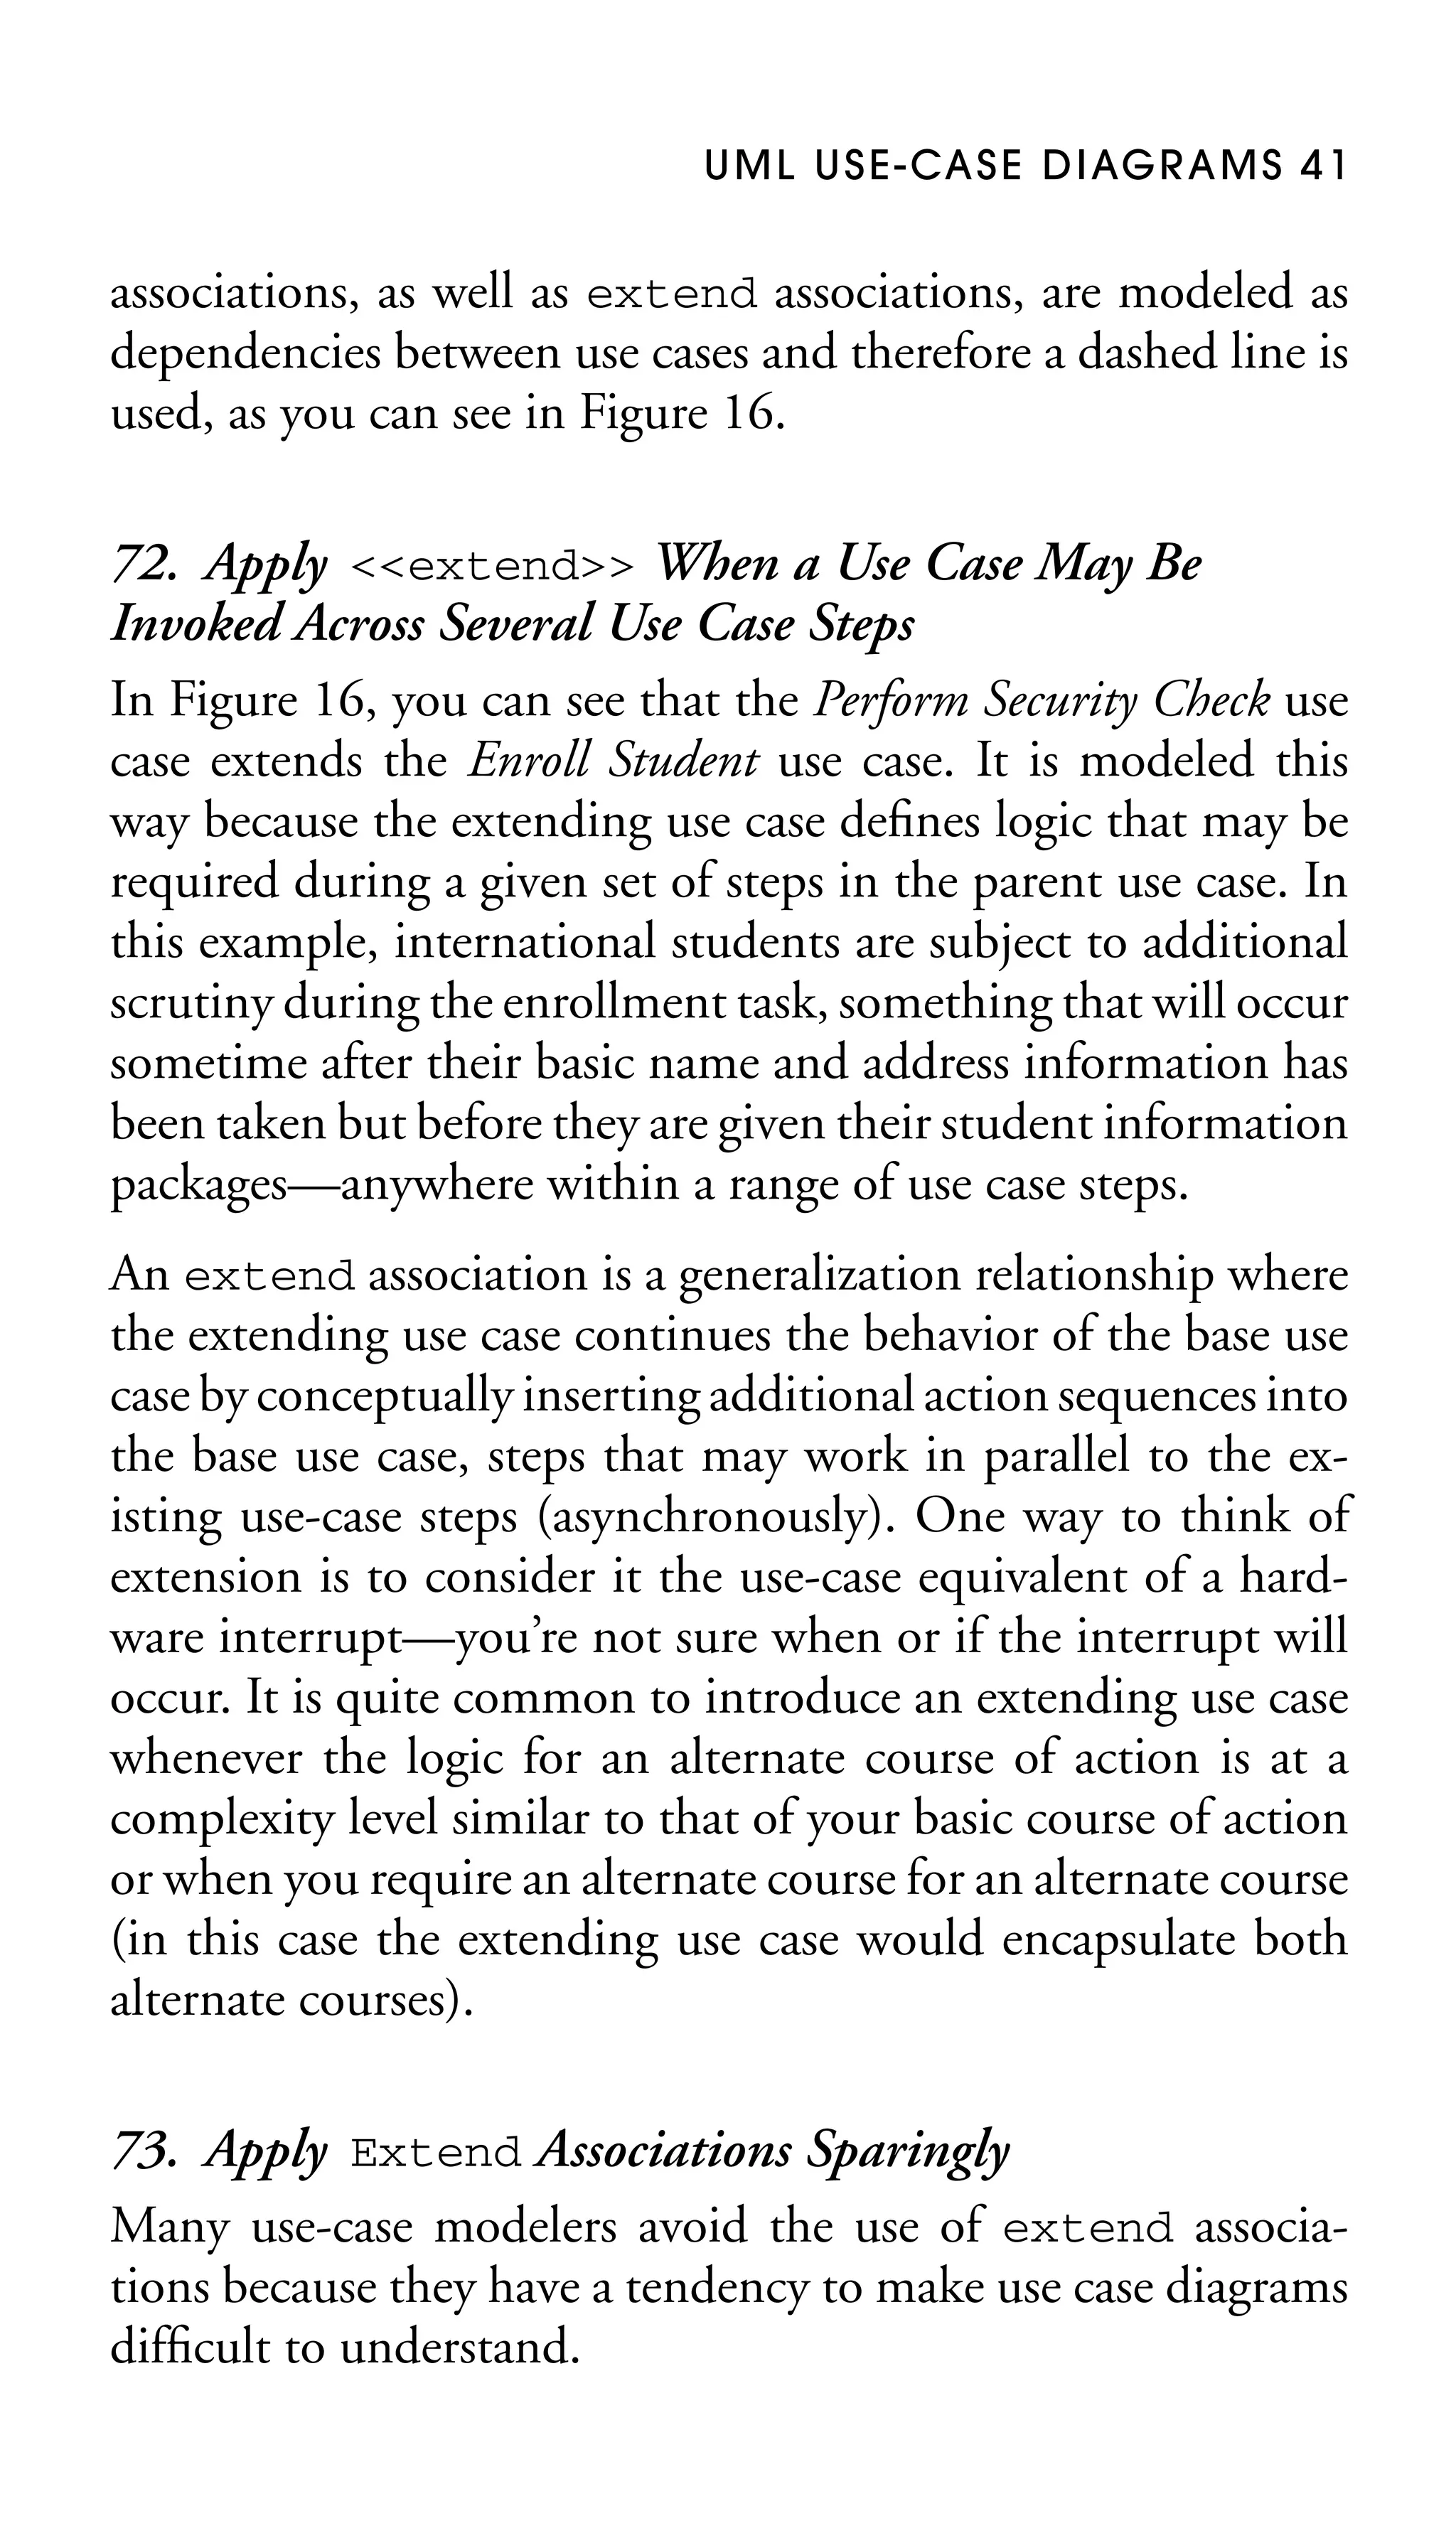
77. Place an Included Use Case to the Right of the
Invoking Use Case
It is common convention to draw include associations horizontally, with the included use case to the right of the invoking
use case, as you can see in Figure 16 with Enroll Student and
Enroll in Seminar.
78. Place an Extending Use Case Below the Parent
Use Case
It is common convention to draw extend associations vertically, with the extending use case placed lower on your diagram than the base use case, as you can see in Figure 16
with Perform Security Check and Enroll Student.
79. Apply the “Is Like” Rule to Use-Case Generalization
The sentence “the [inheriting use-case name] is like the [parent
use-case name]” should make sense. In Figure 16, it makes
sense to say that enrolling a family member is like enrolling
a student; therefore, it’s a good indication that generalization
makes sense. It doesn’t make sense to say that enrolling a
student is like enrolling in a seminar. The logic for each activity
is different—although the two use cases may be related it isn’t
by generalization.
80. Place an Inheriting Use Case Below the Base
Use Case
It is a common convention to draw generalization relationships vertically, with the inheriting use case placed lower on
your diagram than the parent use case, as you can see in
Figure 16 with Enroll Family Member and Enroll Student.](https://image.slidesharecdn.com/2005-050521616786theelementsofuml2style-131128083647-phpapp02/75/the-elements-of-uml-2-style-56-2048.jpg)
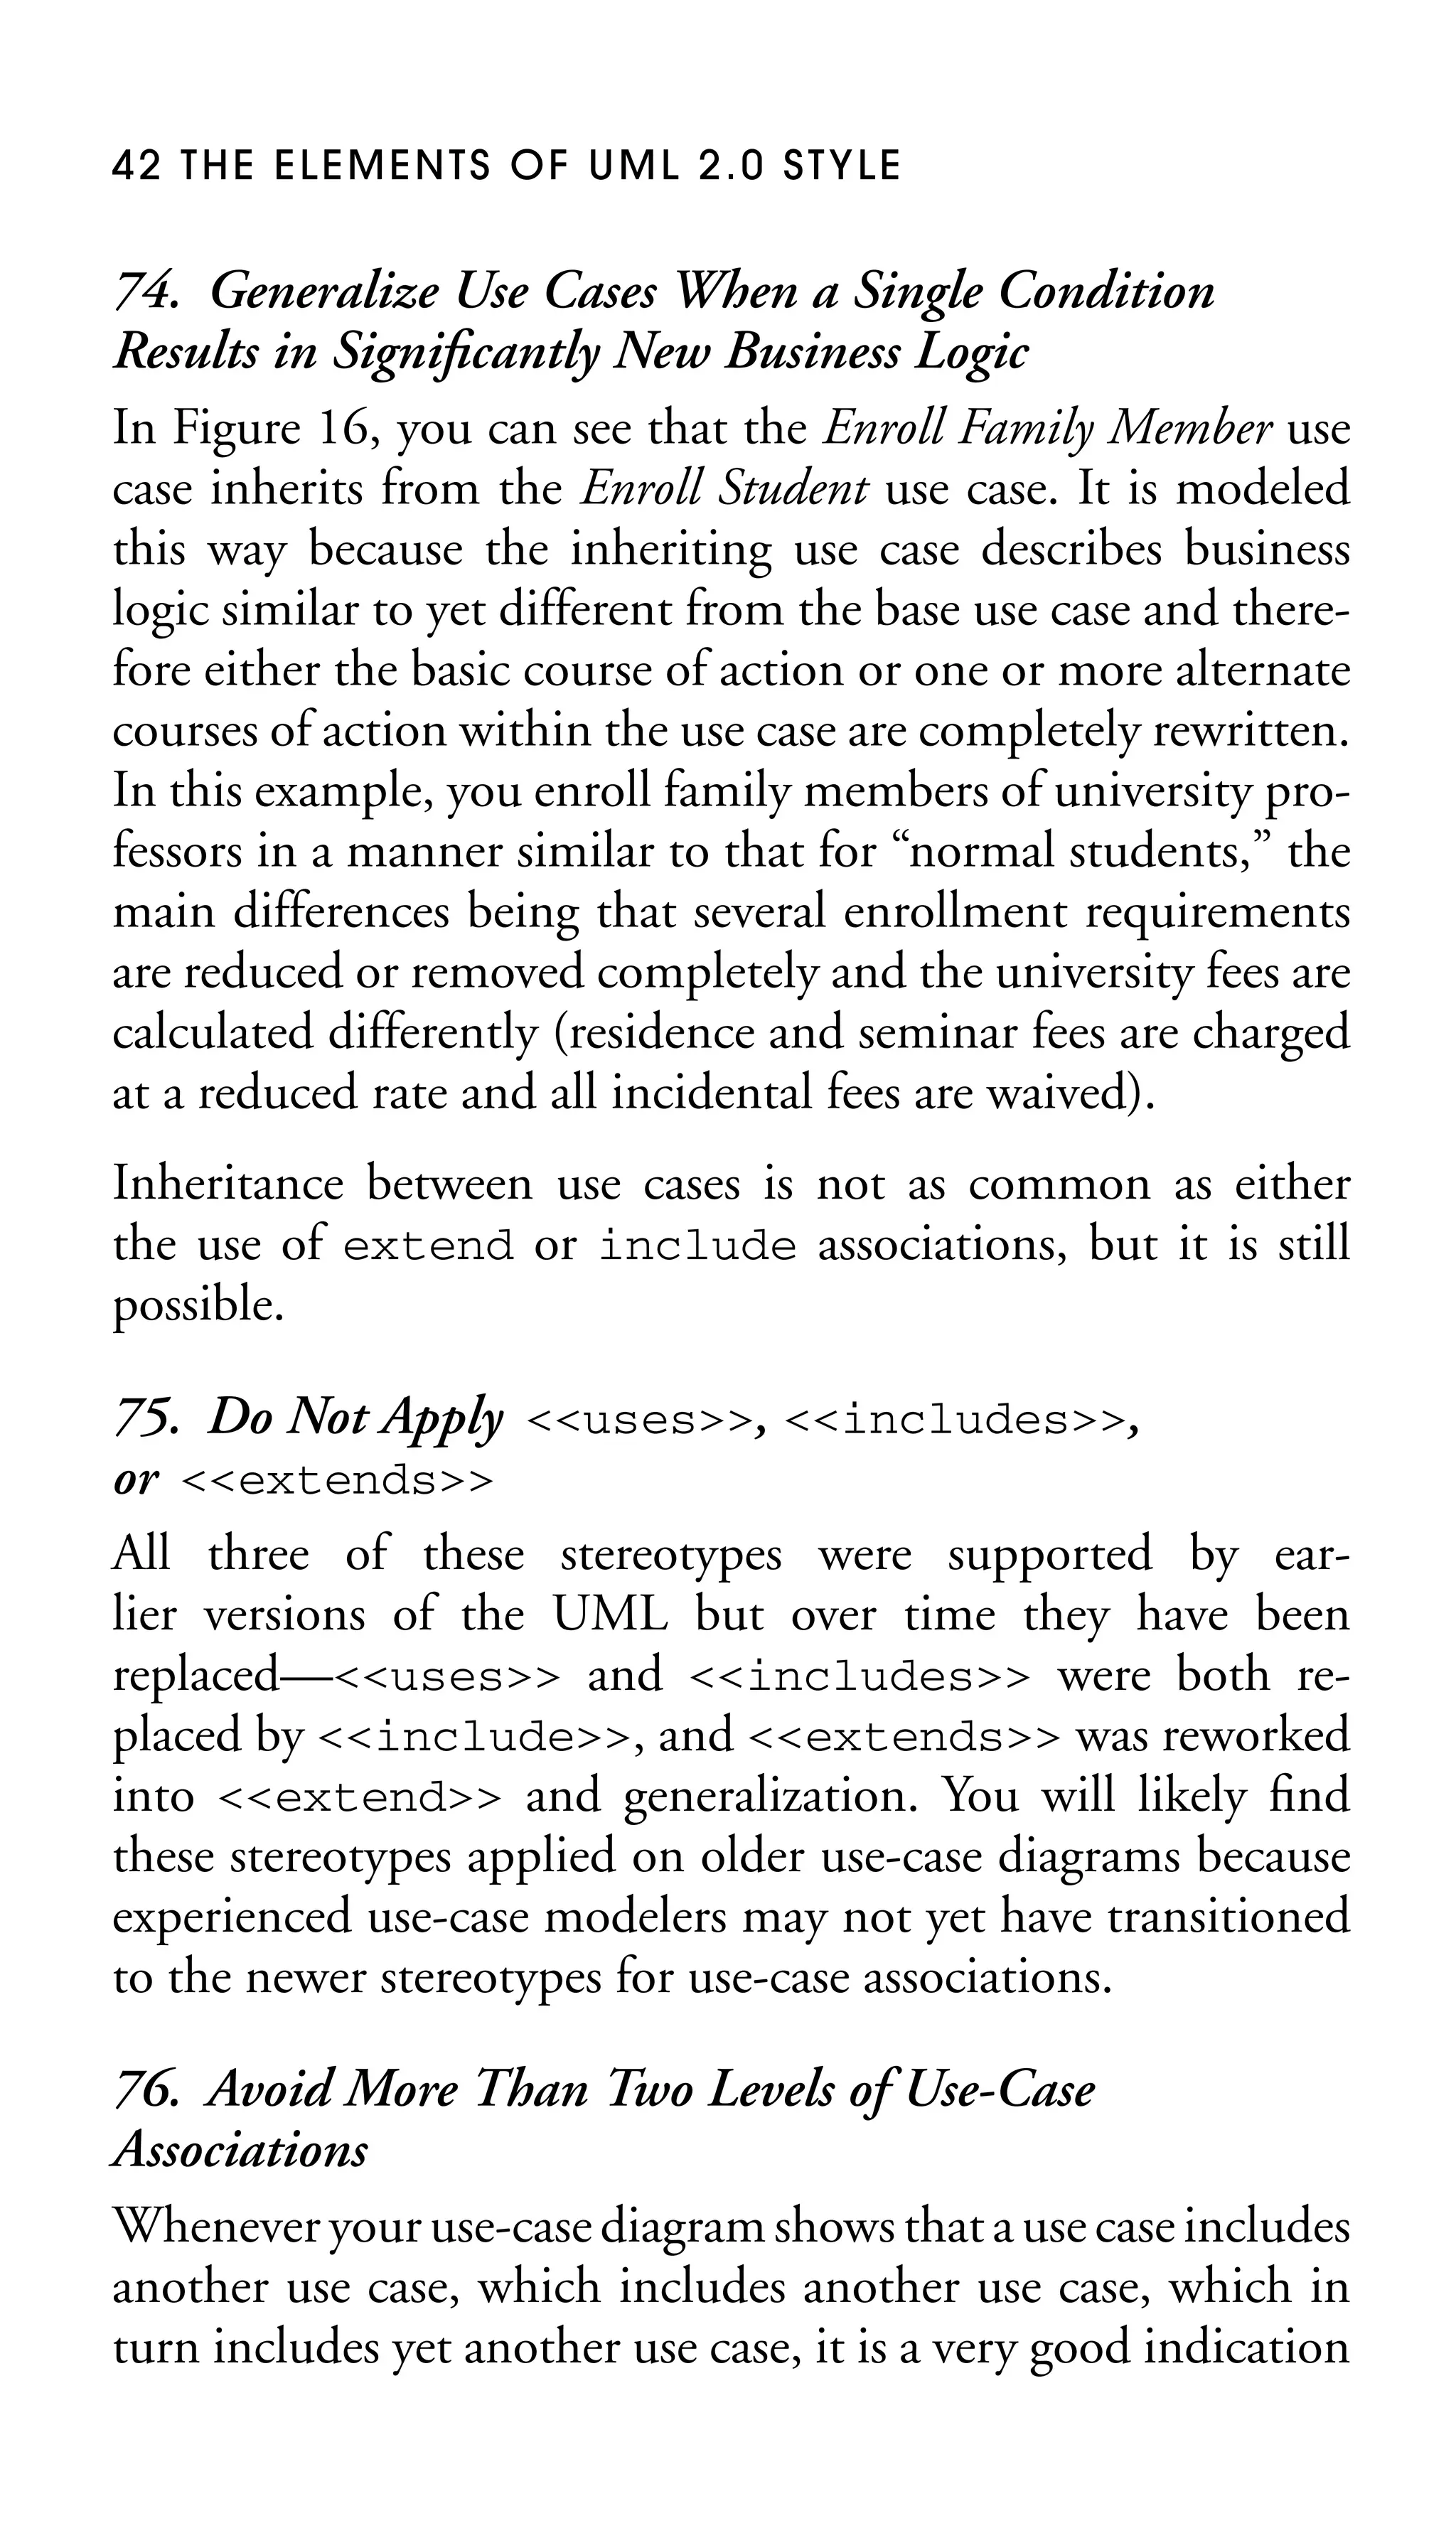
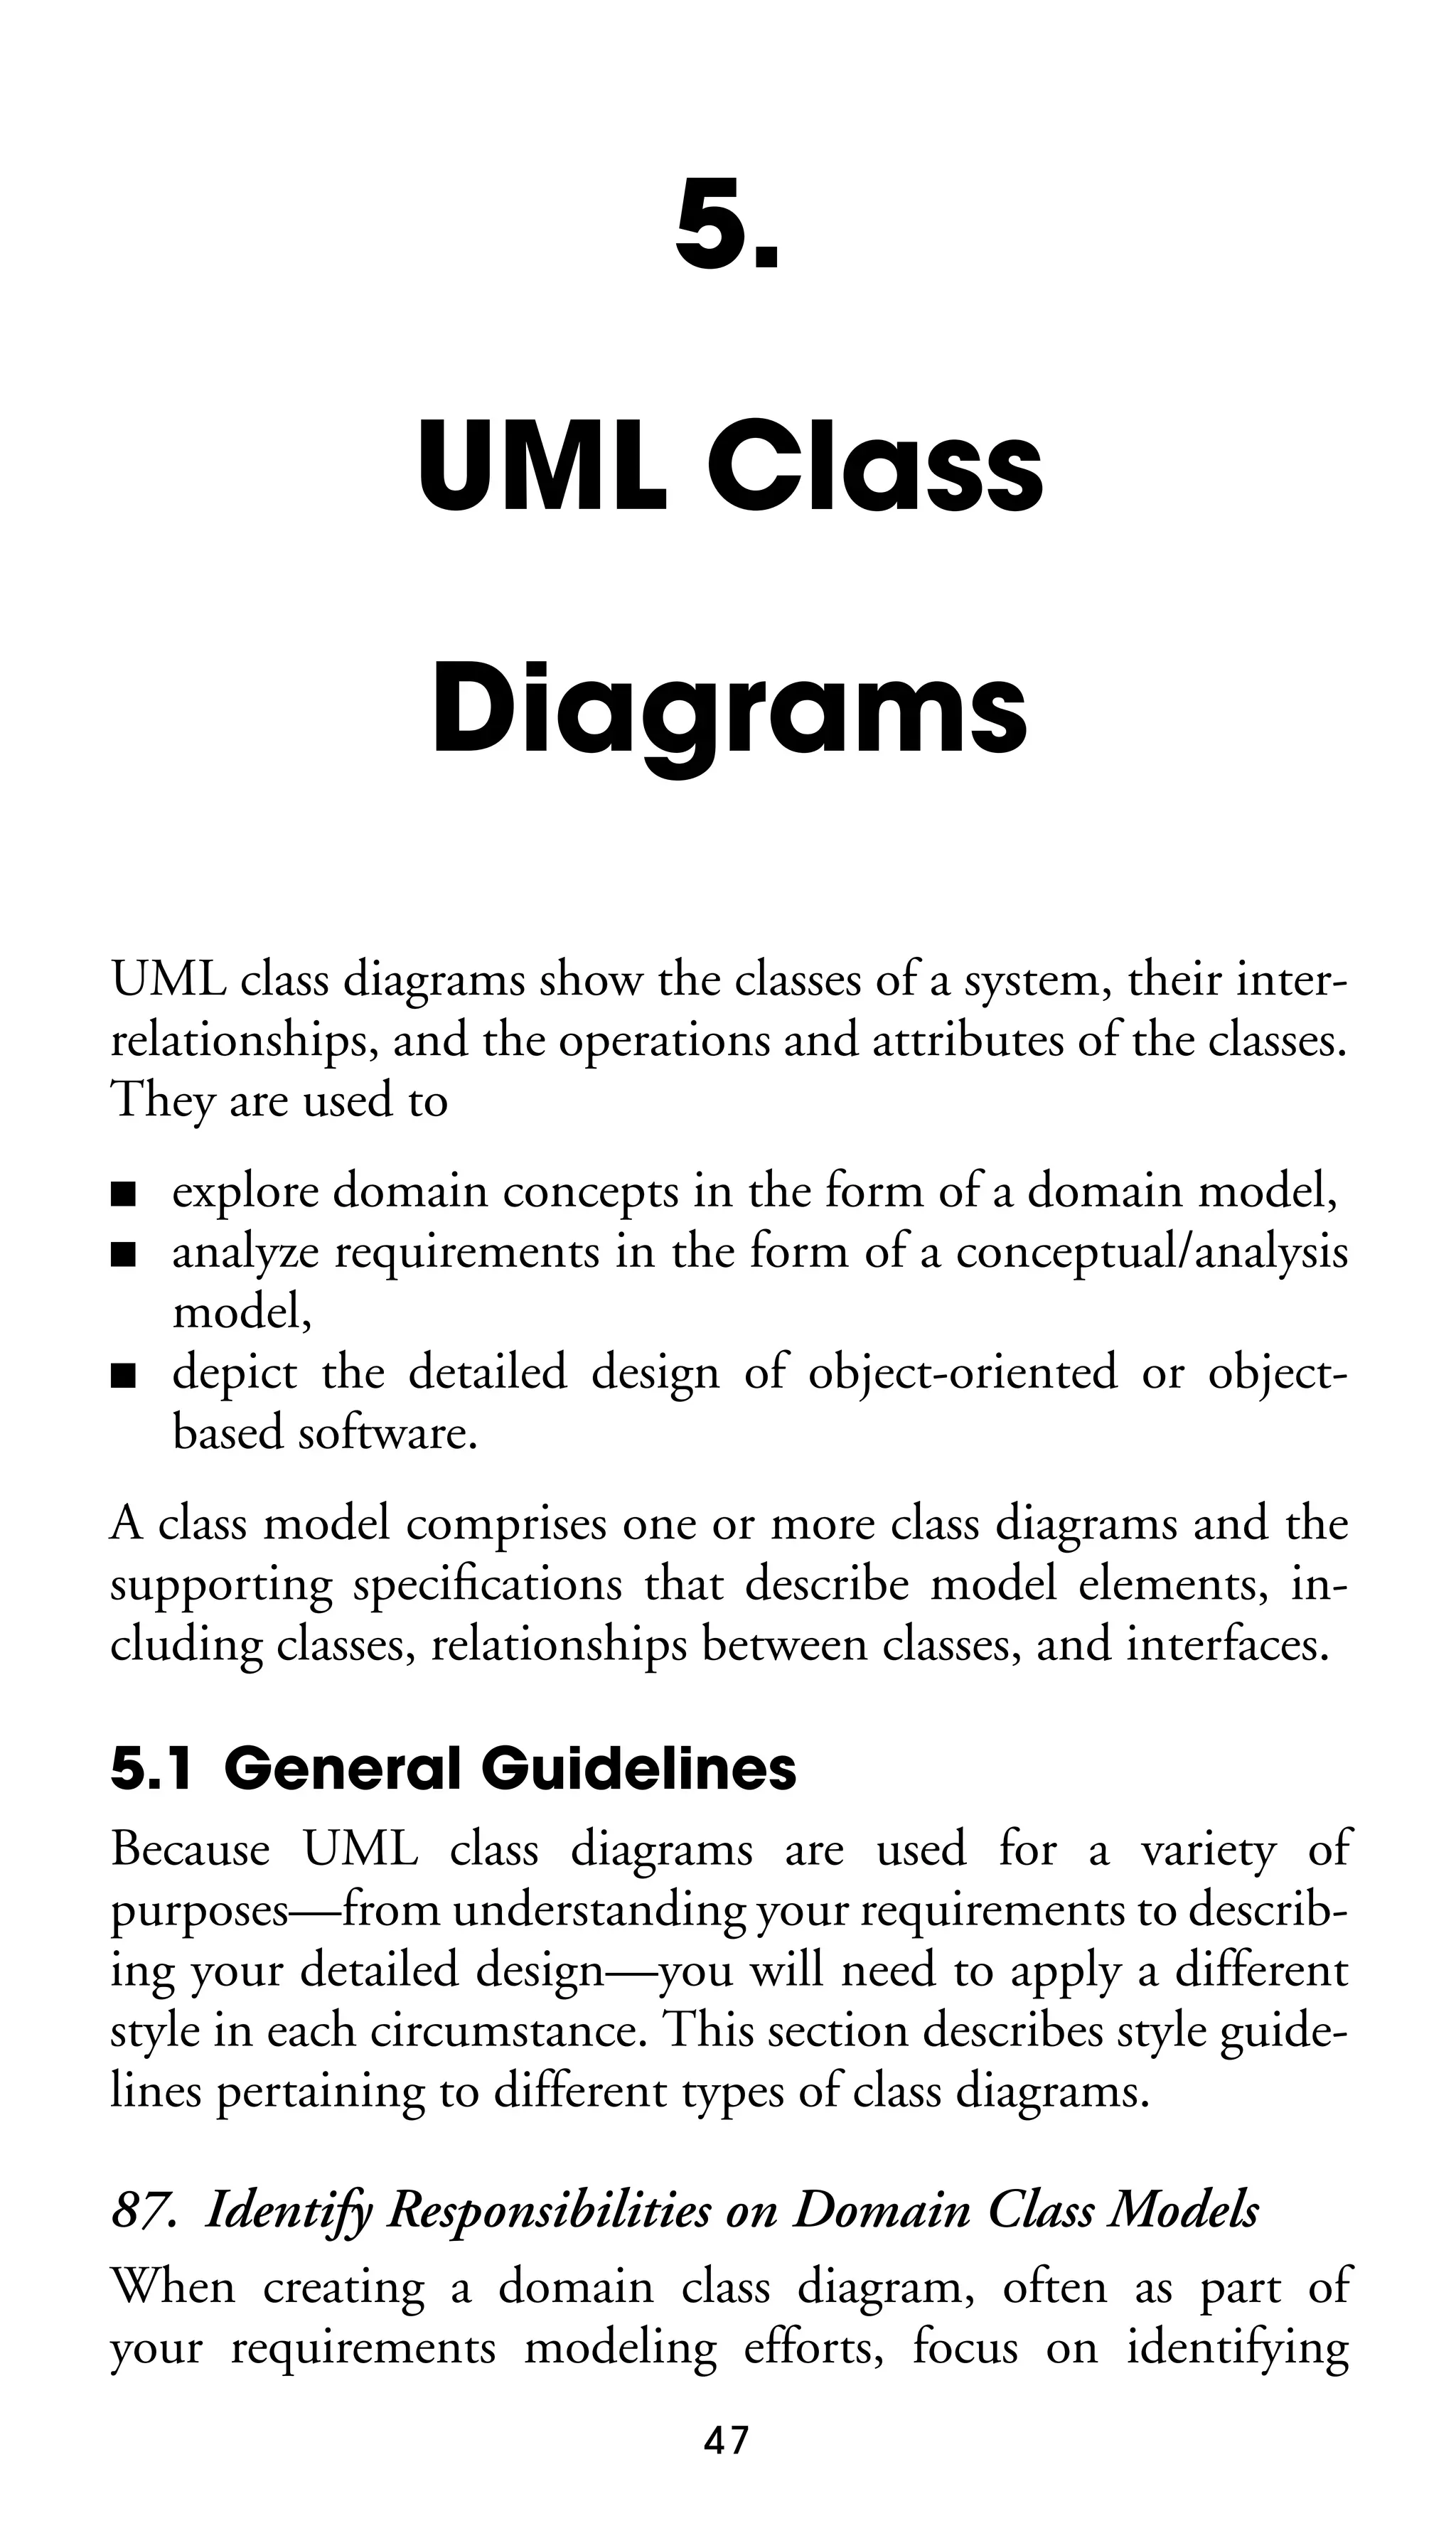
![44 THE ELEMENTS OF UML 2.0 STYLE
Enroll in University
Extension points
Verify Citizenship
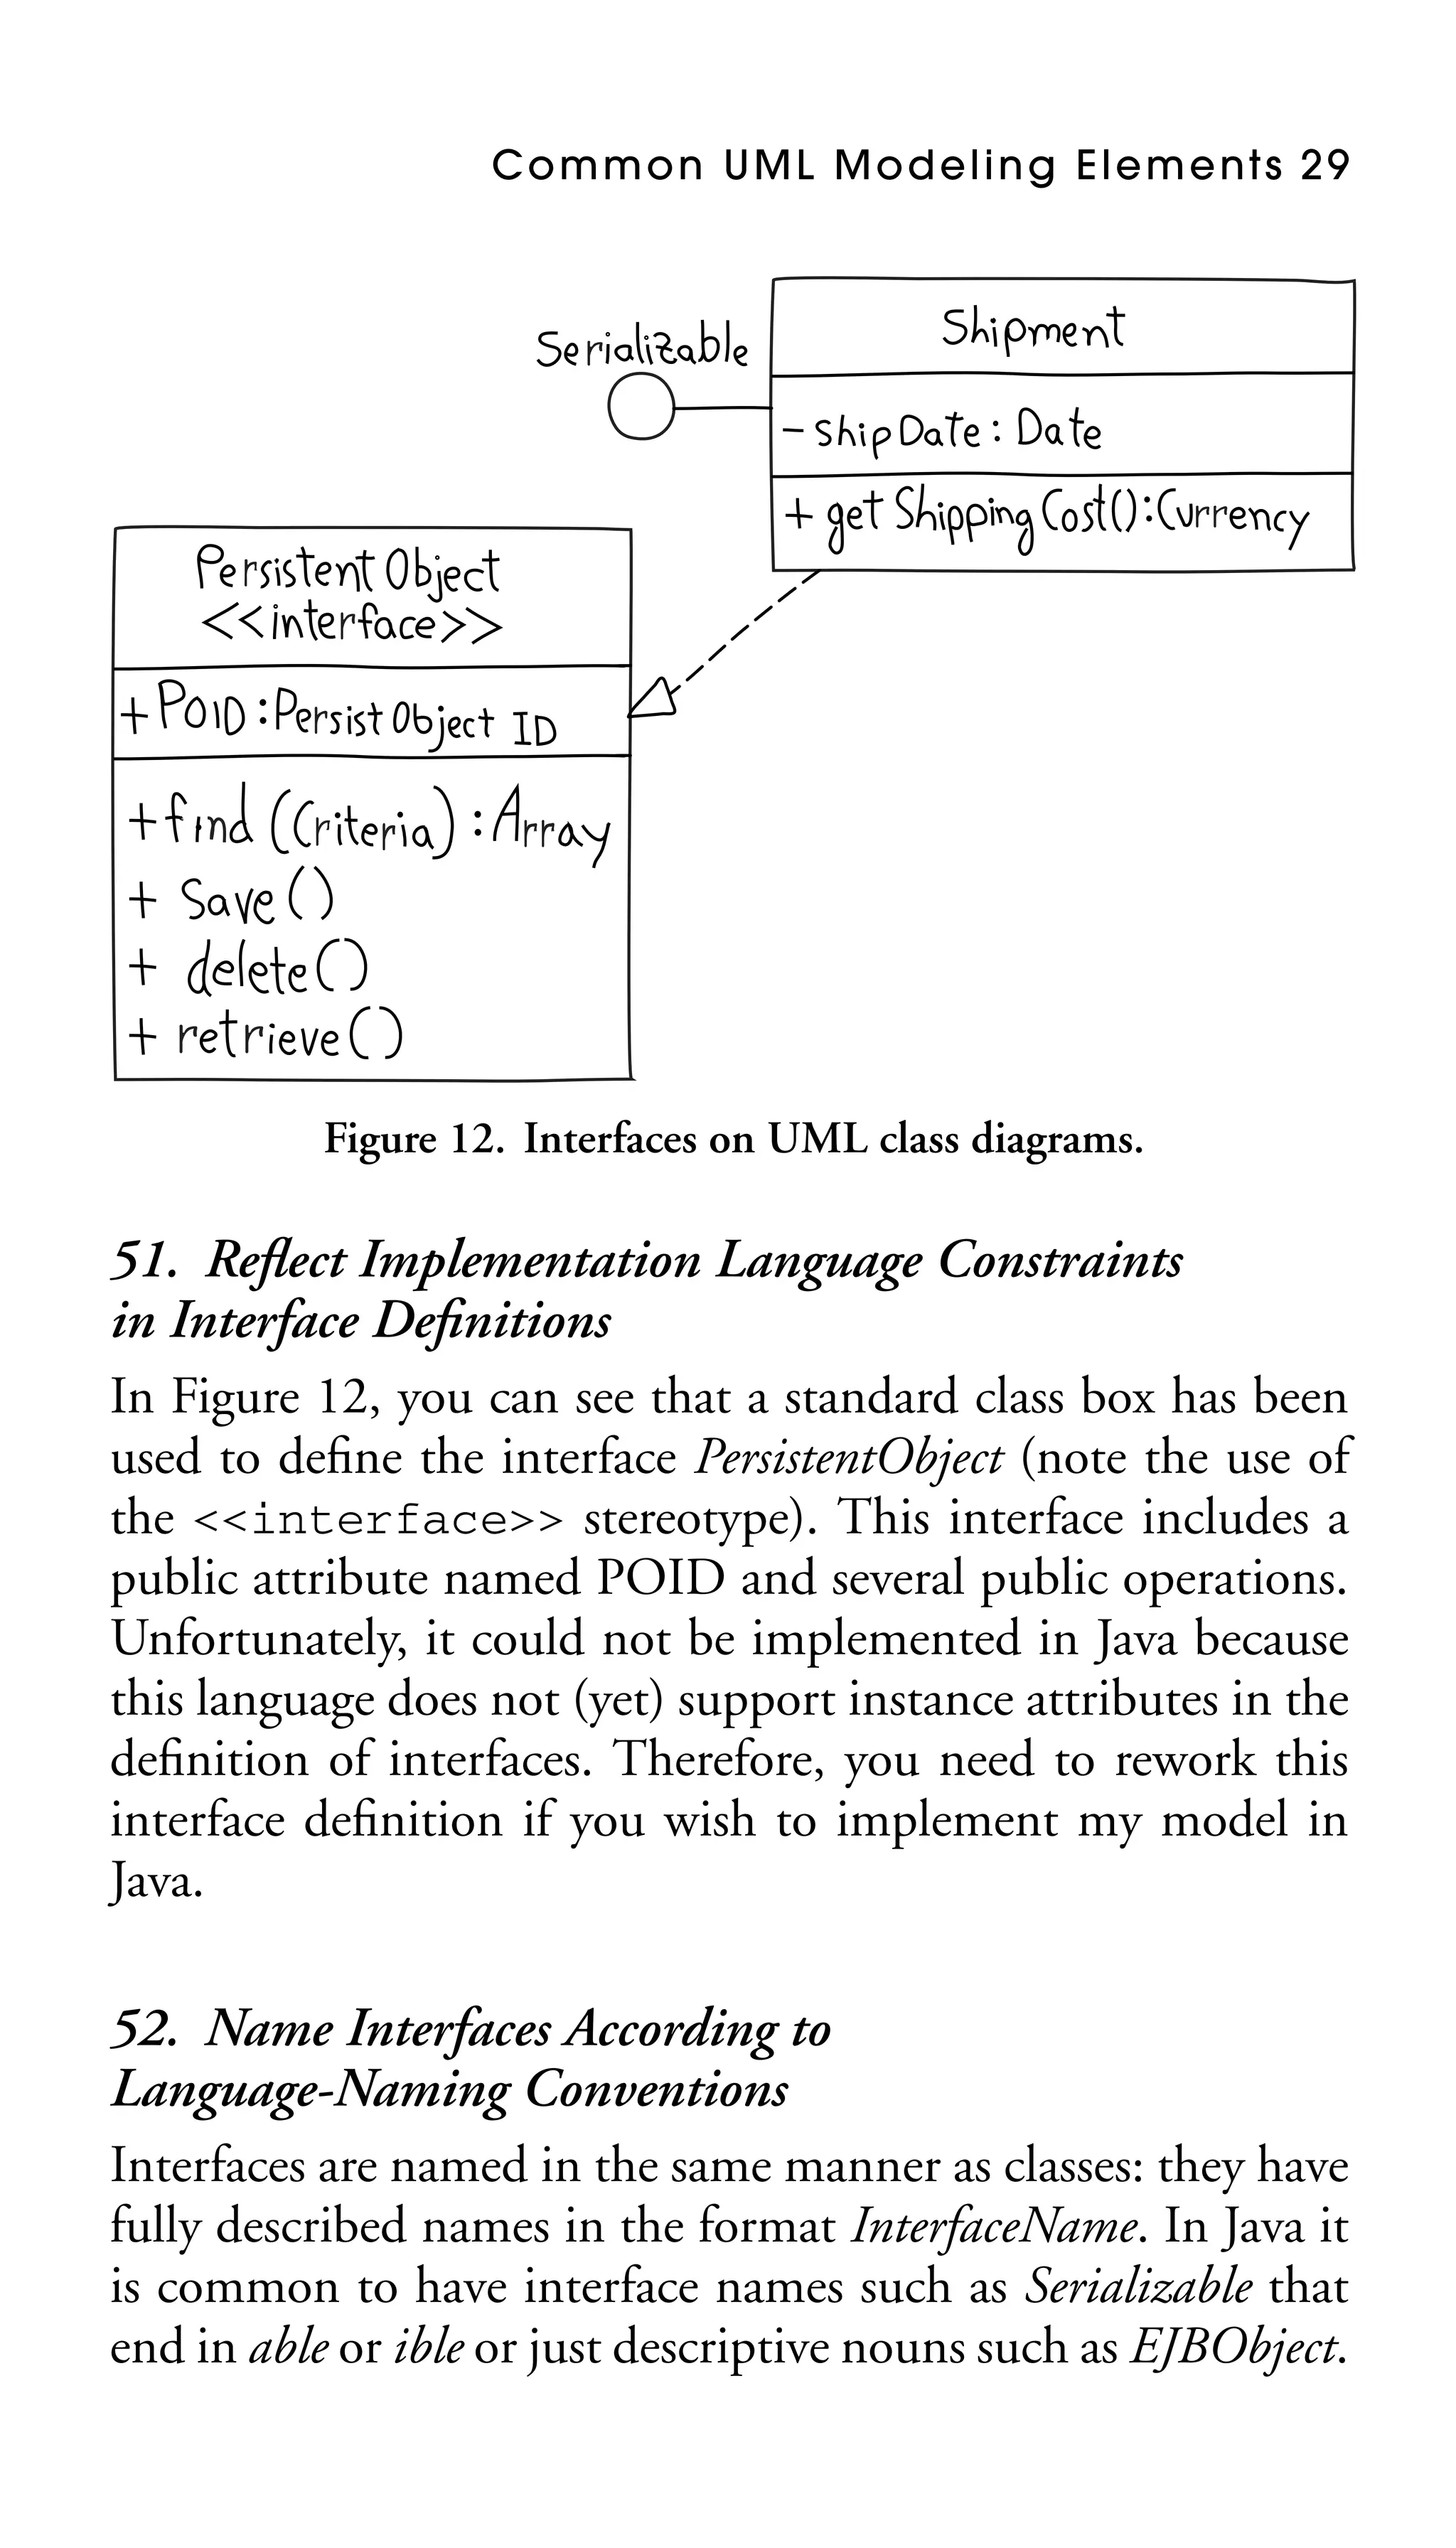
Validate Payment
Condition: {student born outside of country}
Extension point: Verify Citizenship
<<extend>>
Perform Security Check
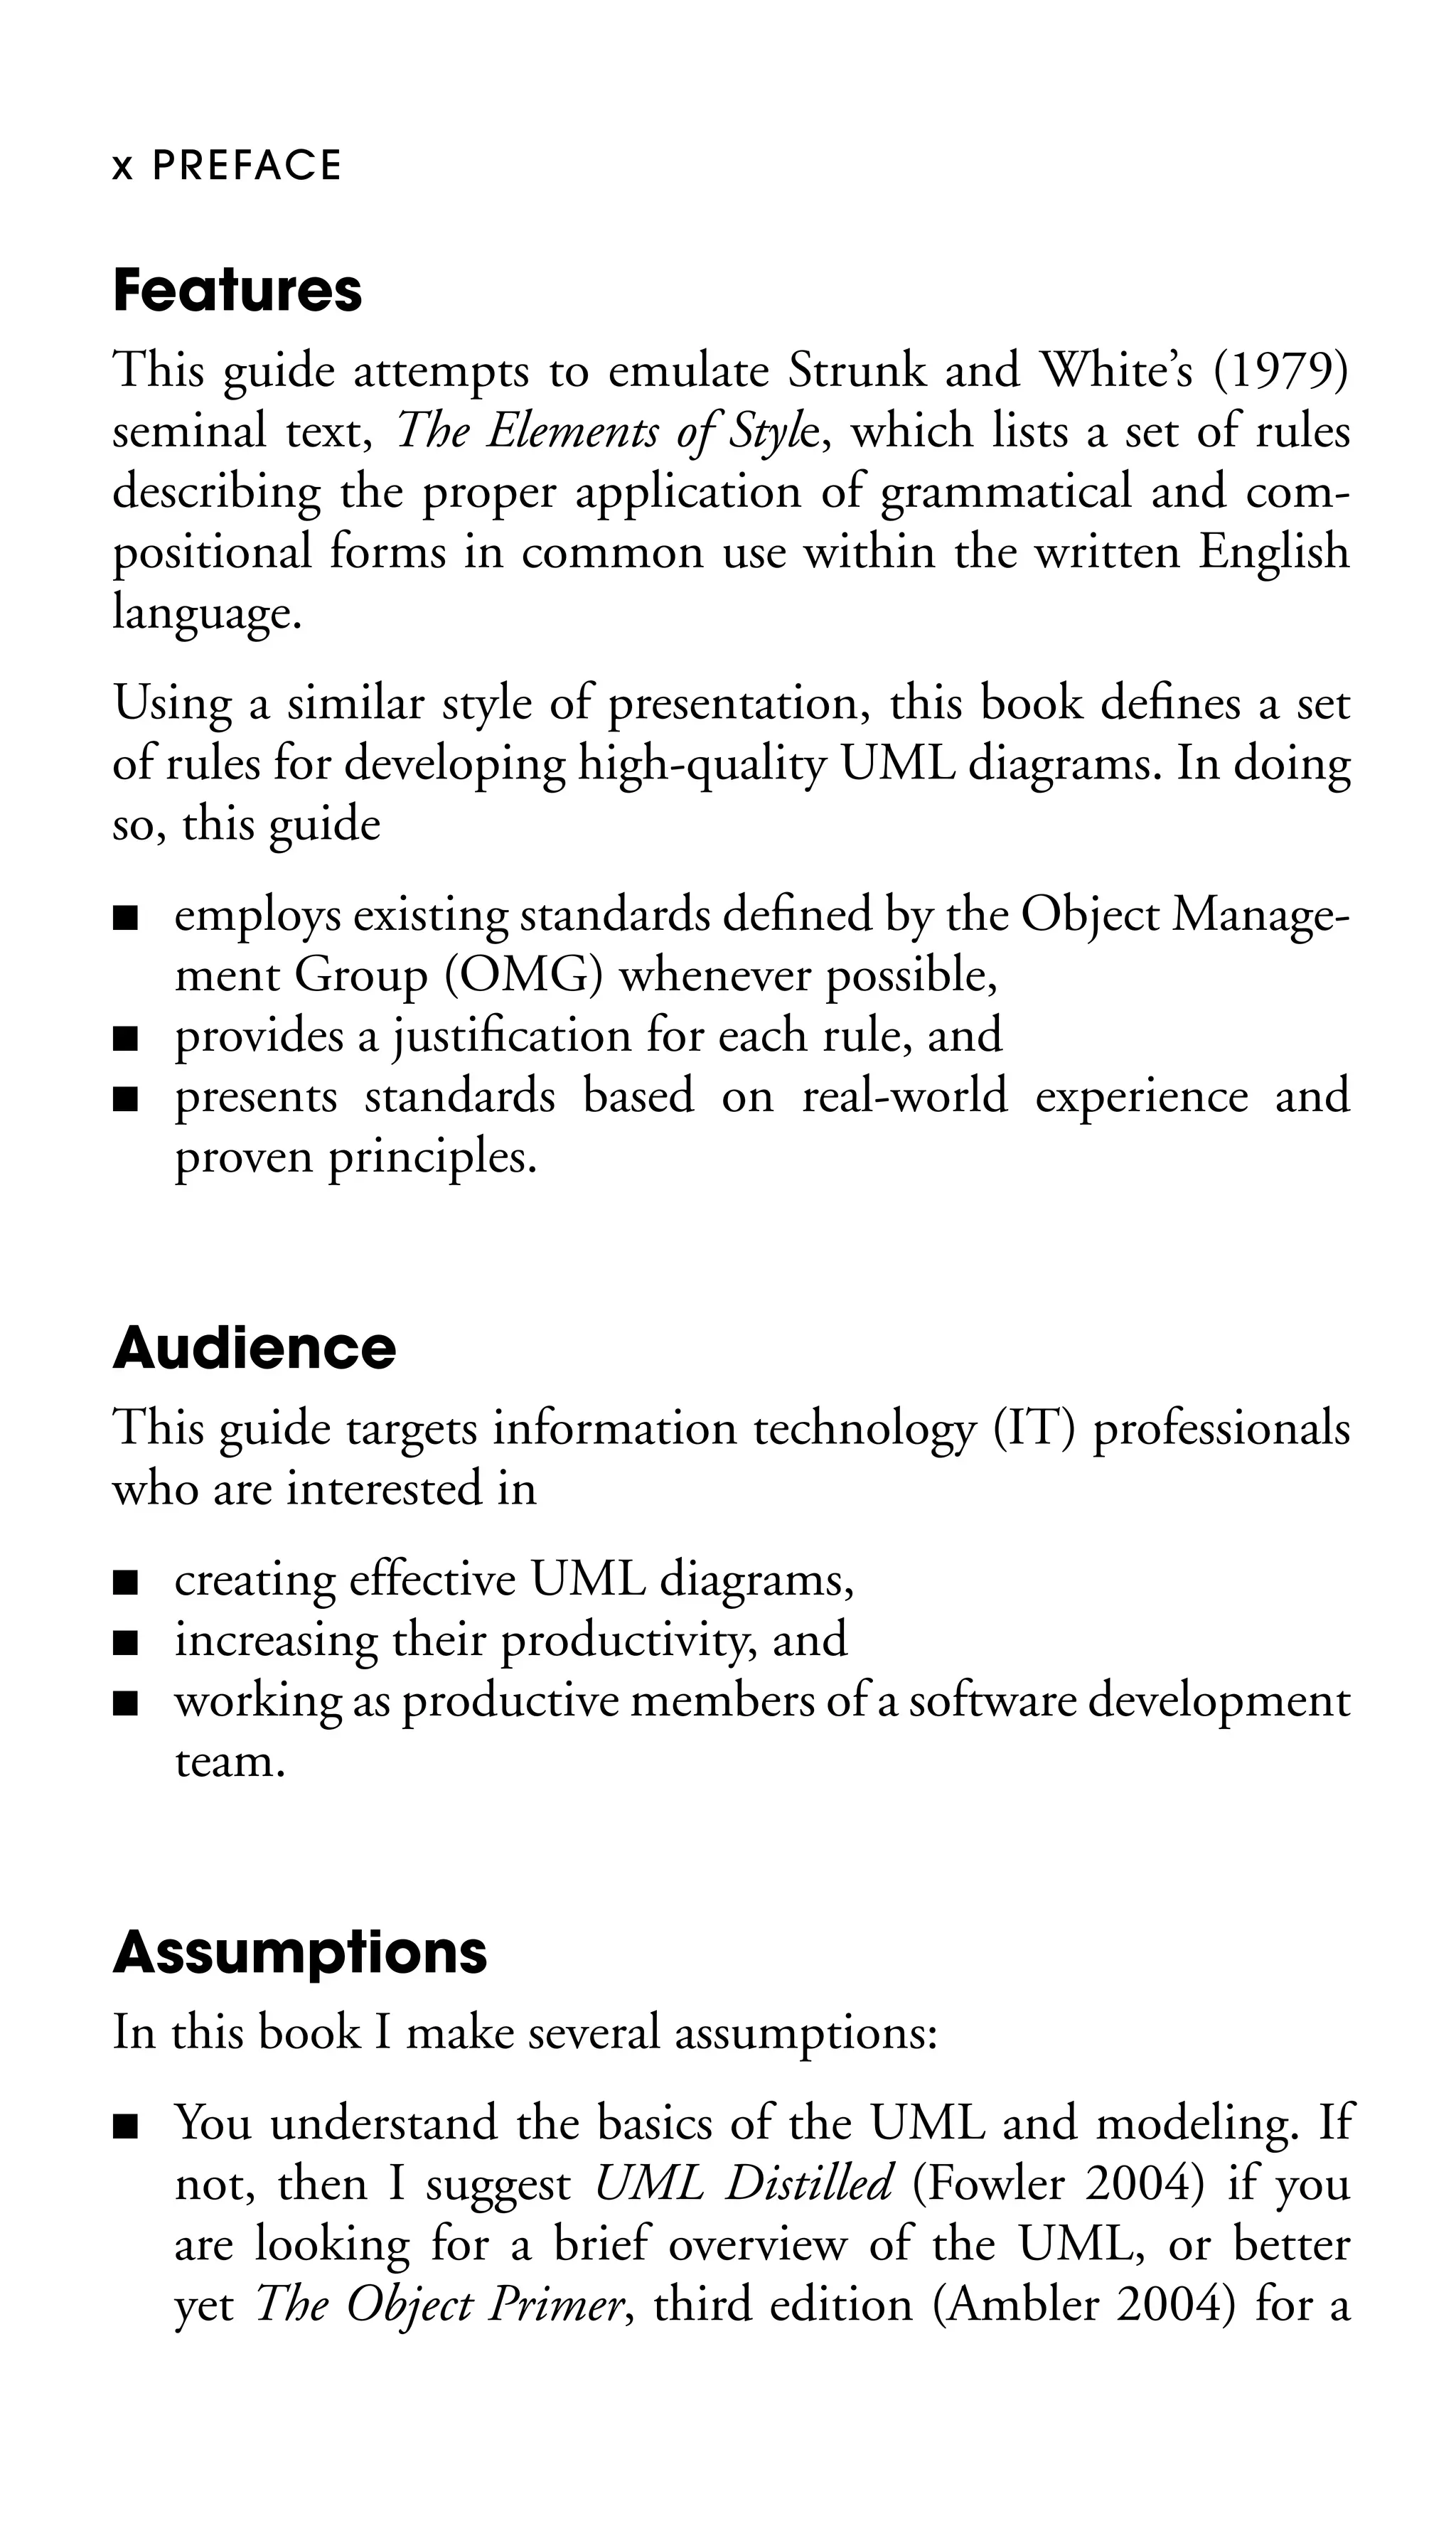
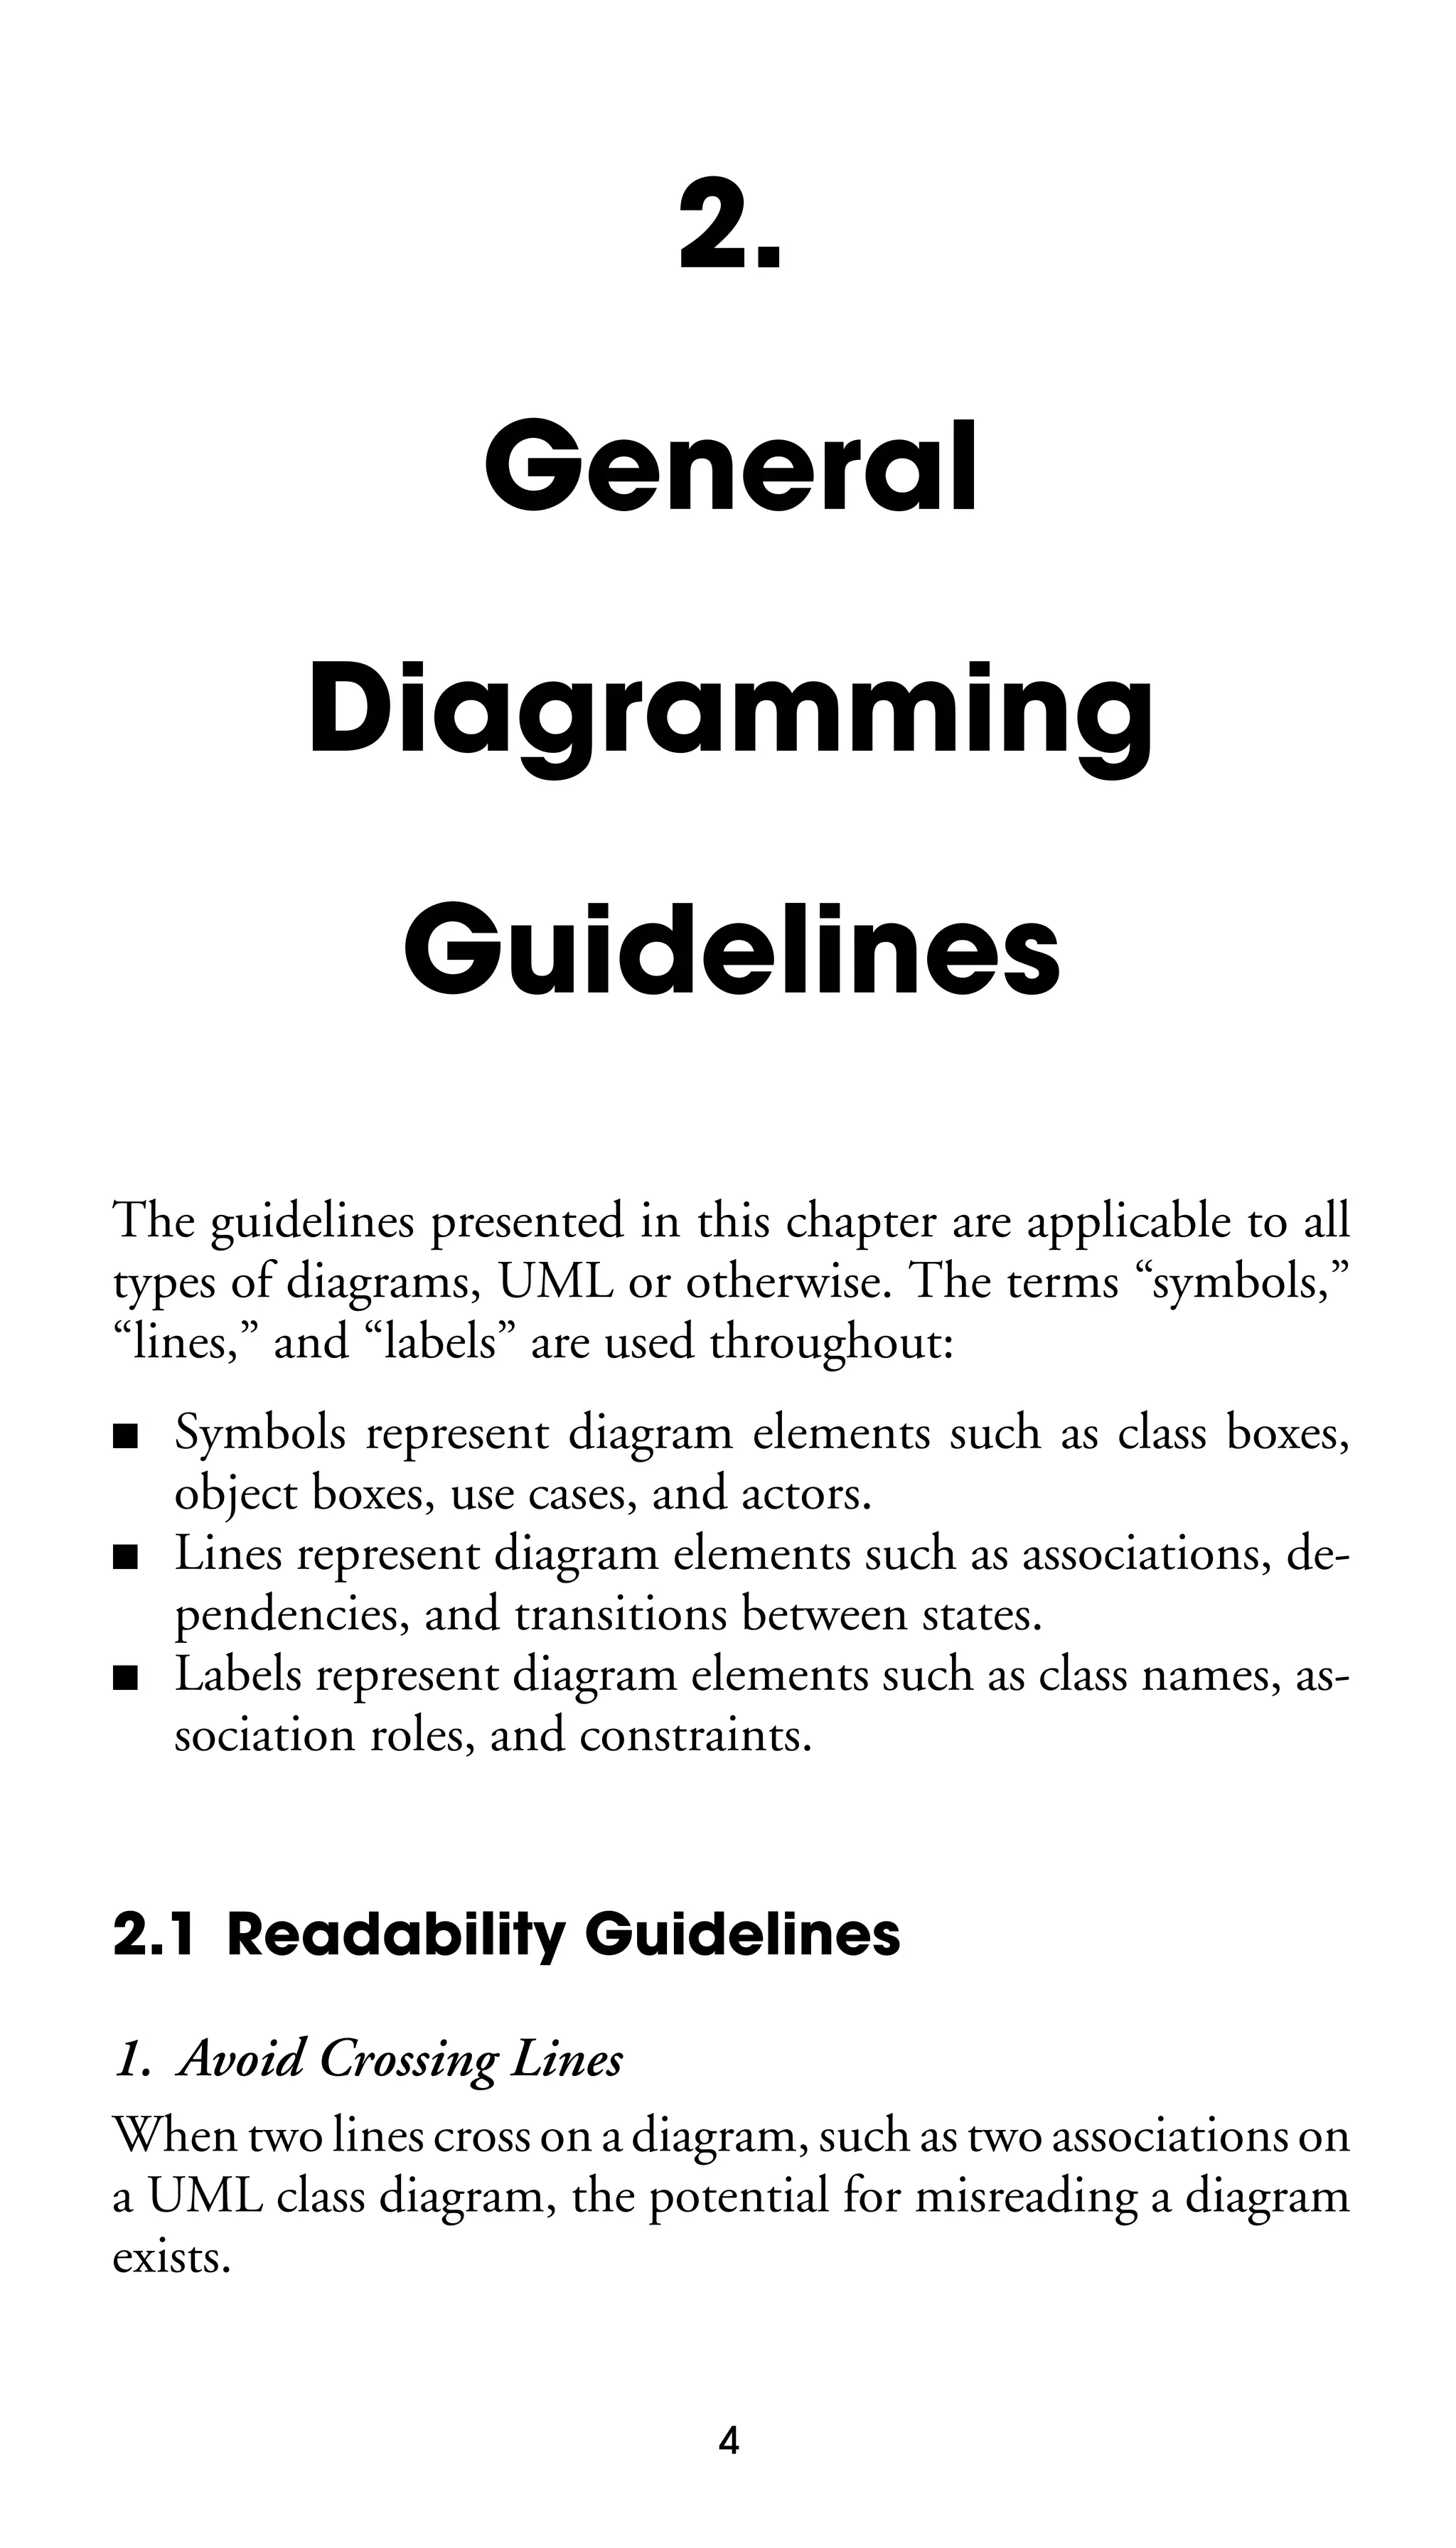
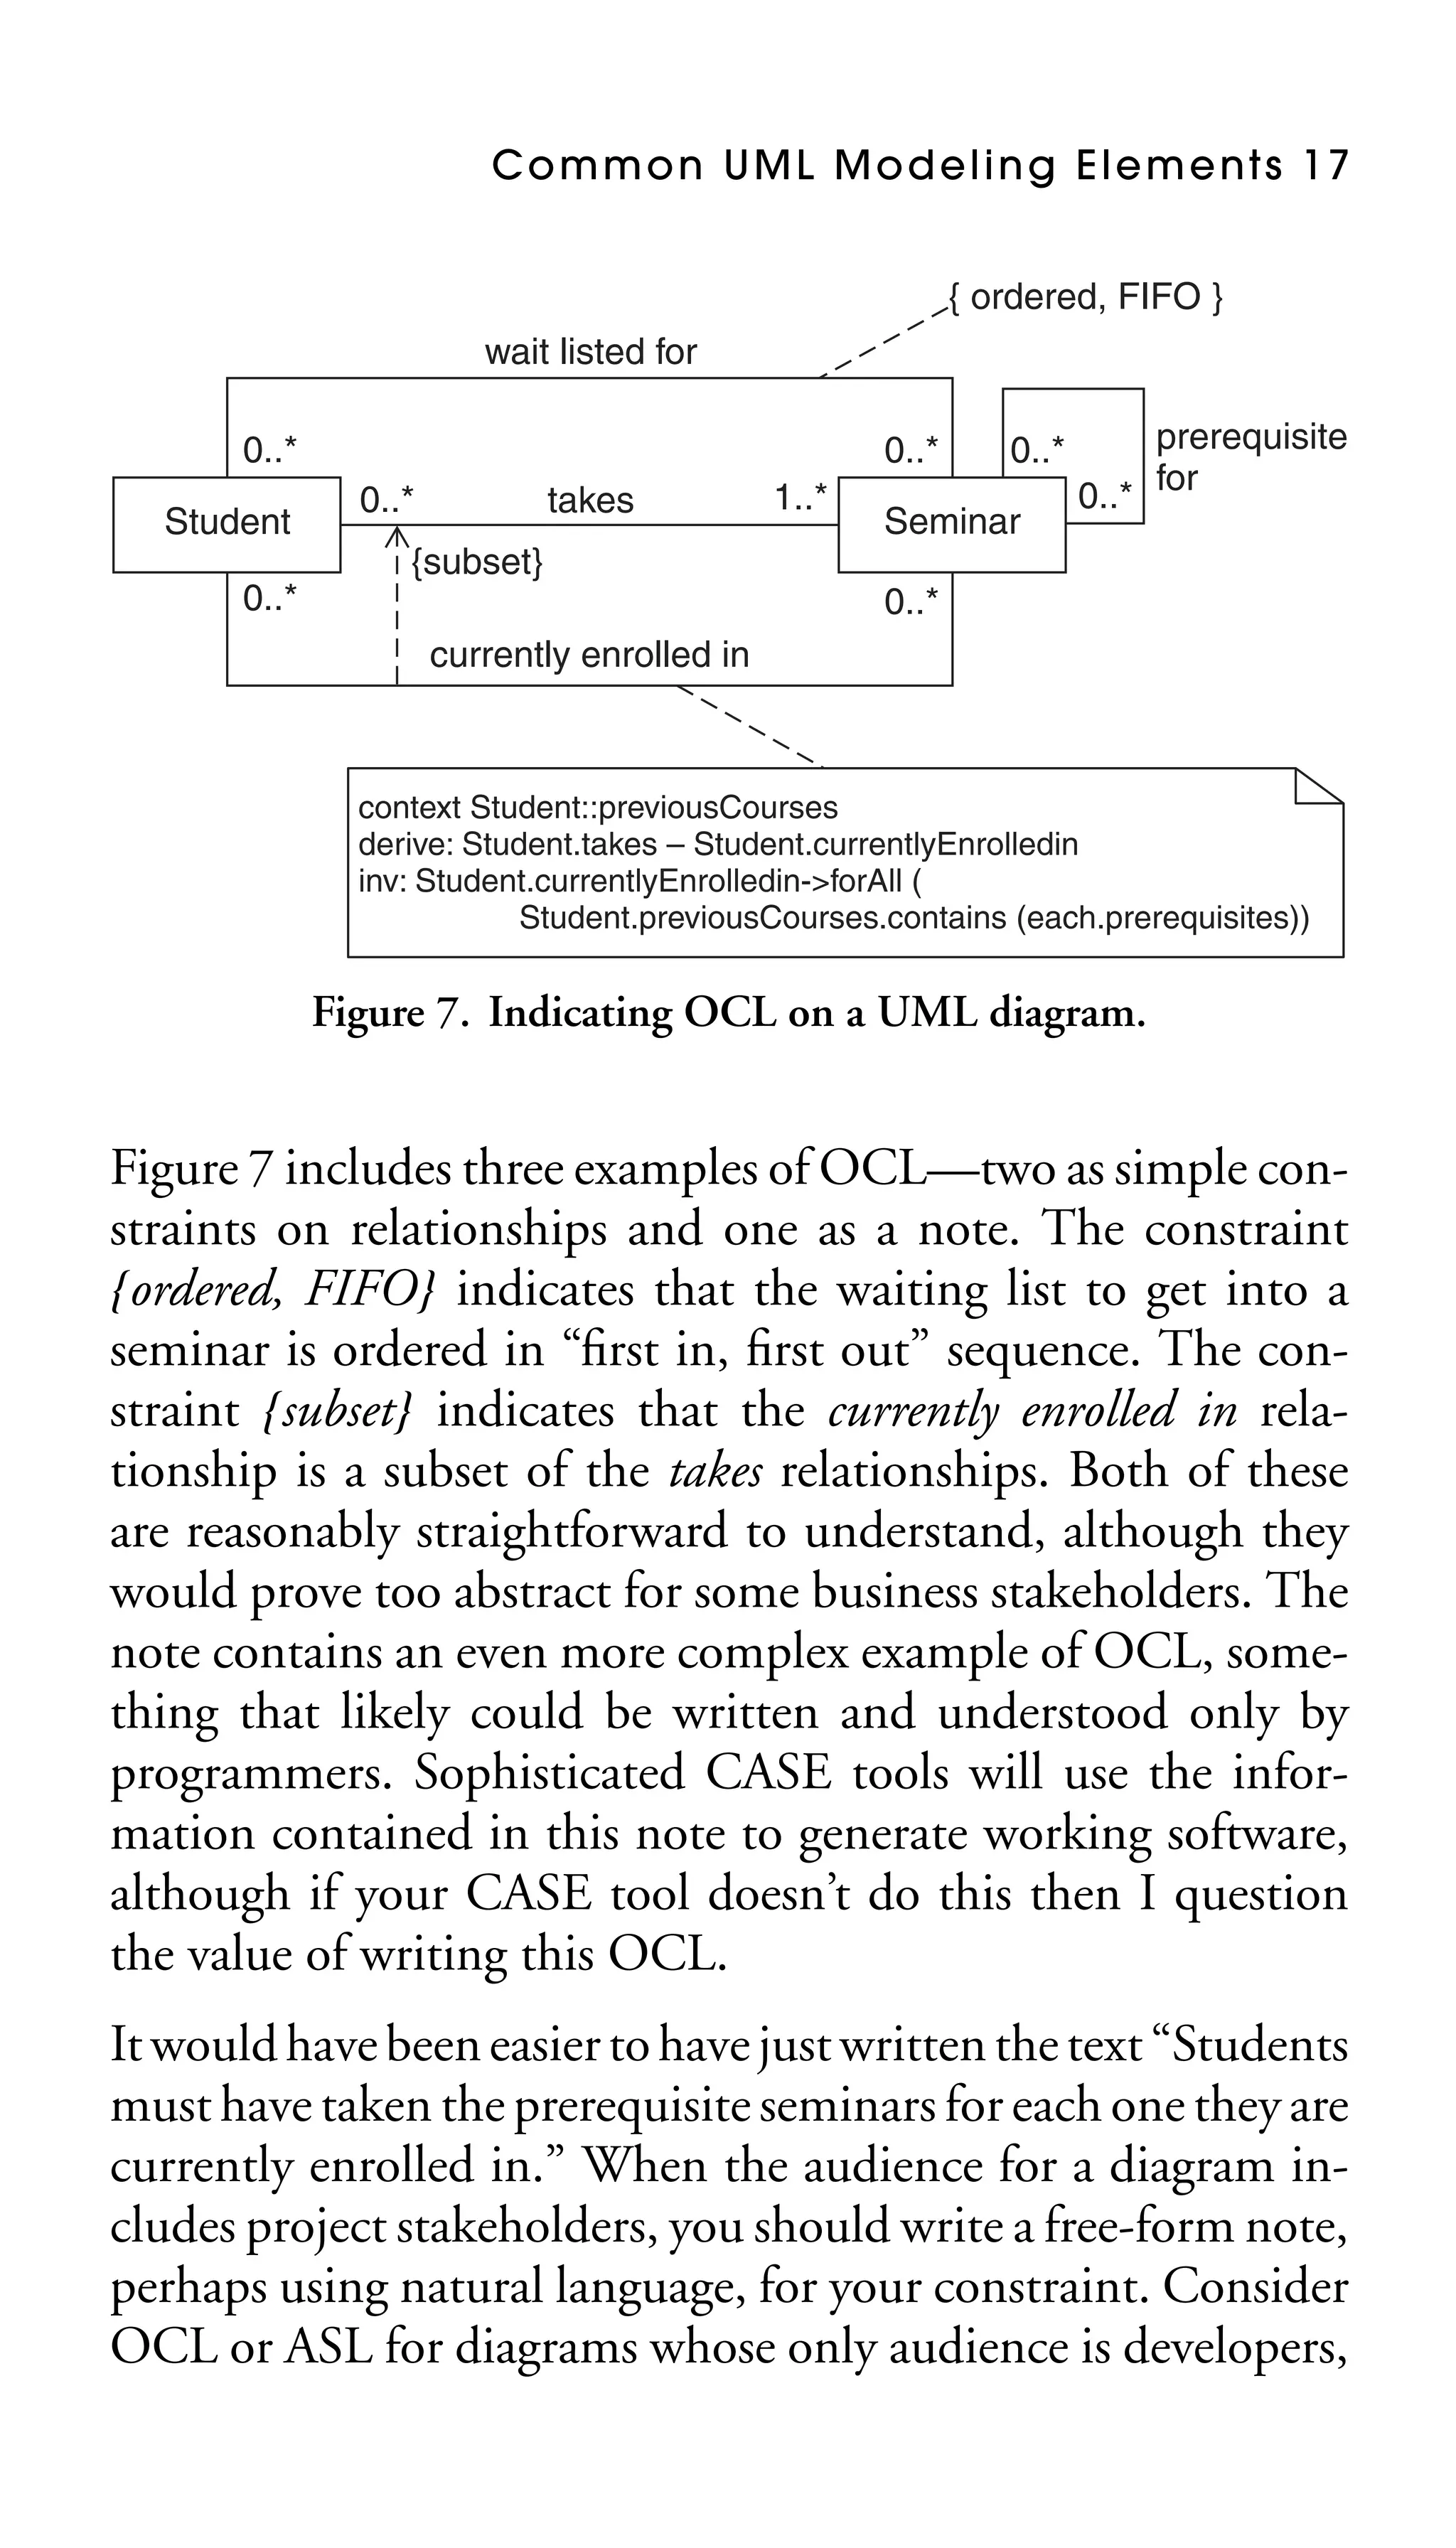
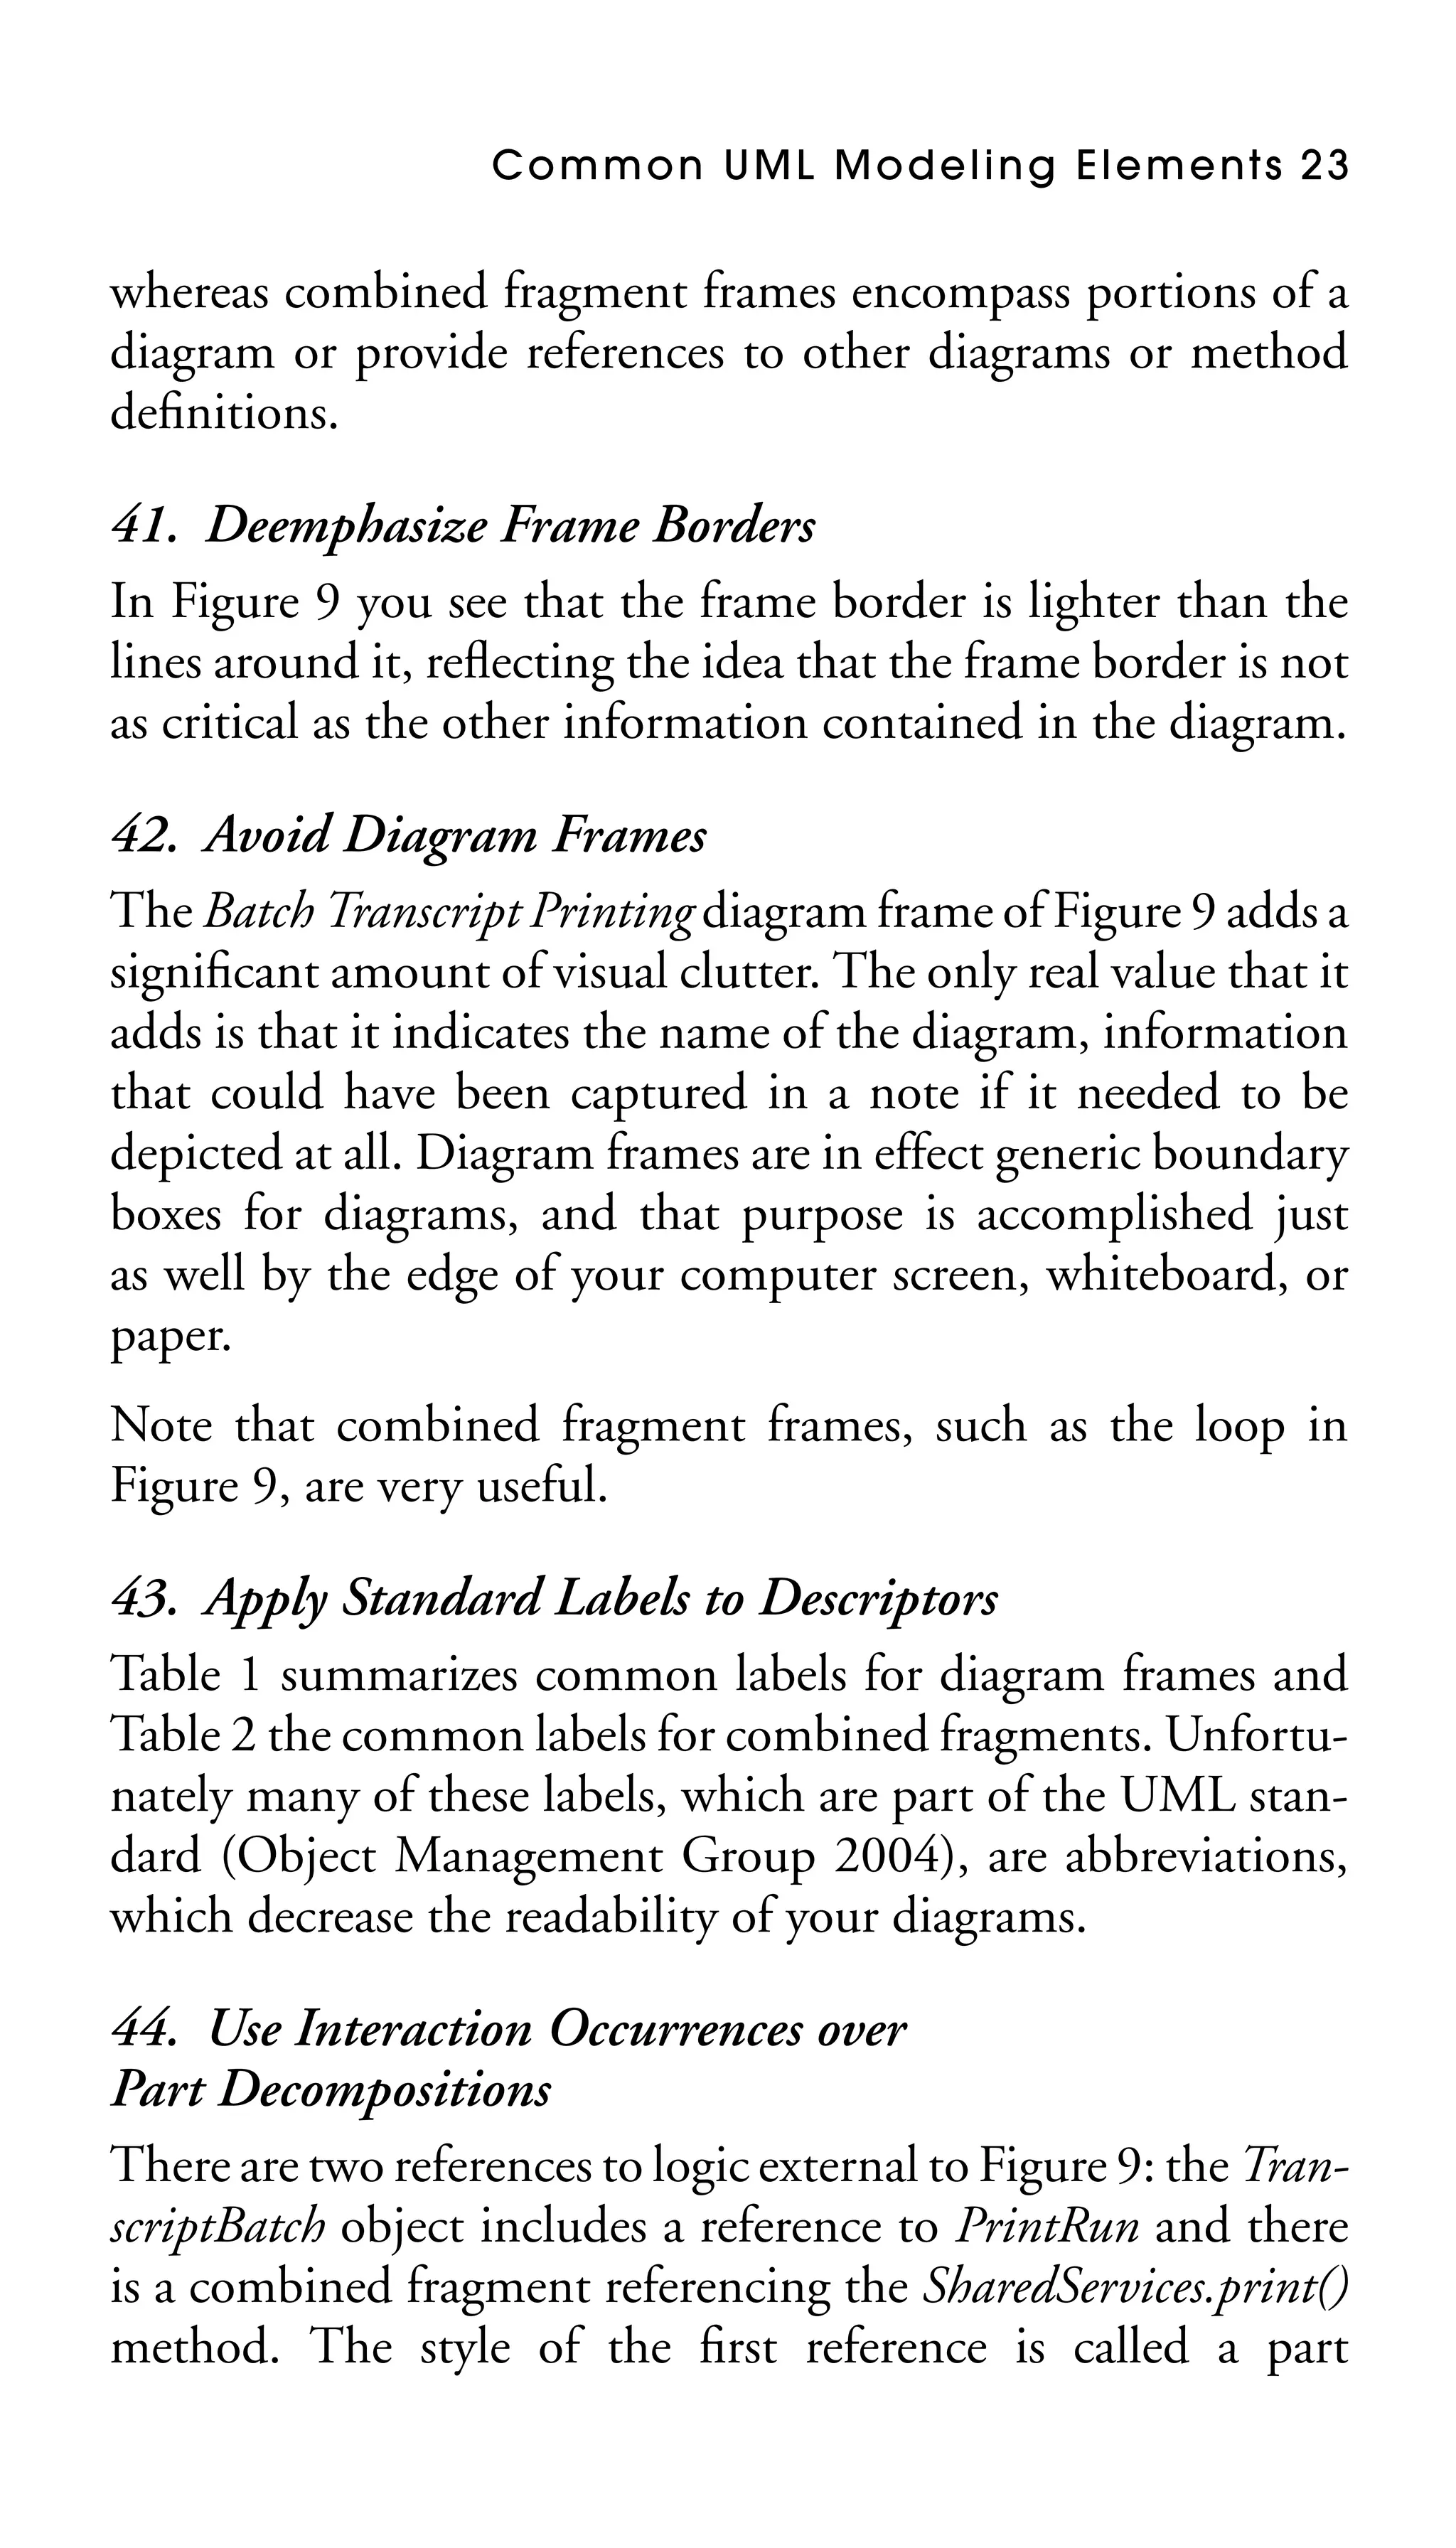
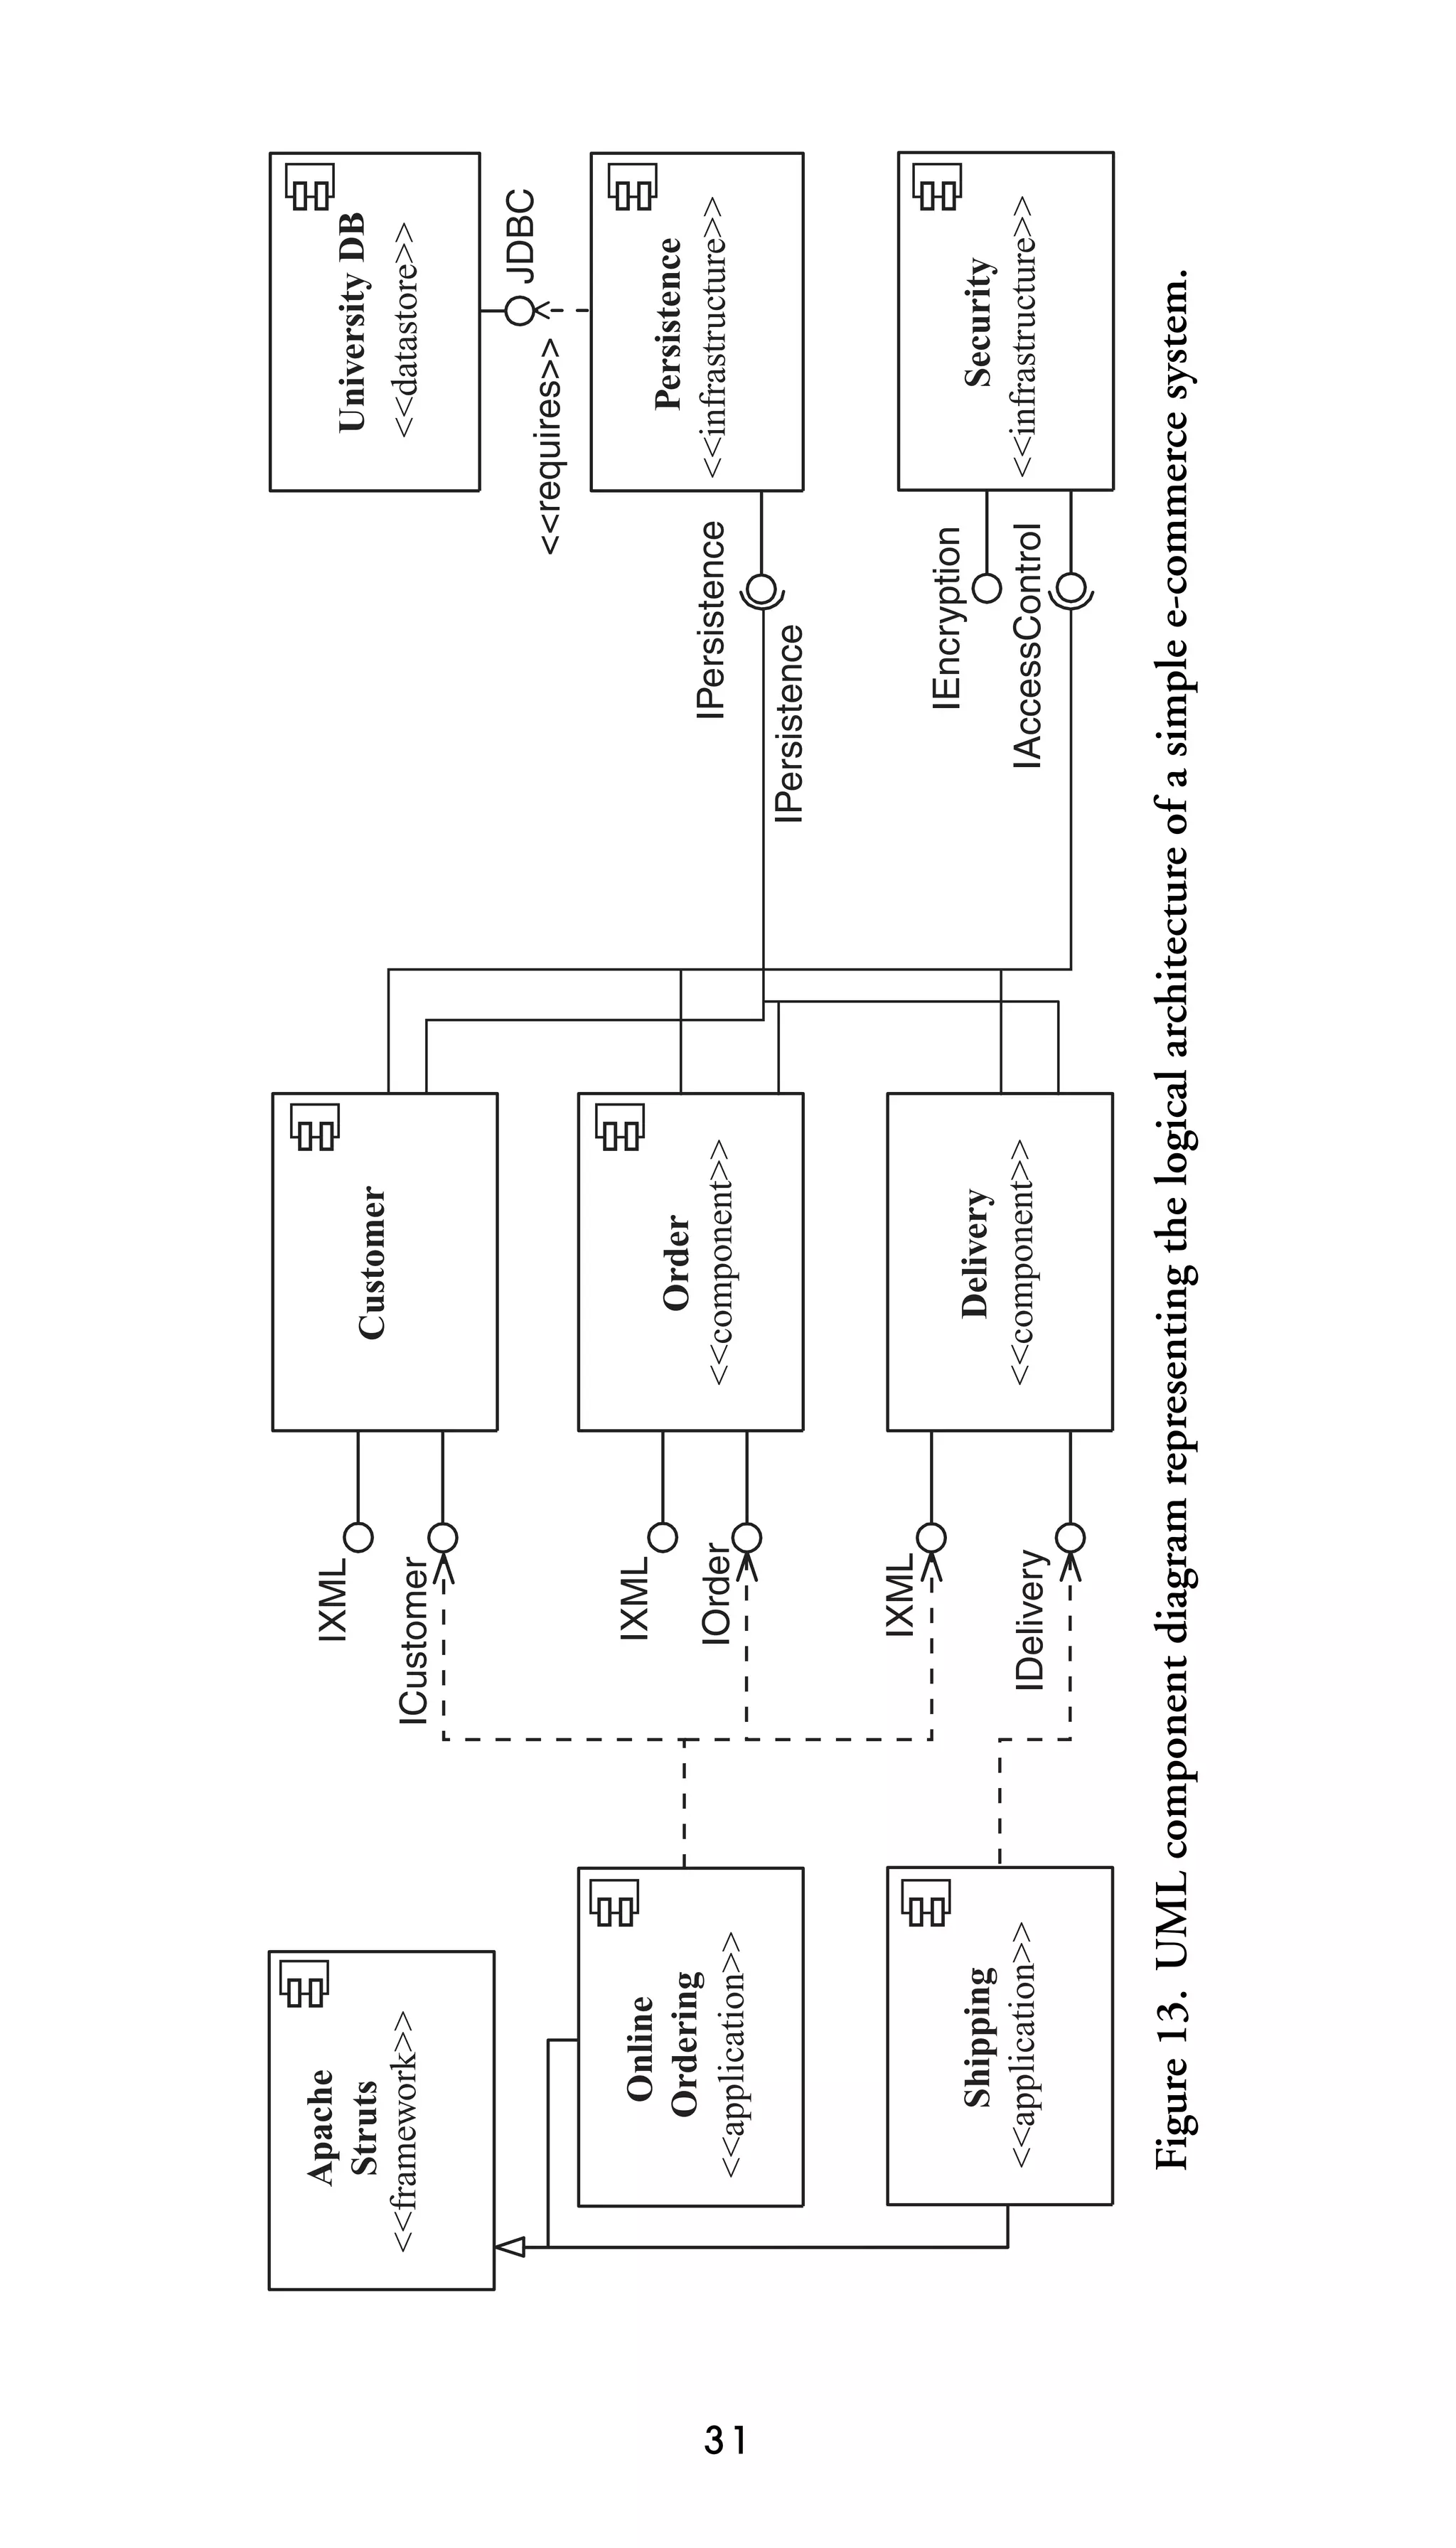
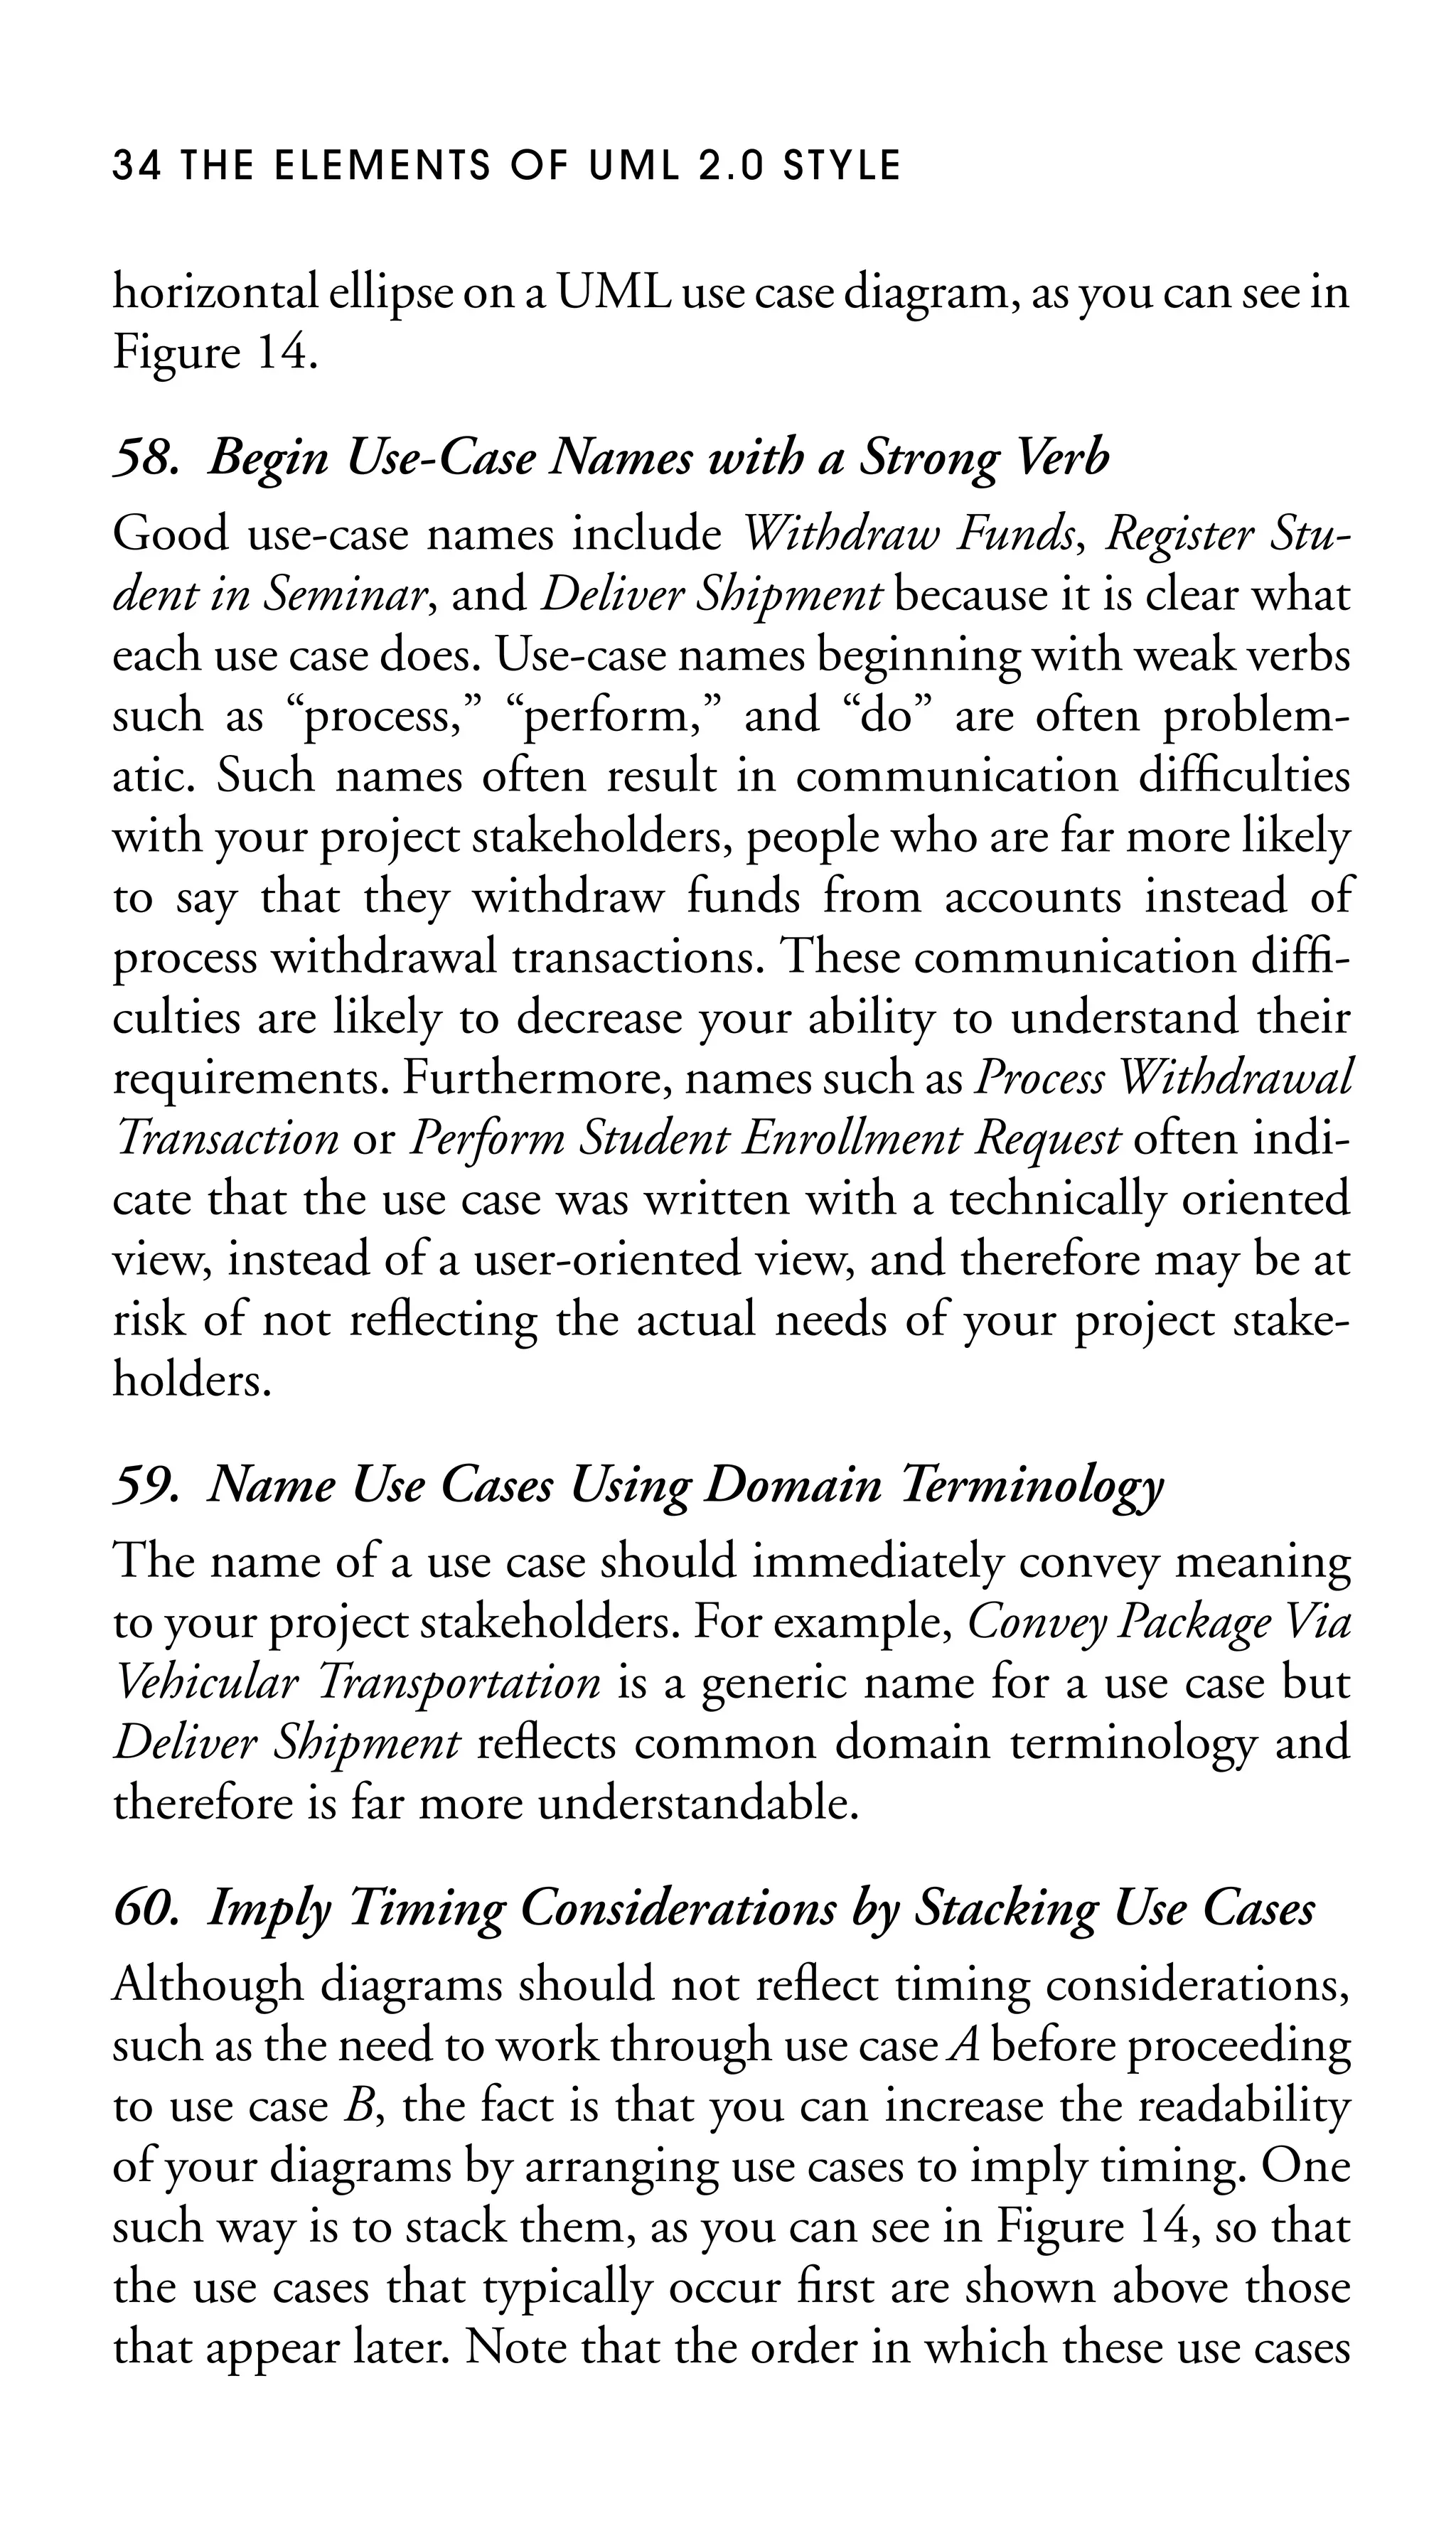
Figure 17. Enrolling students in a university.
81. Apply the “Is Like” Rule to Actor Inheritance
The sentence “the [inheriting actor name] is like the [parent
actor name]” should make sense. In Figure 16, it makes sense
to say that an international student is like a student; therefore
it’s a good indication that generalization makes sense. It doesn’t
make sense in Figure 15 to say that customer support is like a
payment processor because the two roles are clearly different.
82. Place an Inheriting Actor Below the Parent Actor
It is a common convention to draw generalization relationships vertically, with the inheriting actor placed lower on your
diagram than the parent actor, as you can see in Figure 16 with
International Student and Student.
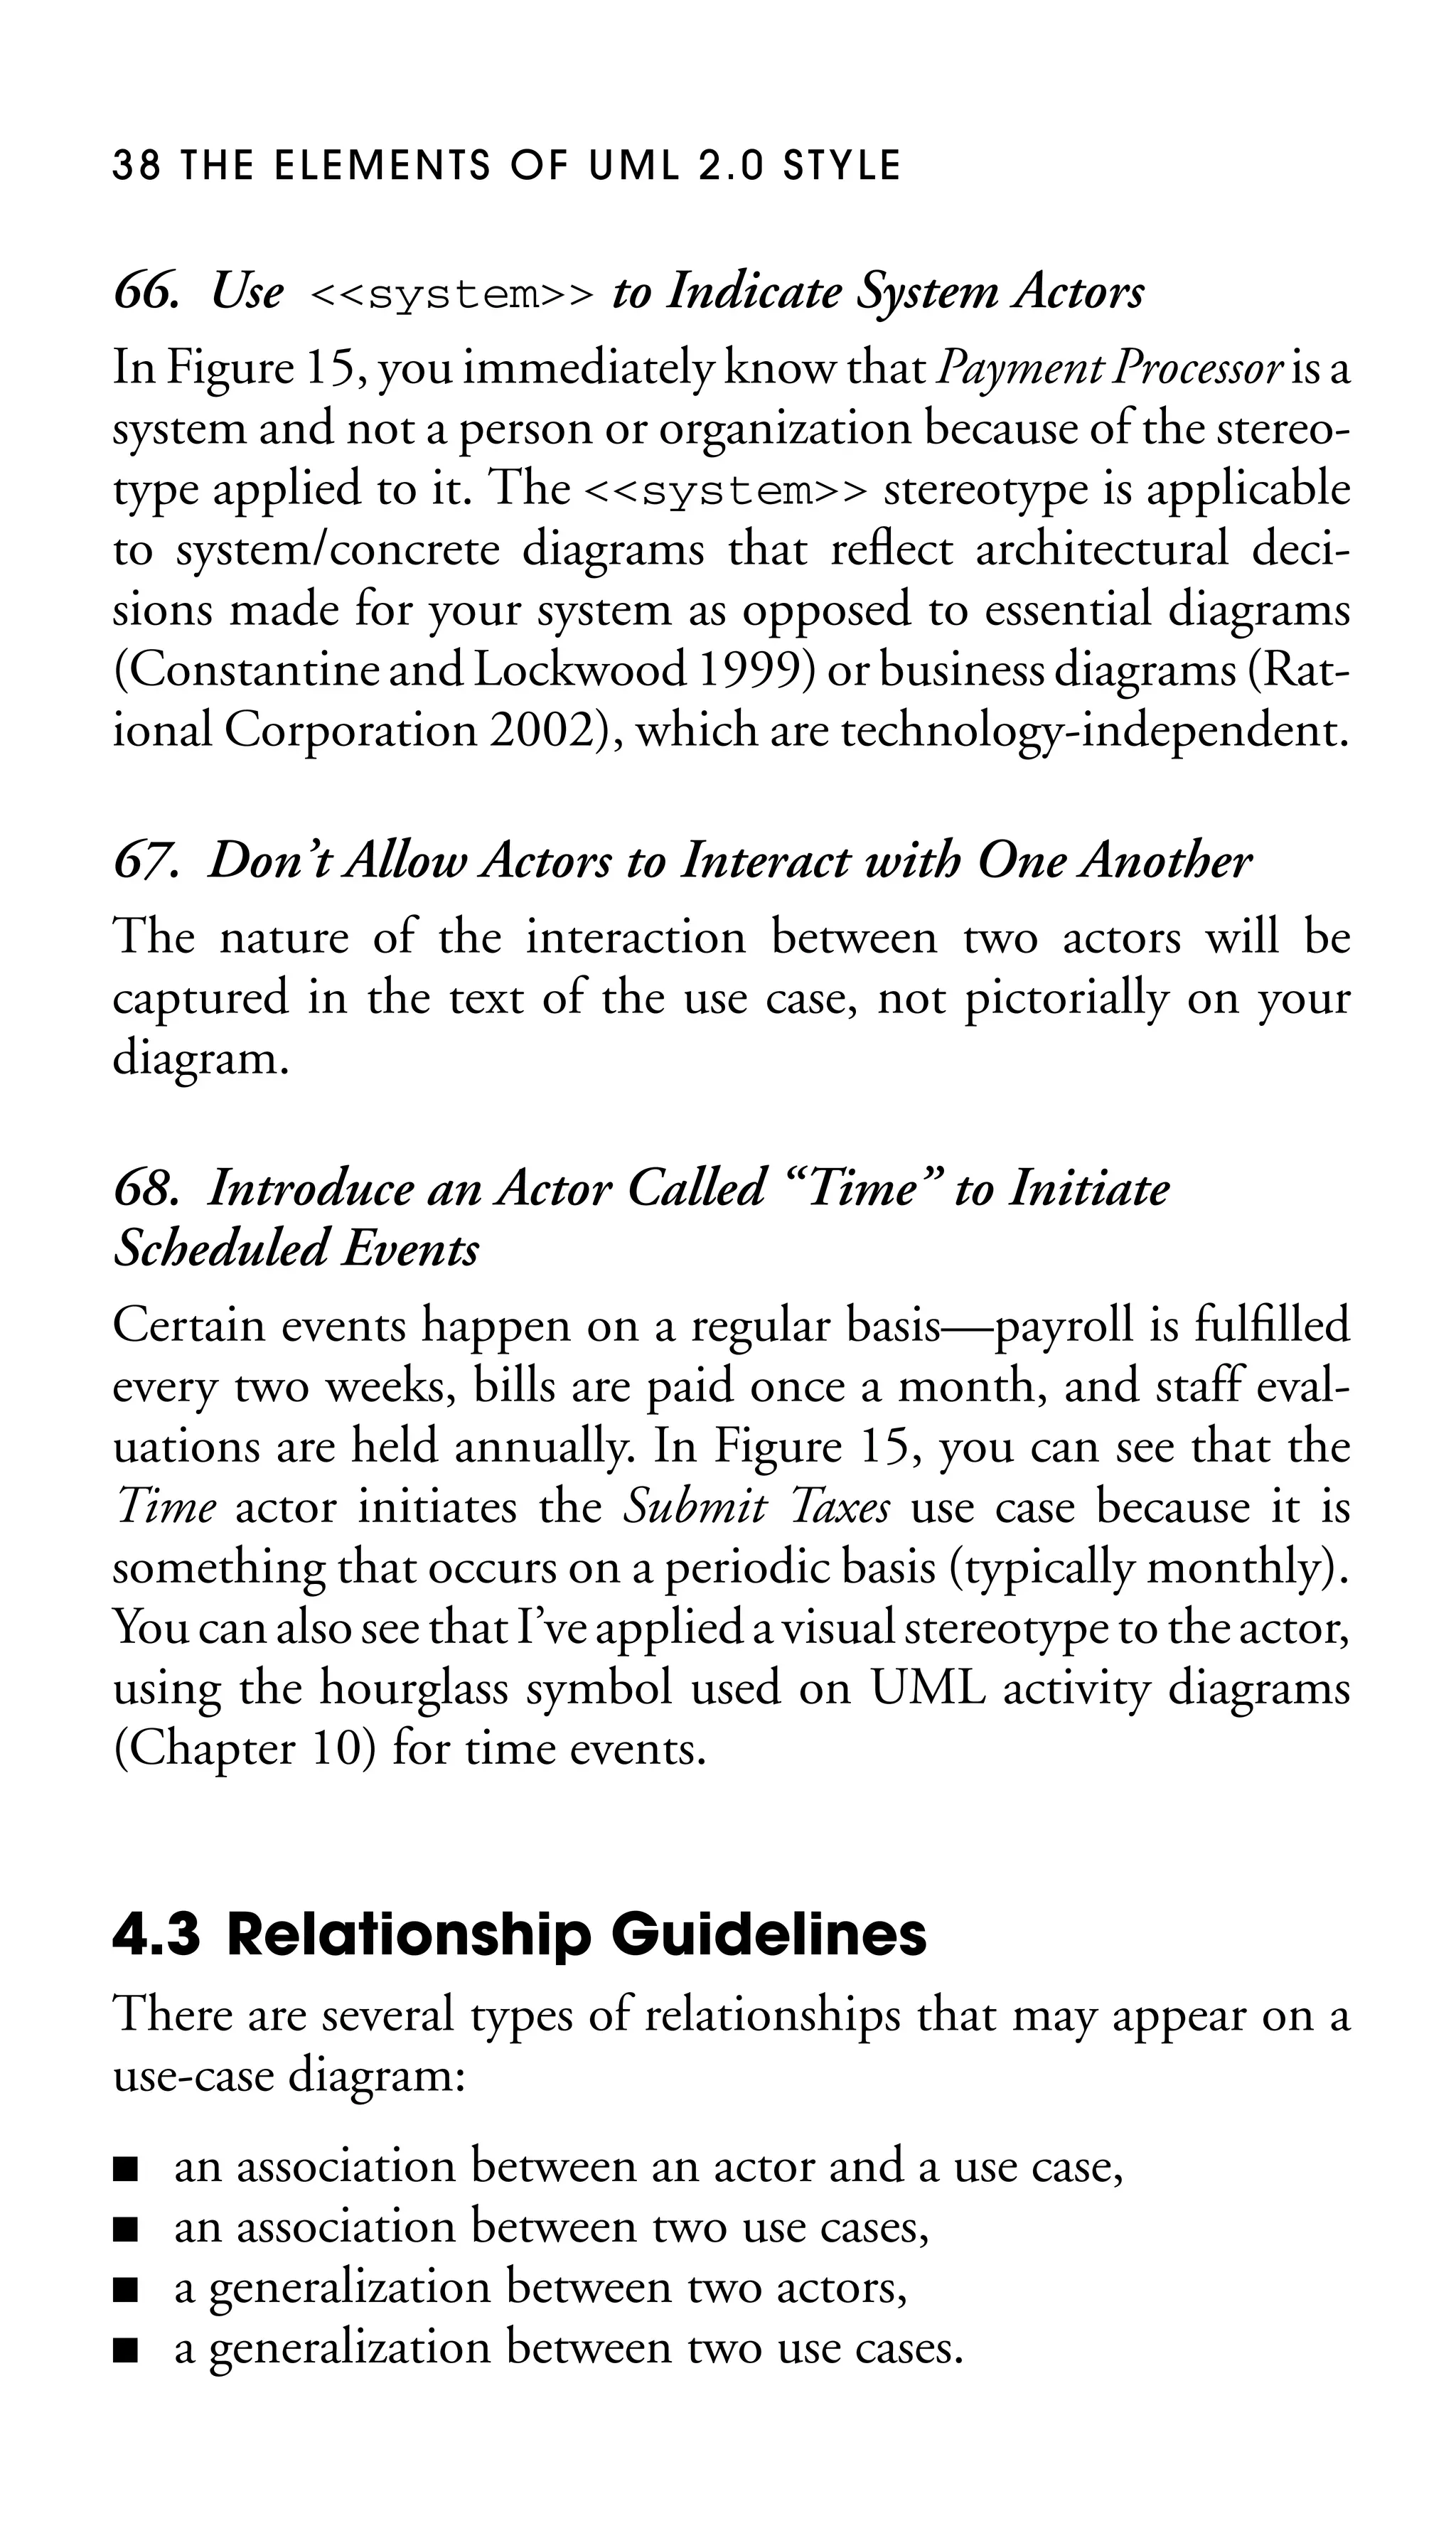
83. Avoid Modeling Extension Points
Figure 17 shows the notation for indicating extension points
within a use-case bubble. In my experience this information
is extraneous in diagrams. If you want it you can simply read
the use-case text.](https://image.slidesharecdn.com/2005-050521616786theelementsofuml2style-131128083647-phpapp02/75/the-elements-of-uml-2-style-57-2048.jpg)


![104
cancelled
Proposed
cancelled
Scheduled
open
student dropped
[no seat available]
seminar split
cancelled
closed
cancelled
Closed to Enrollment
entry/ notifyInstructor()
student dropped
cancelled
[seat available] /
enrollFromWaitingList()
closed
seat available
Full
enroll student /
addToWaitingList();
considerSplit()
student enrolled
[no seat available] /
addToWaitingList()
entry/ logSize()
Open For Enrollment
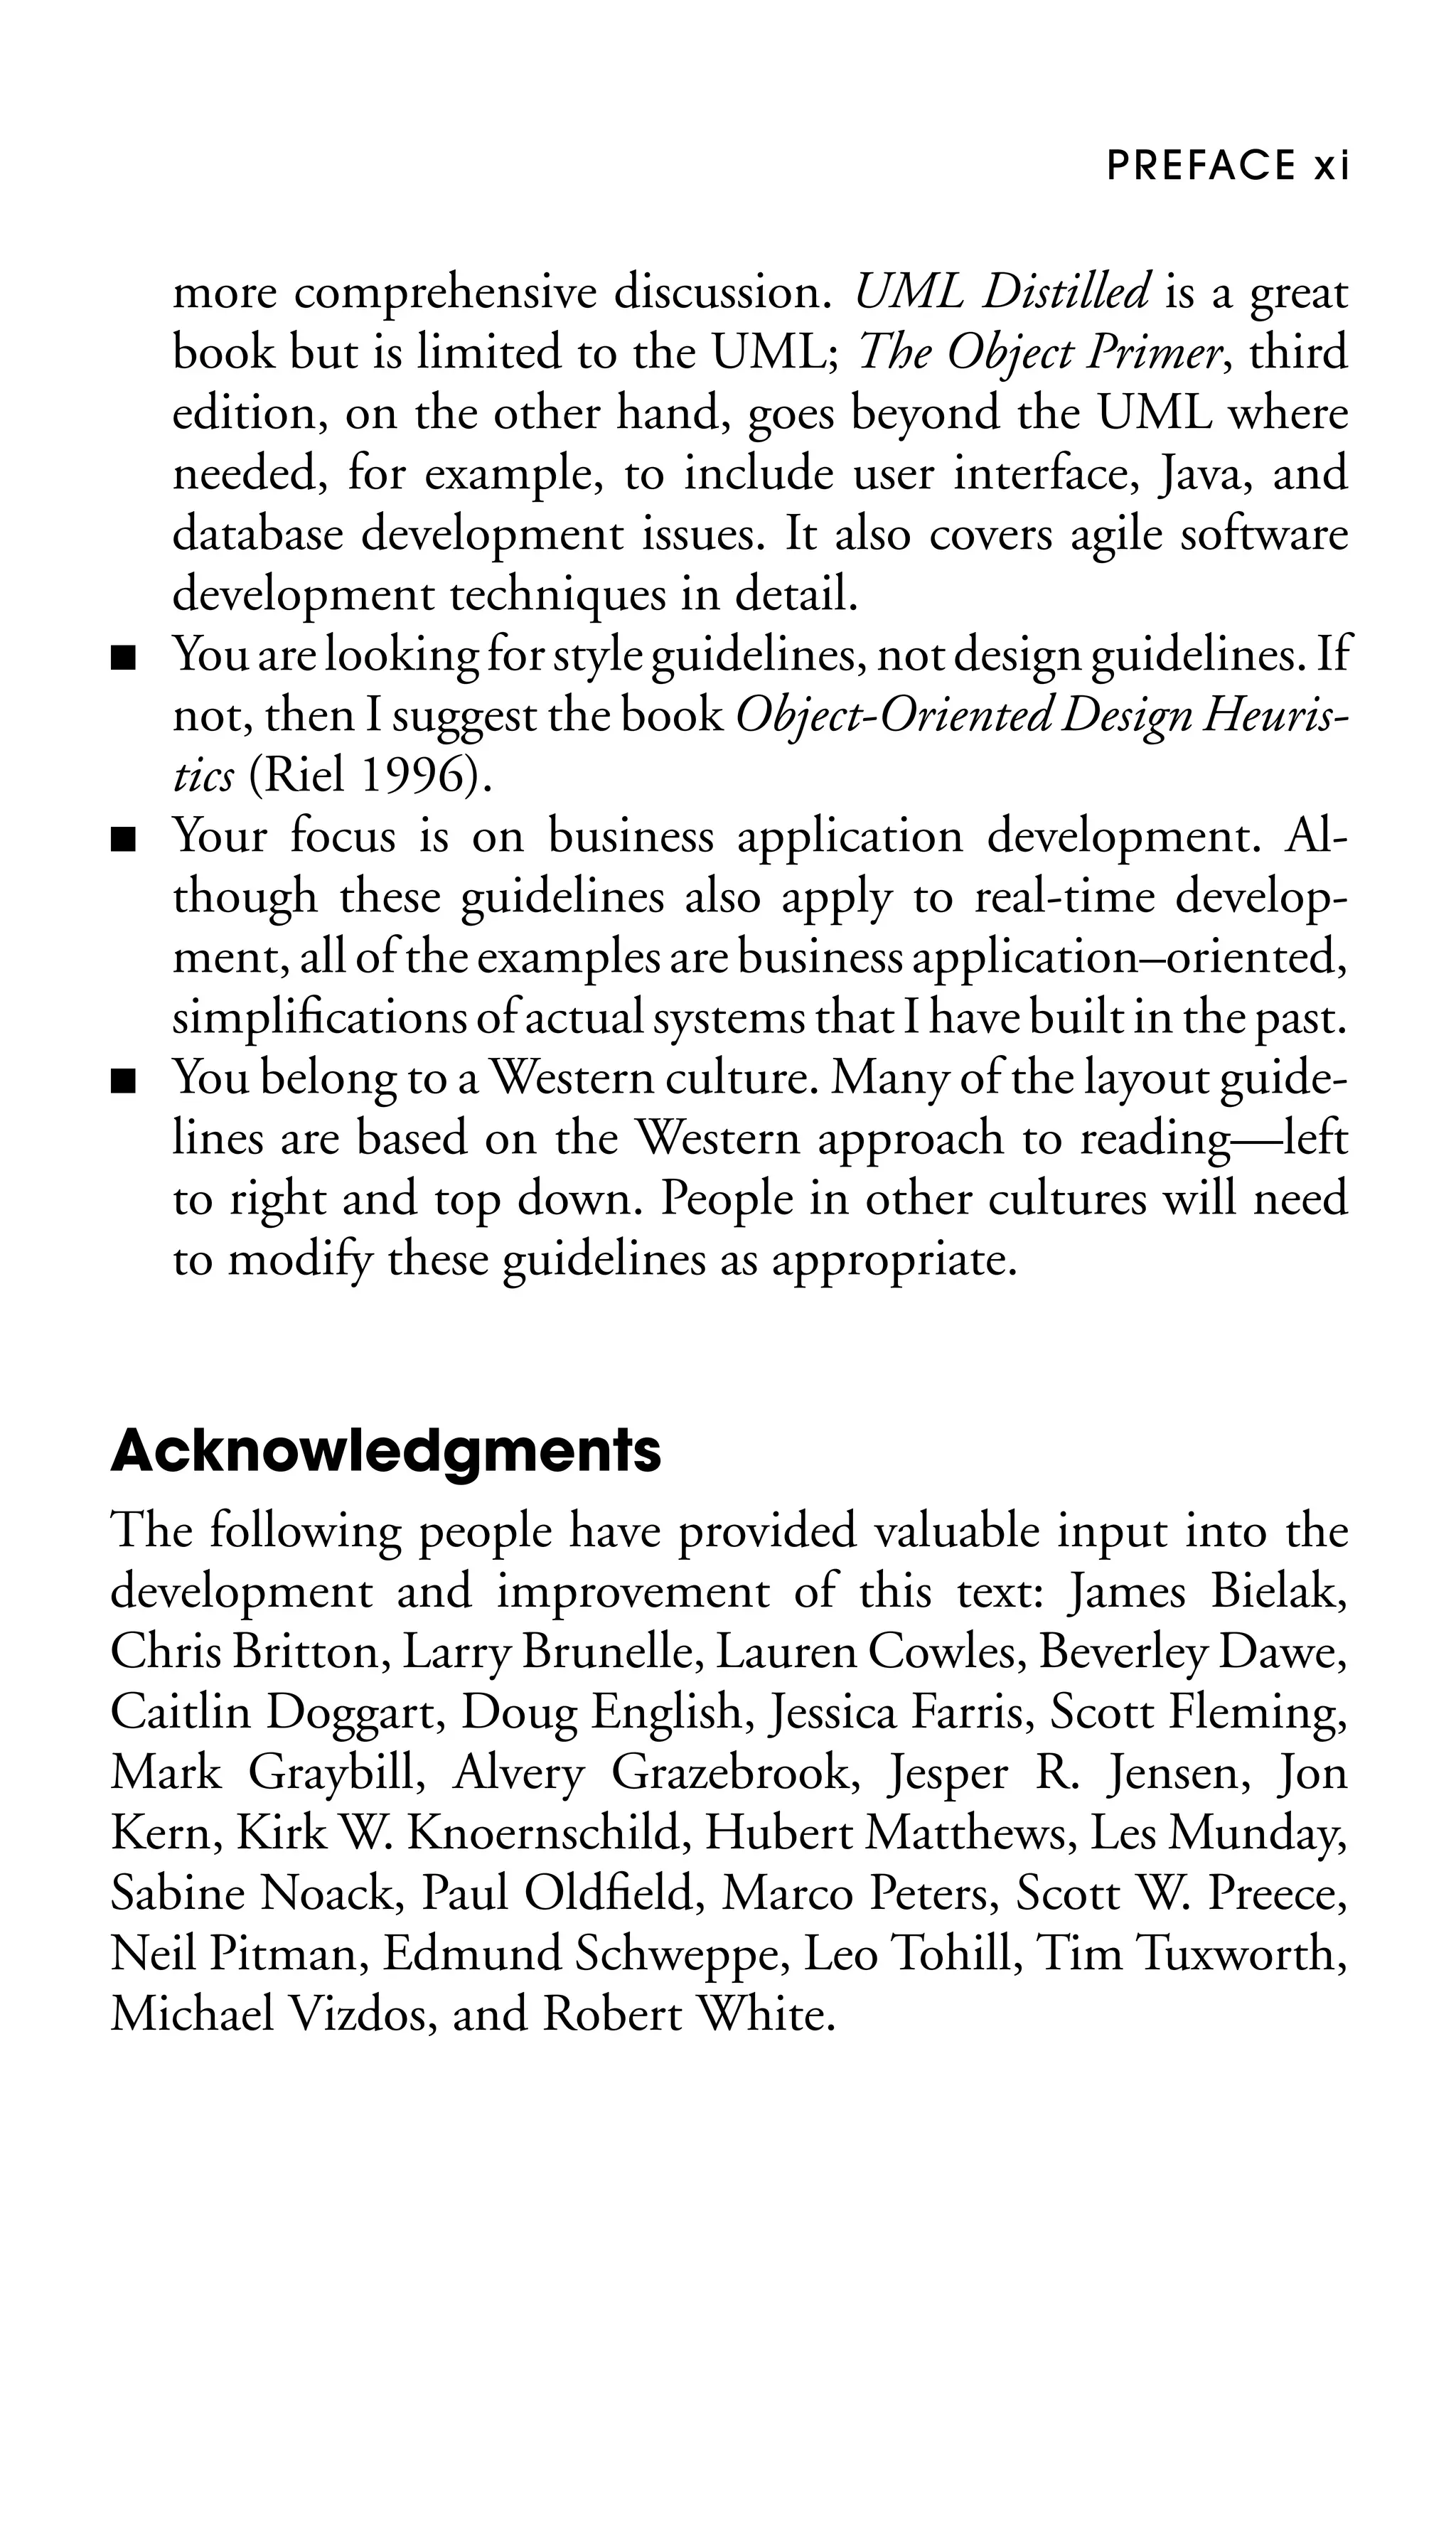
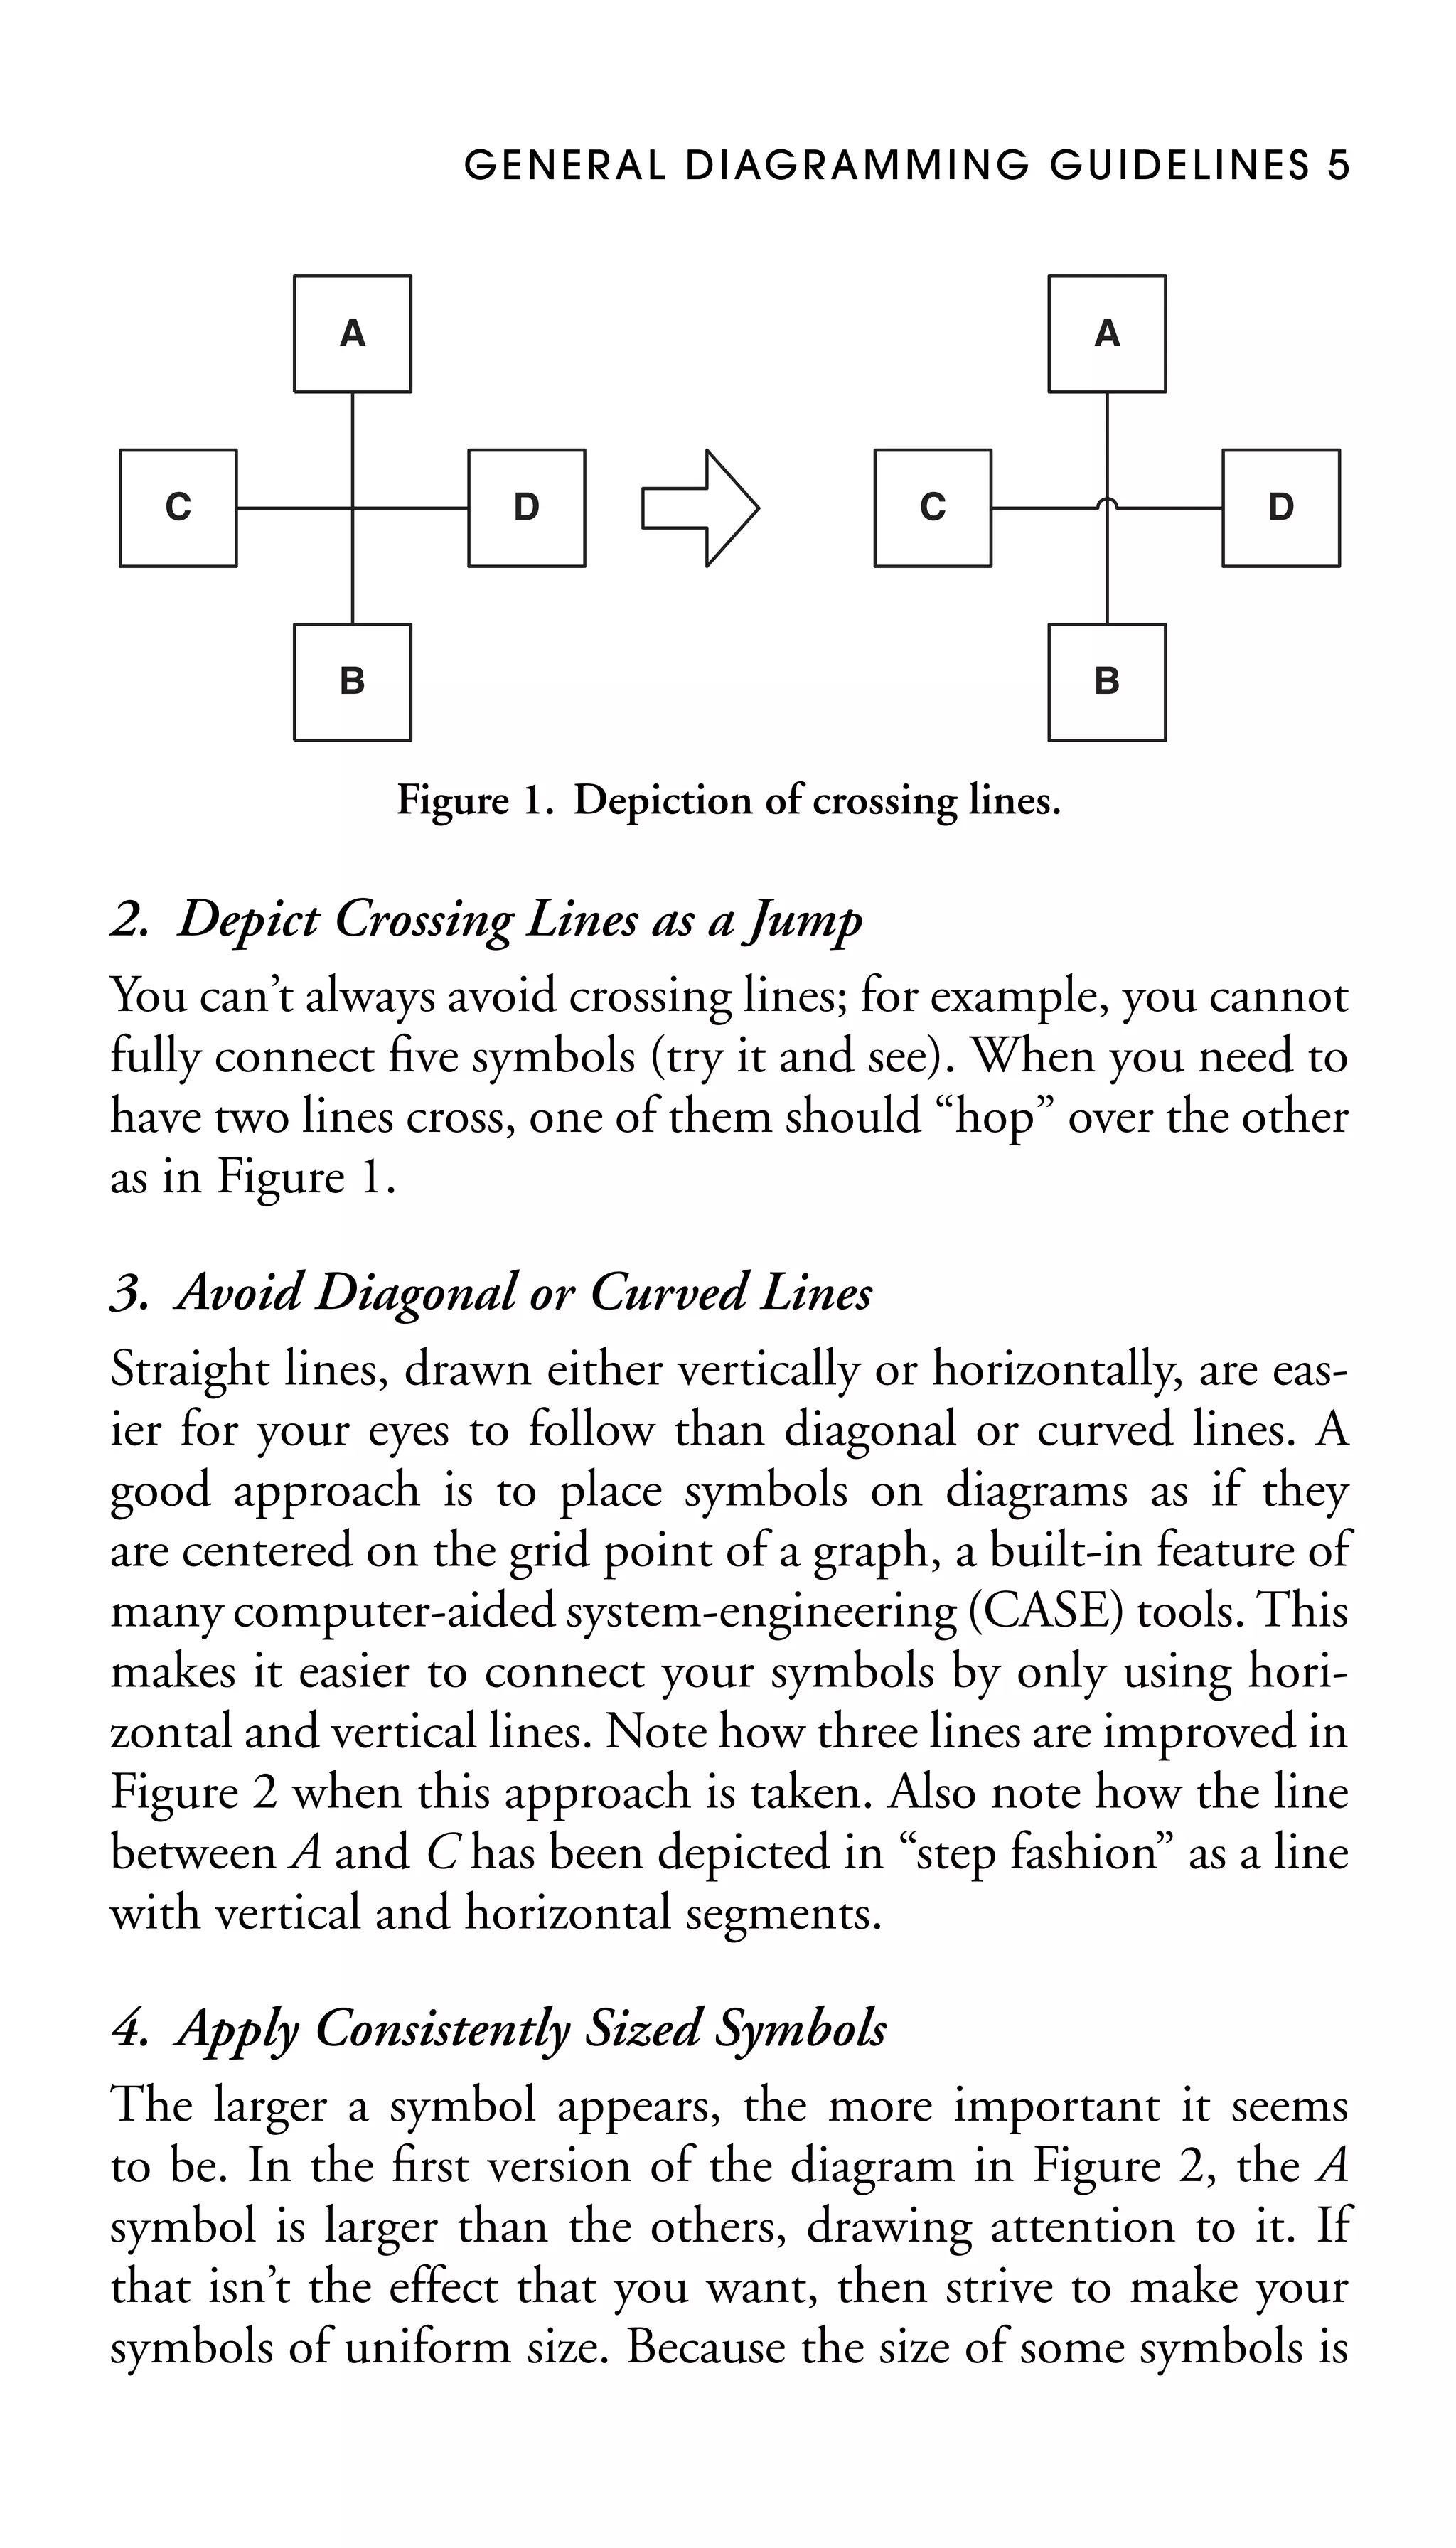
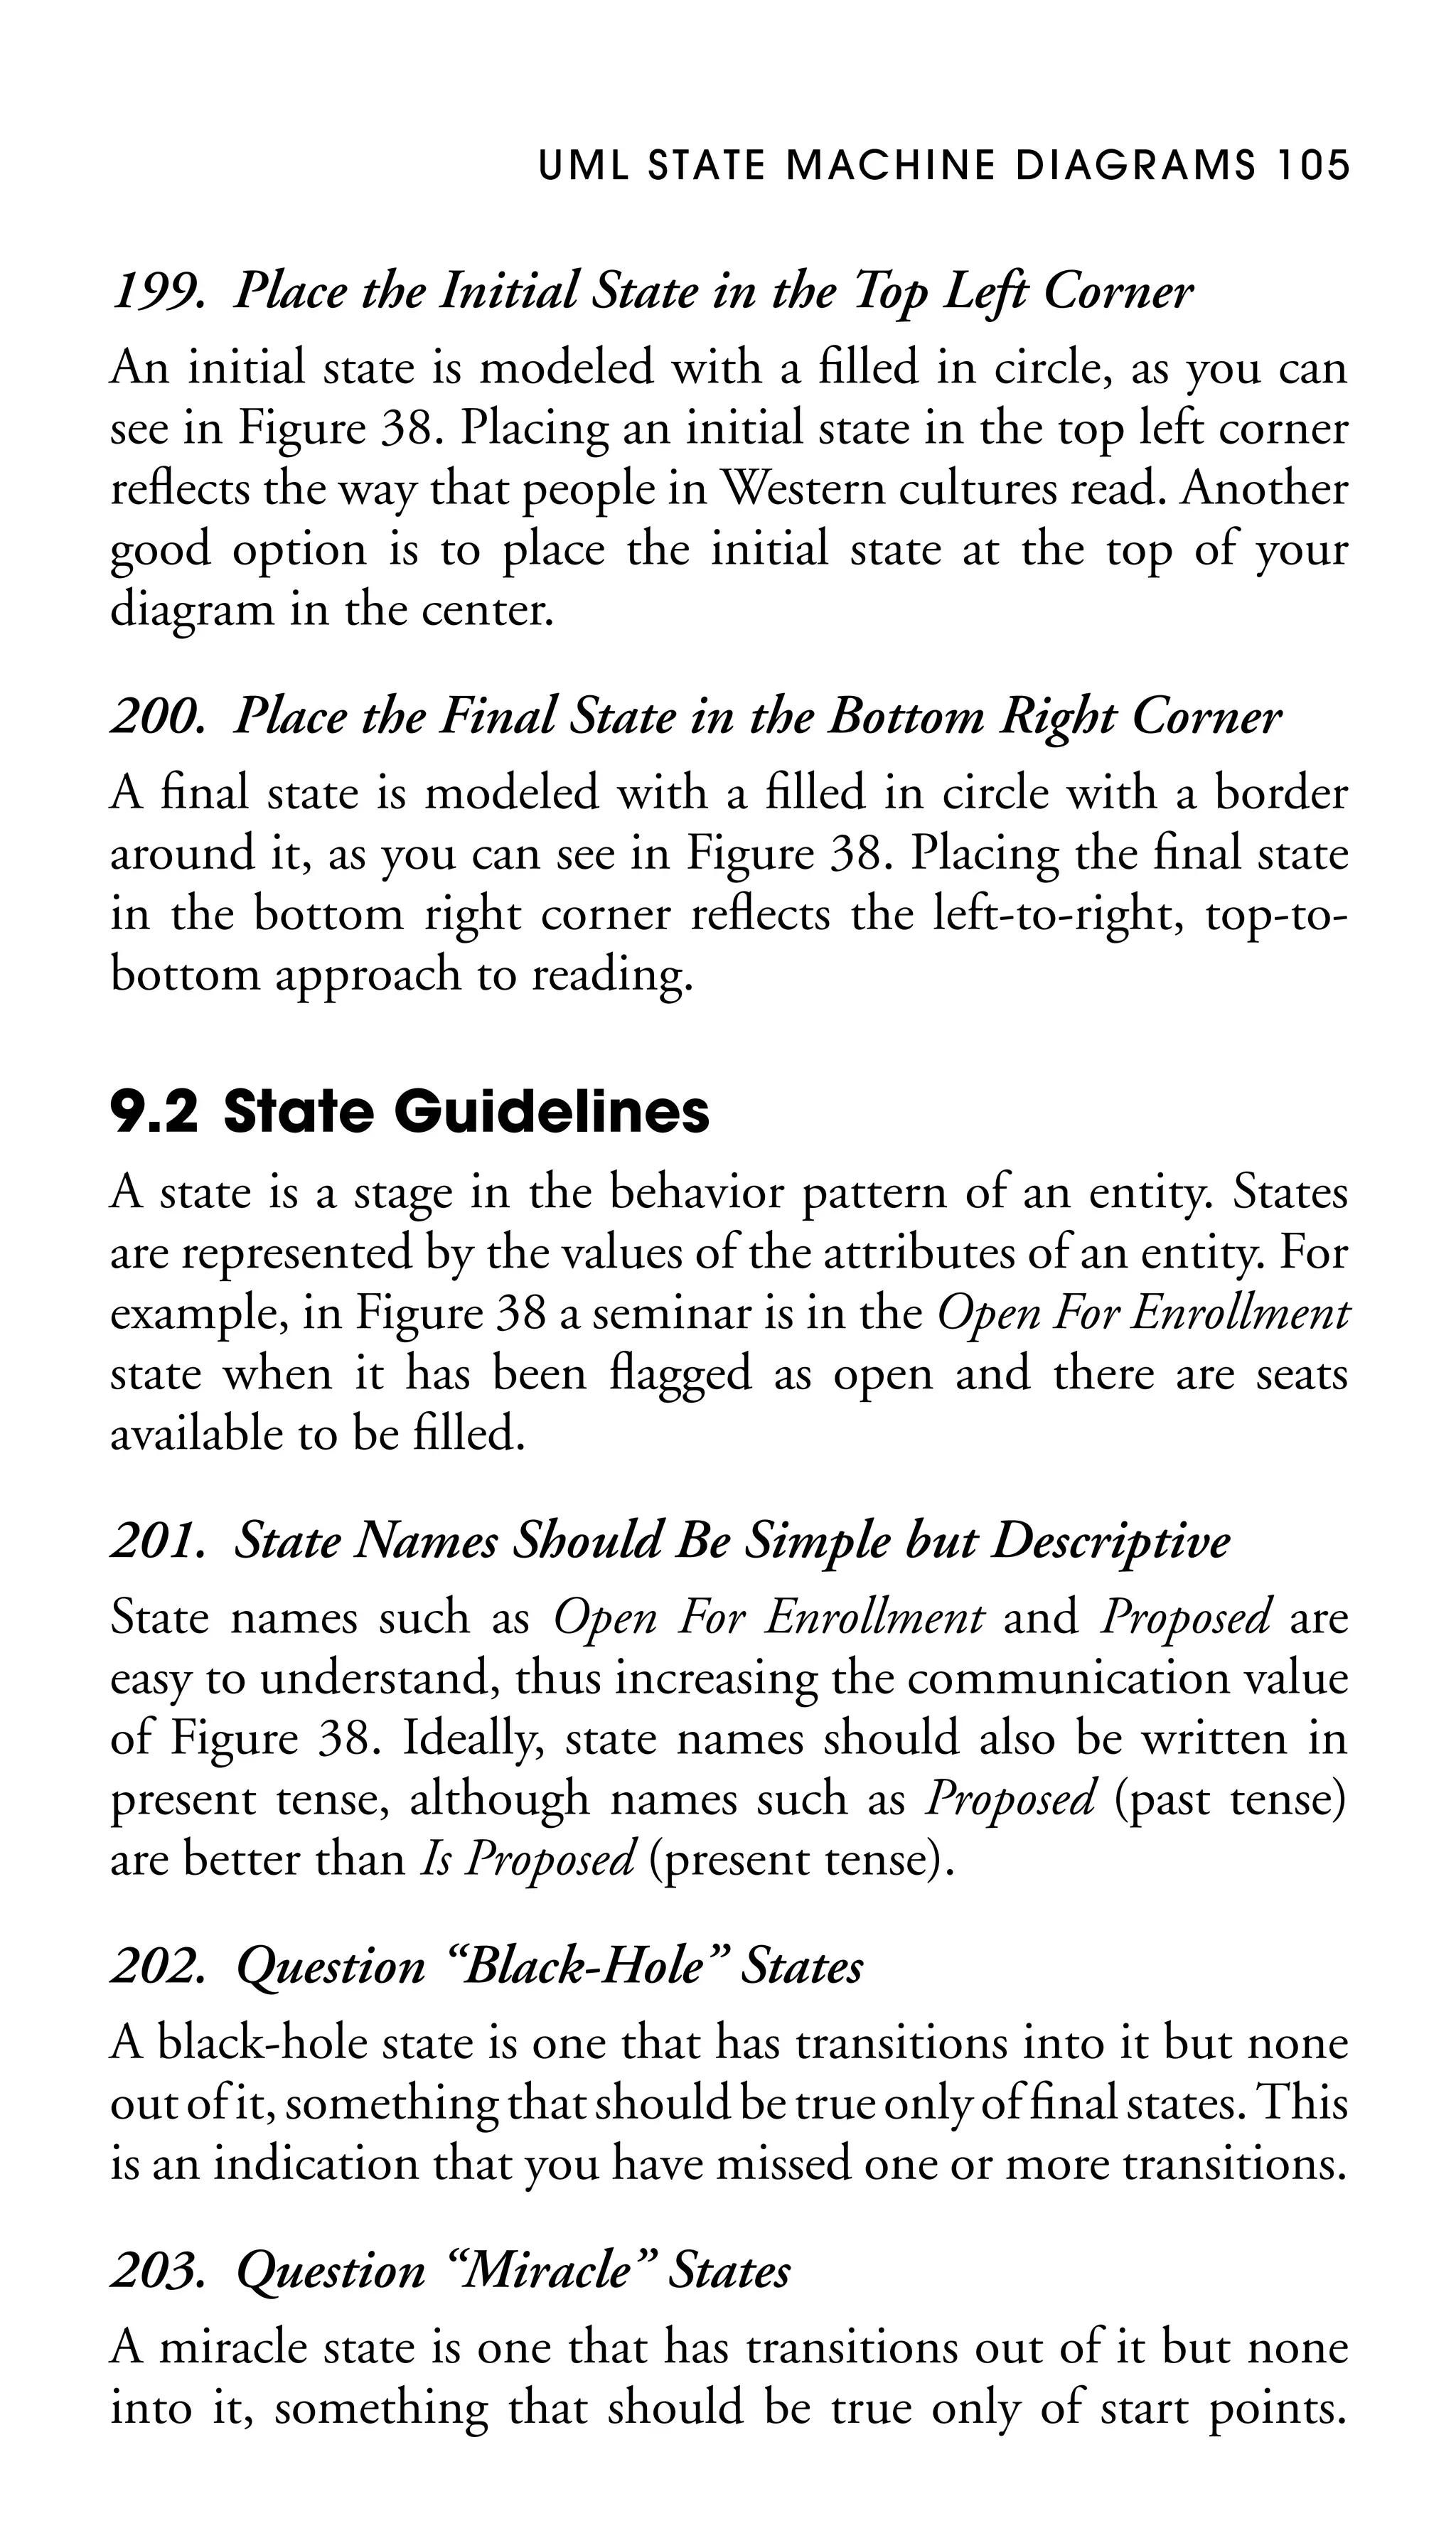
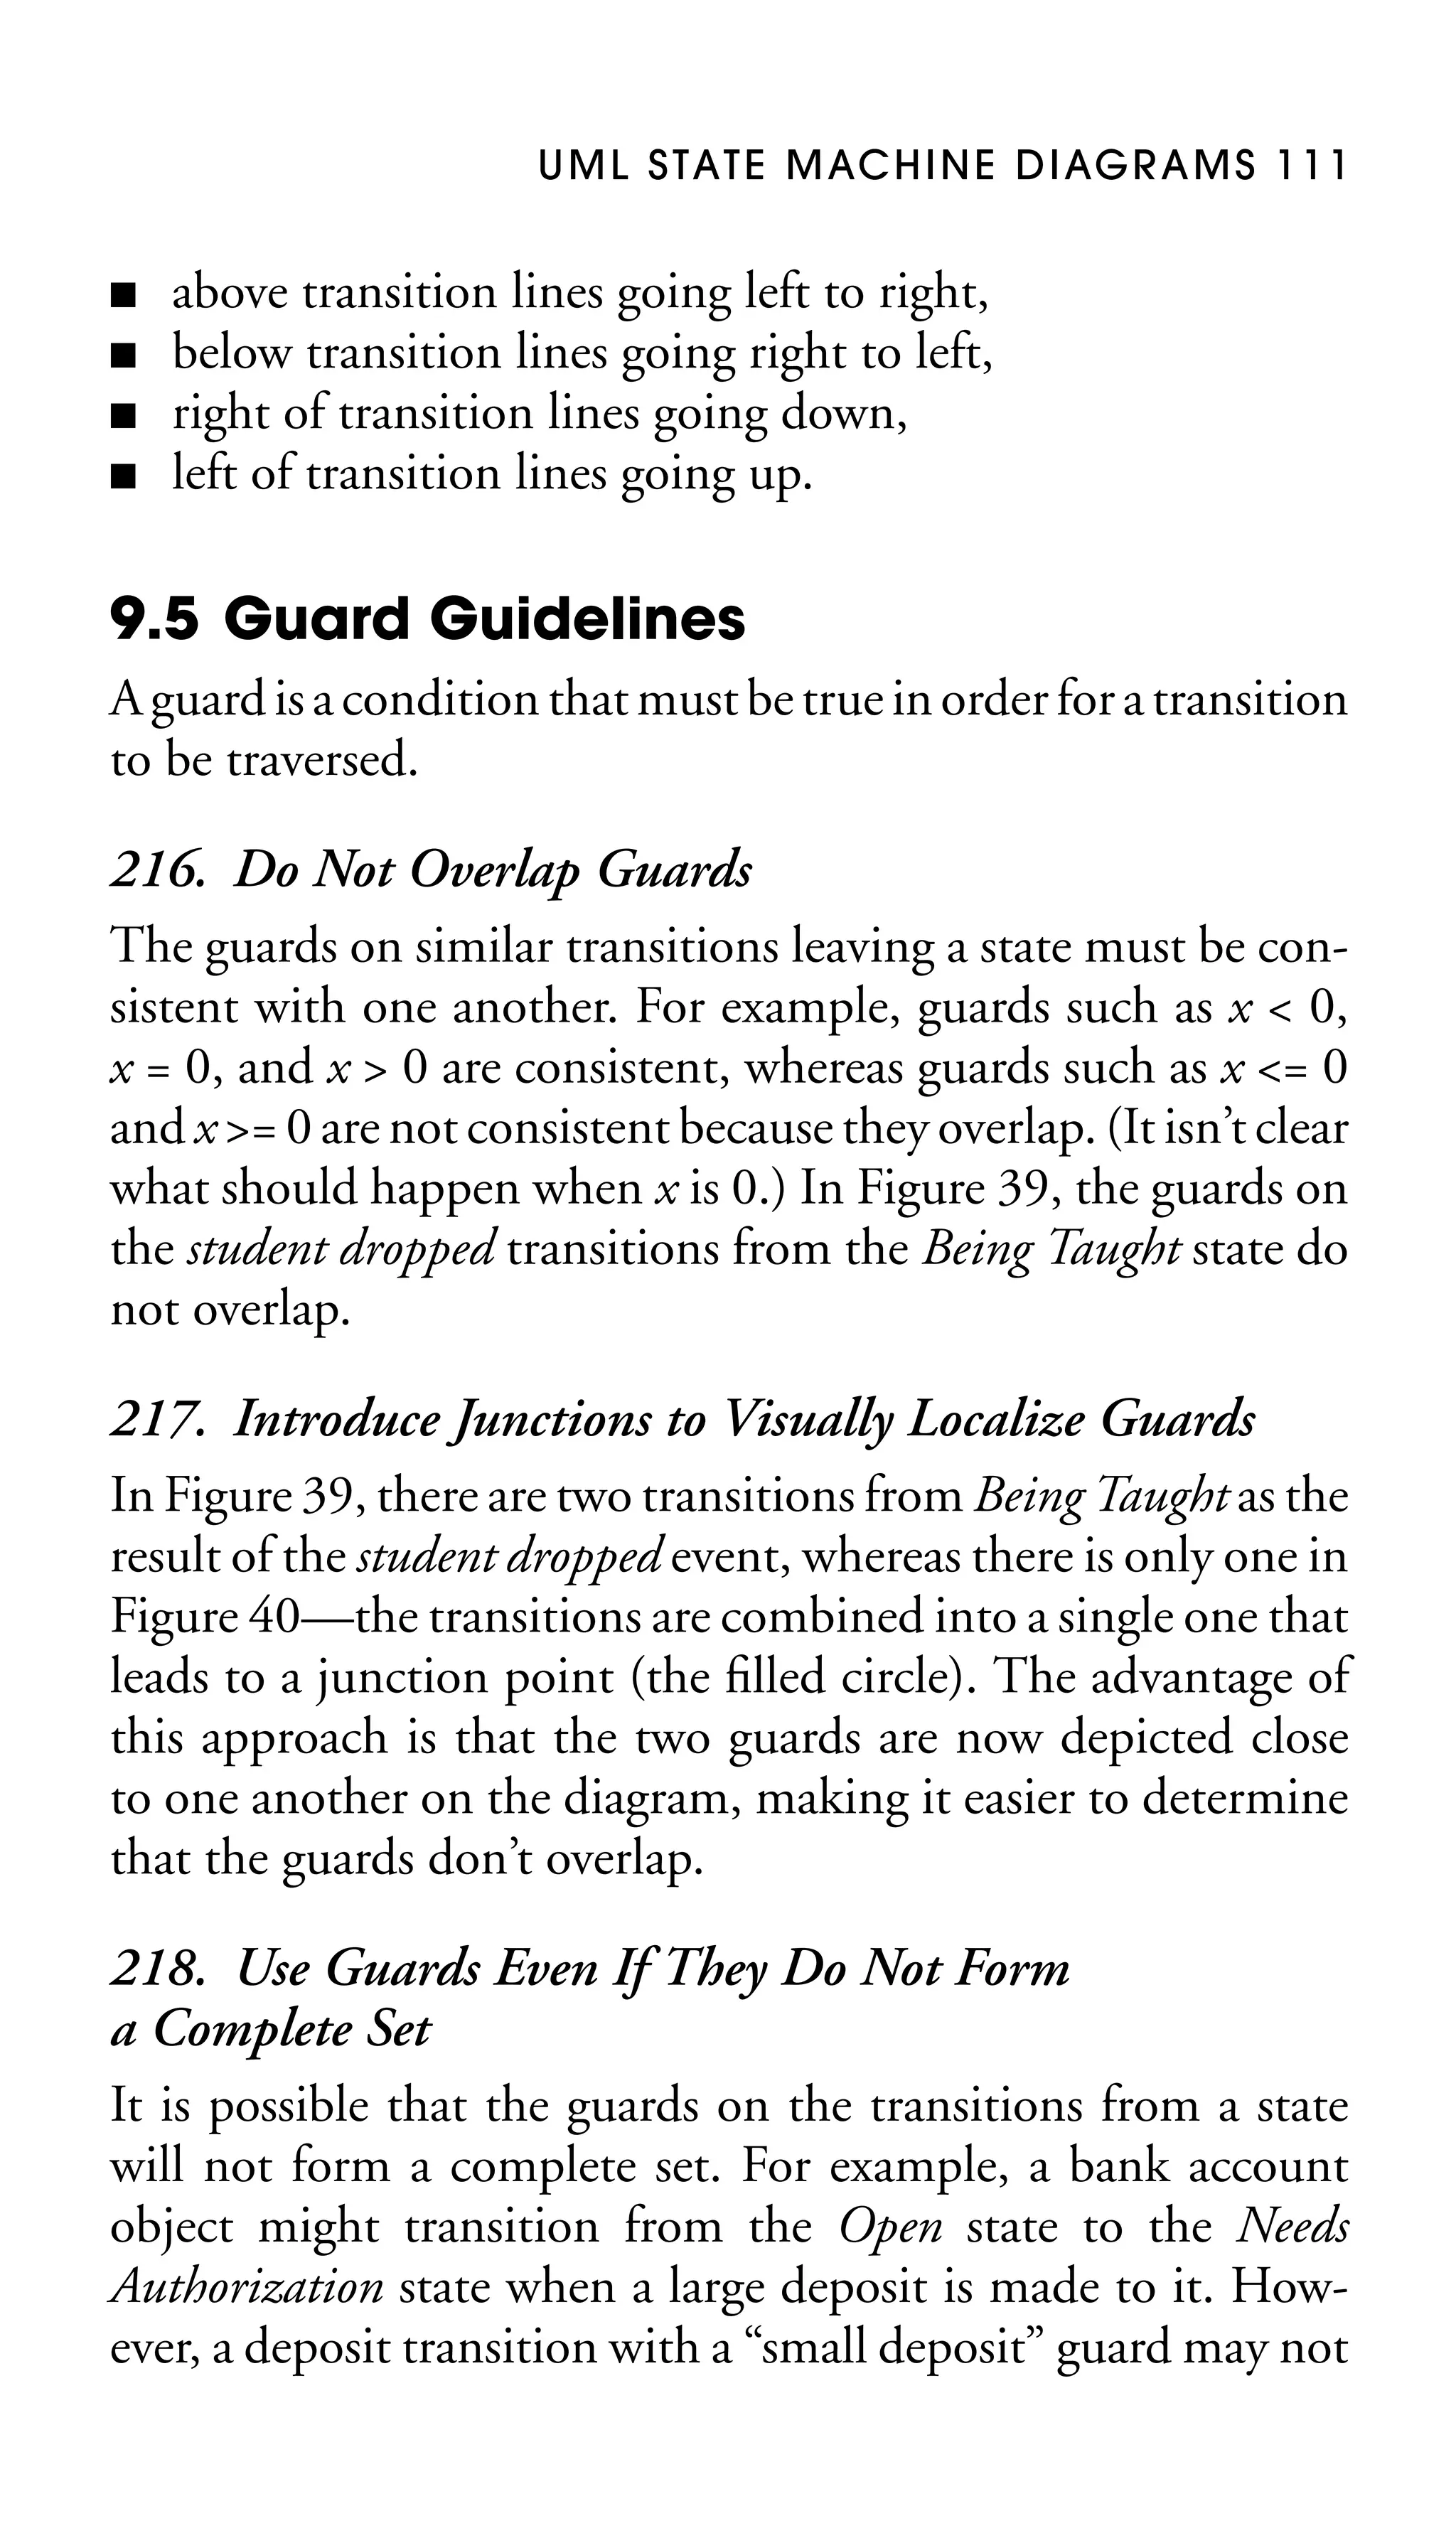
Figure 38. A UML state machine diagram for a seminar during enrollment.
scheduled
student enrolled
[seat available]/
addStudent()](https://image.slidesharecdn.com/2005-050521616786theelementsofuml2style-131128083647-phpapp02/75/the-elements-of-uml-2-style-117-2048.jpg)
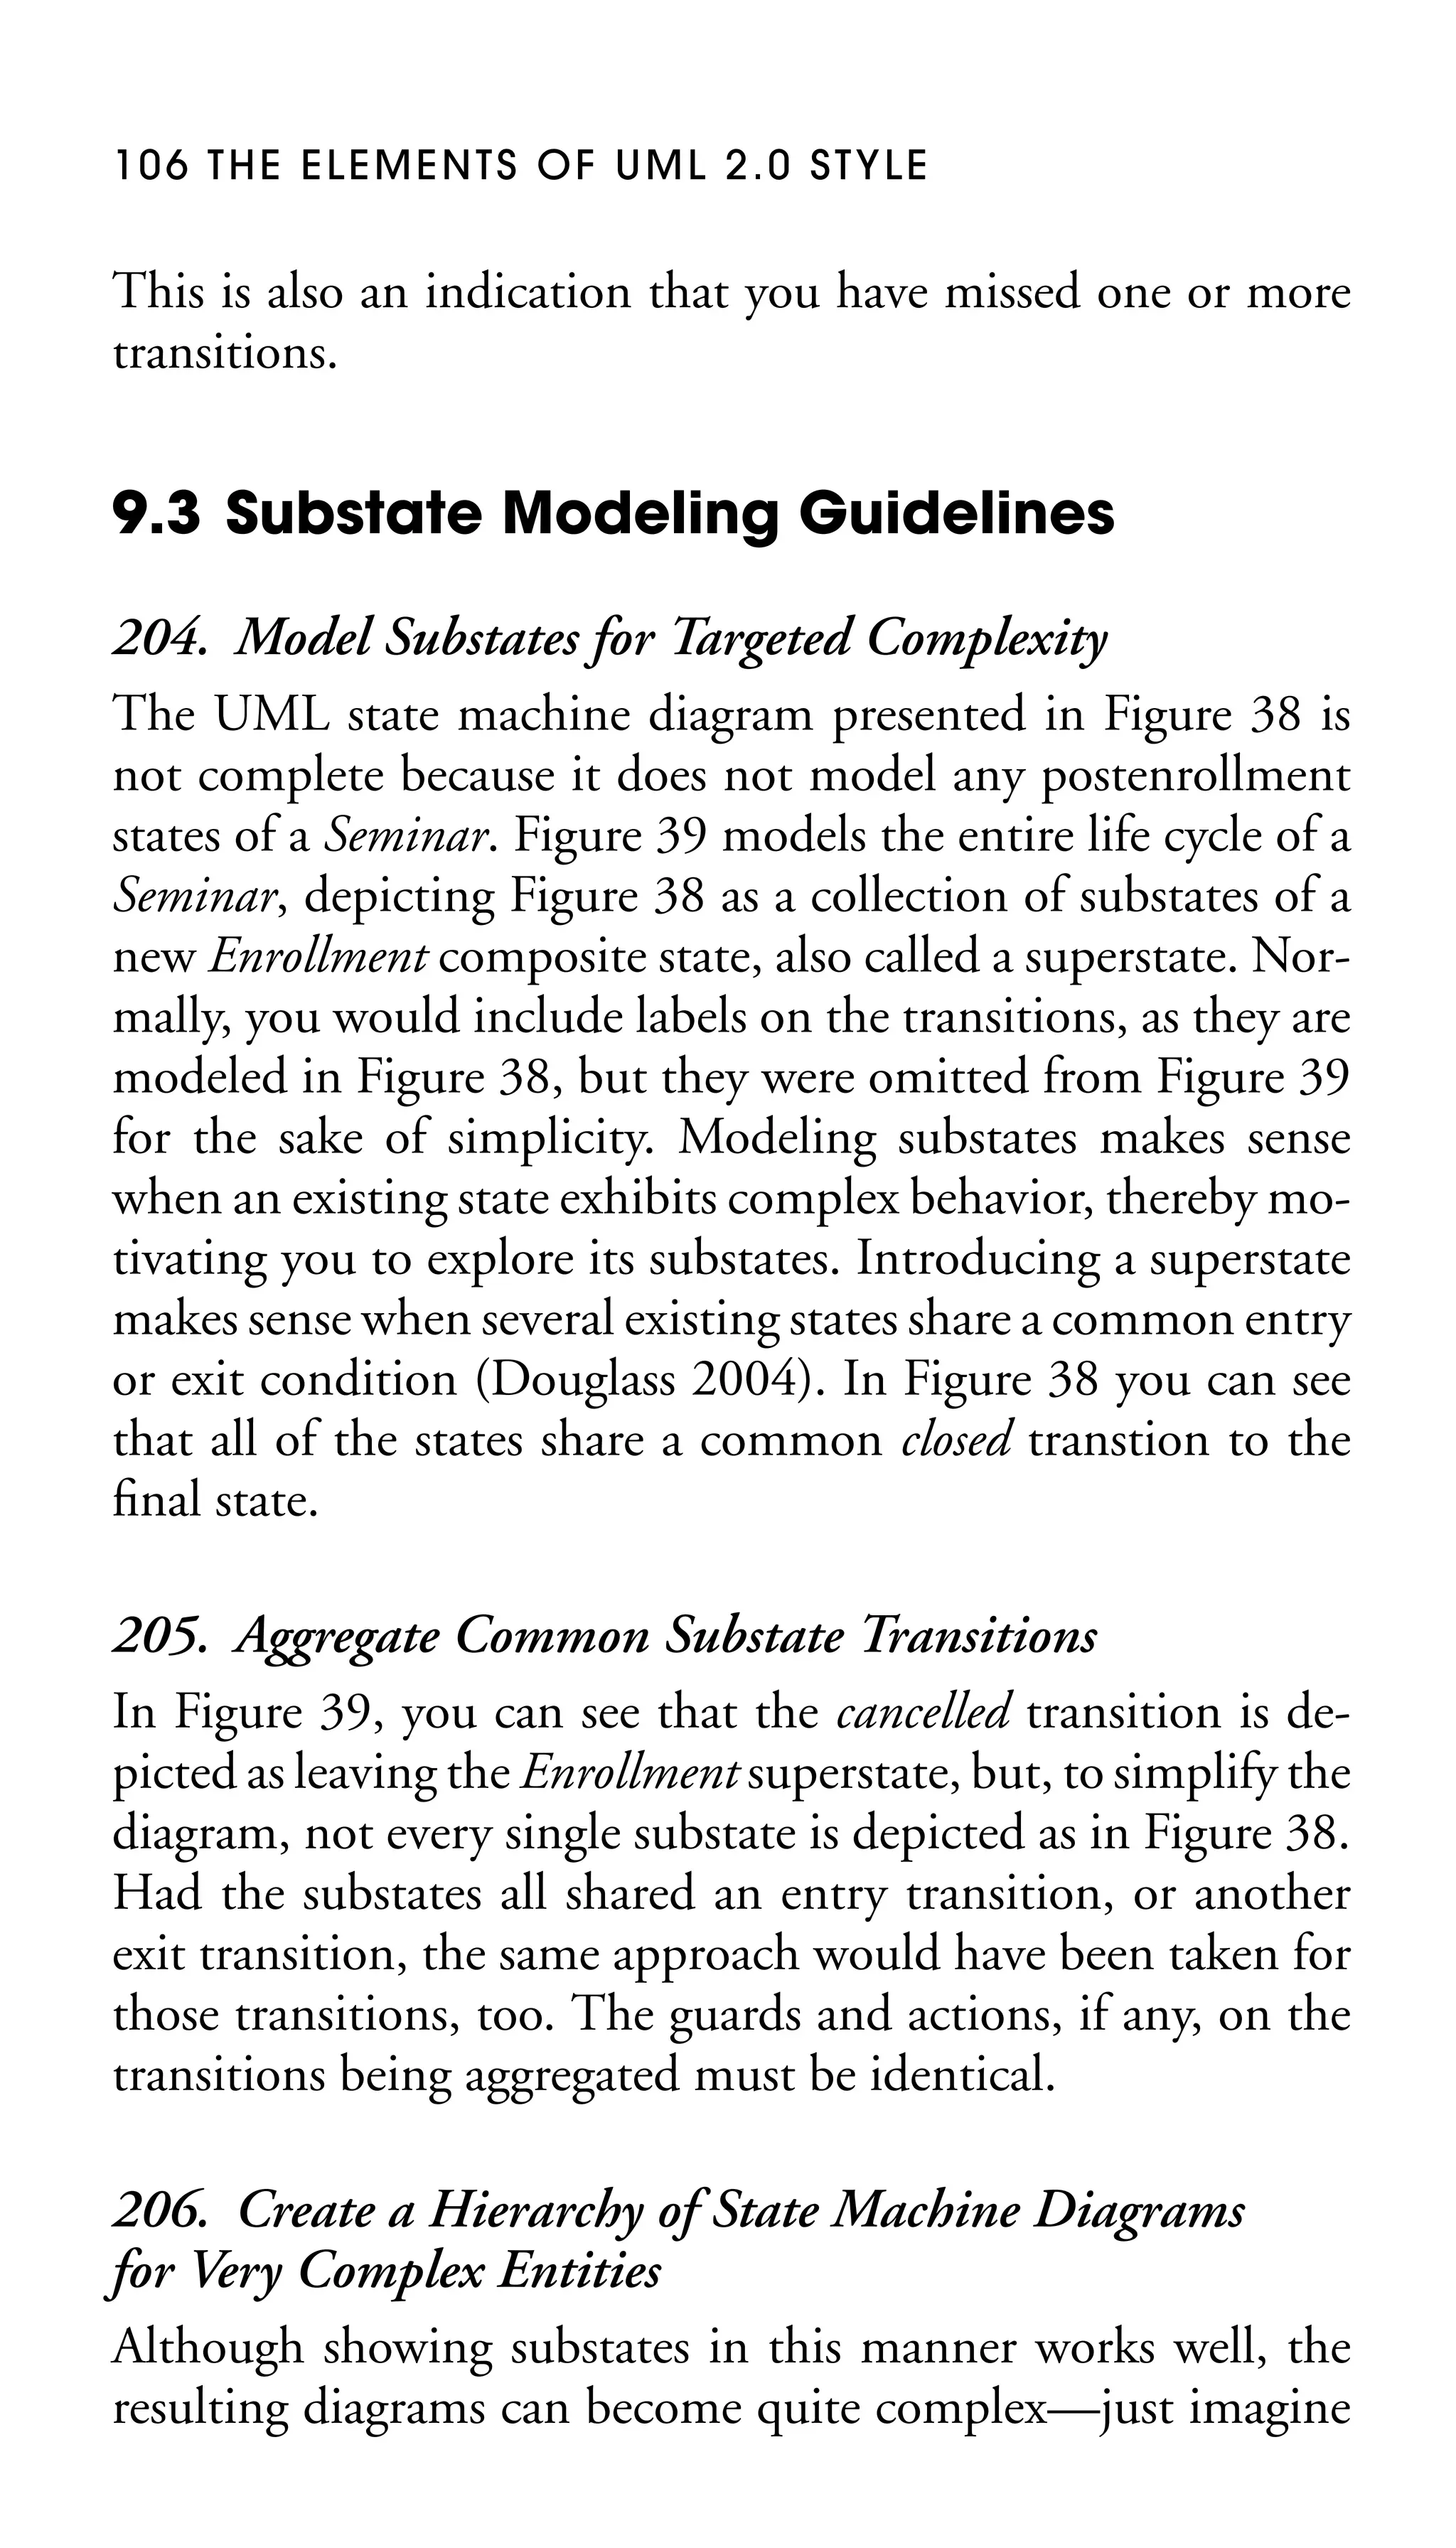
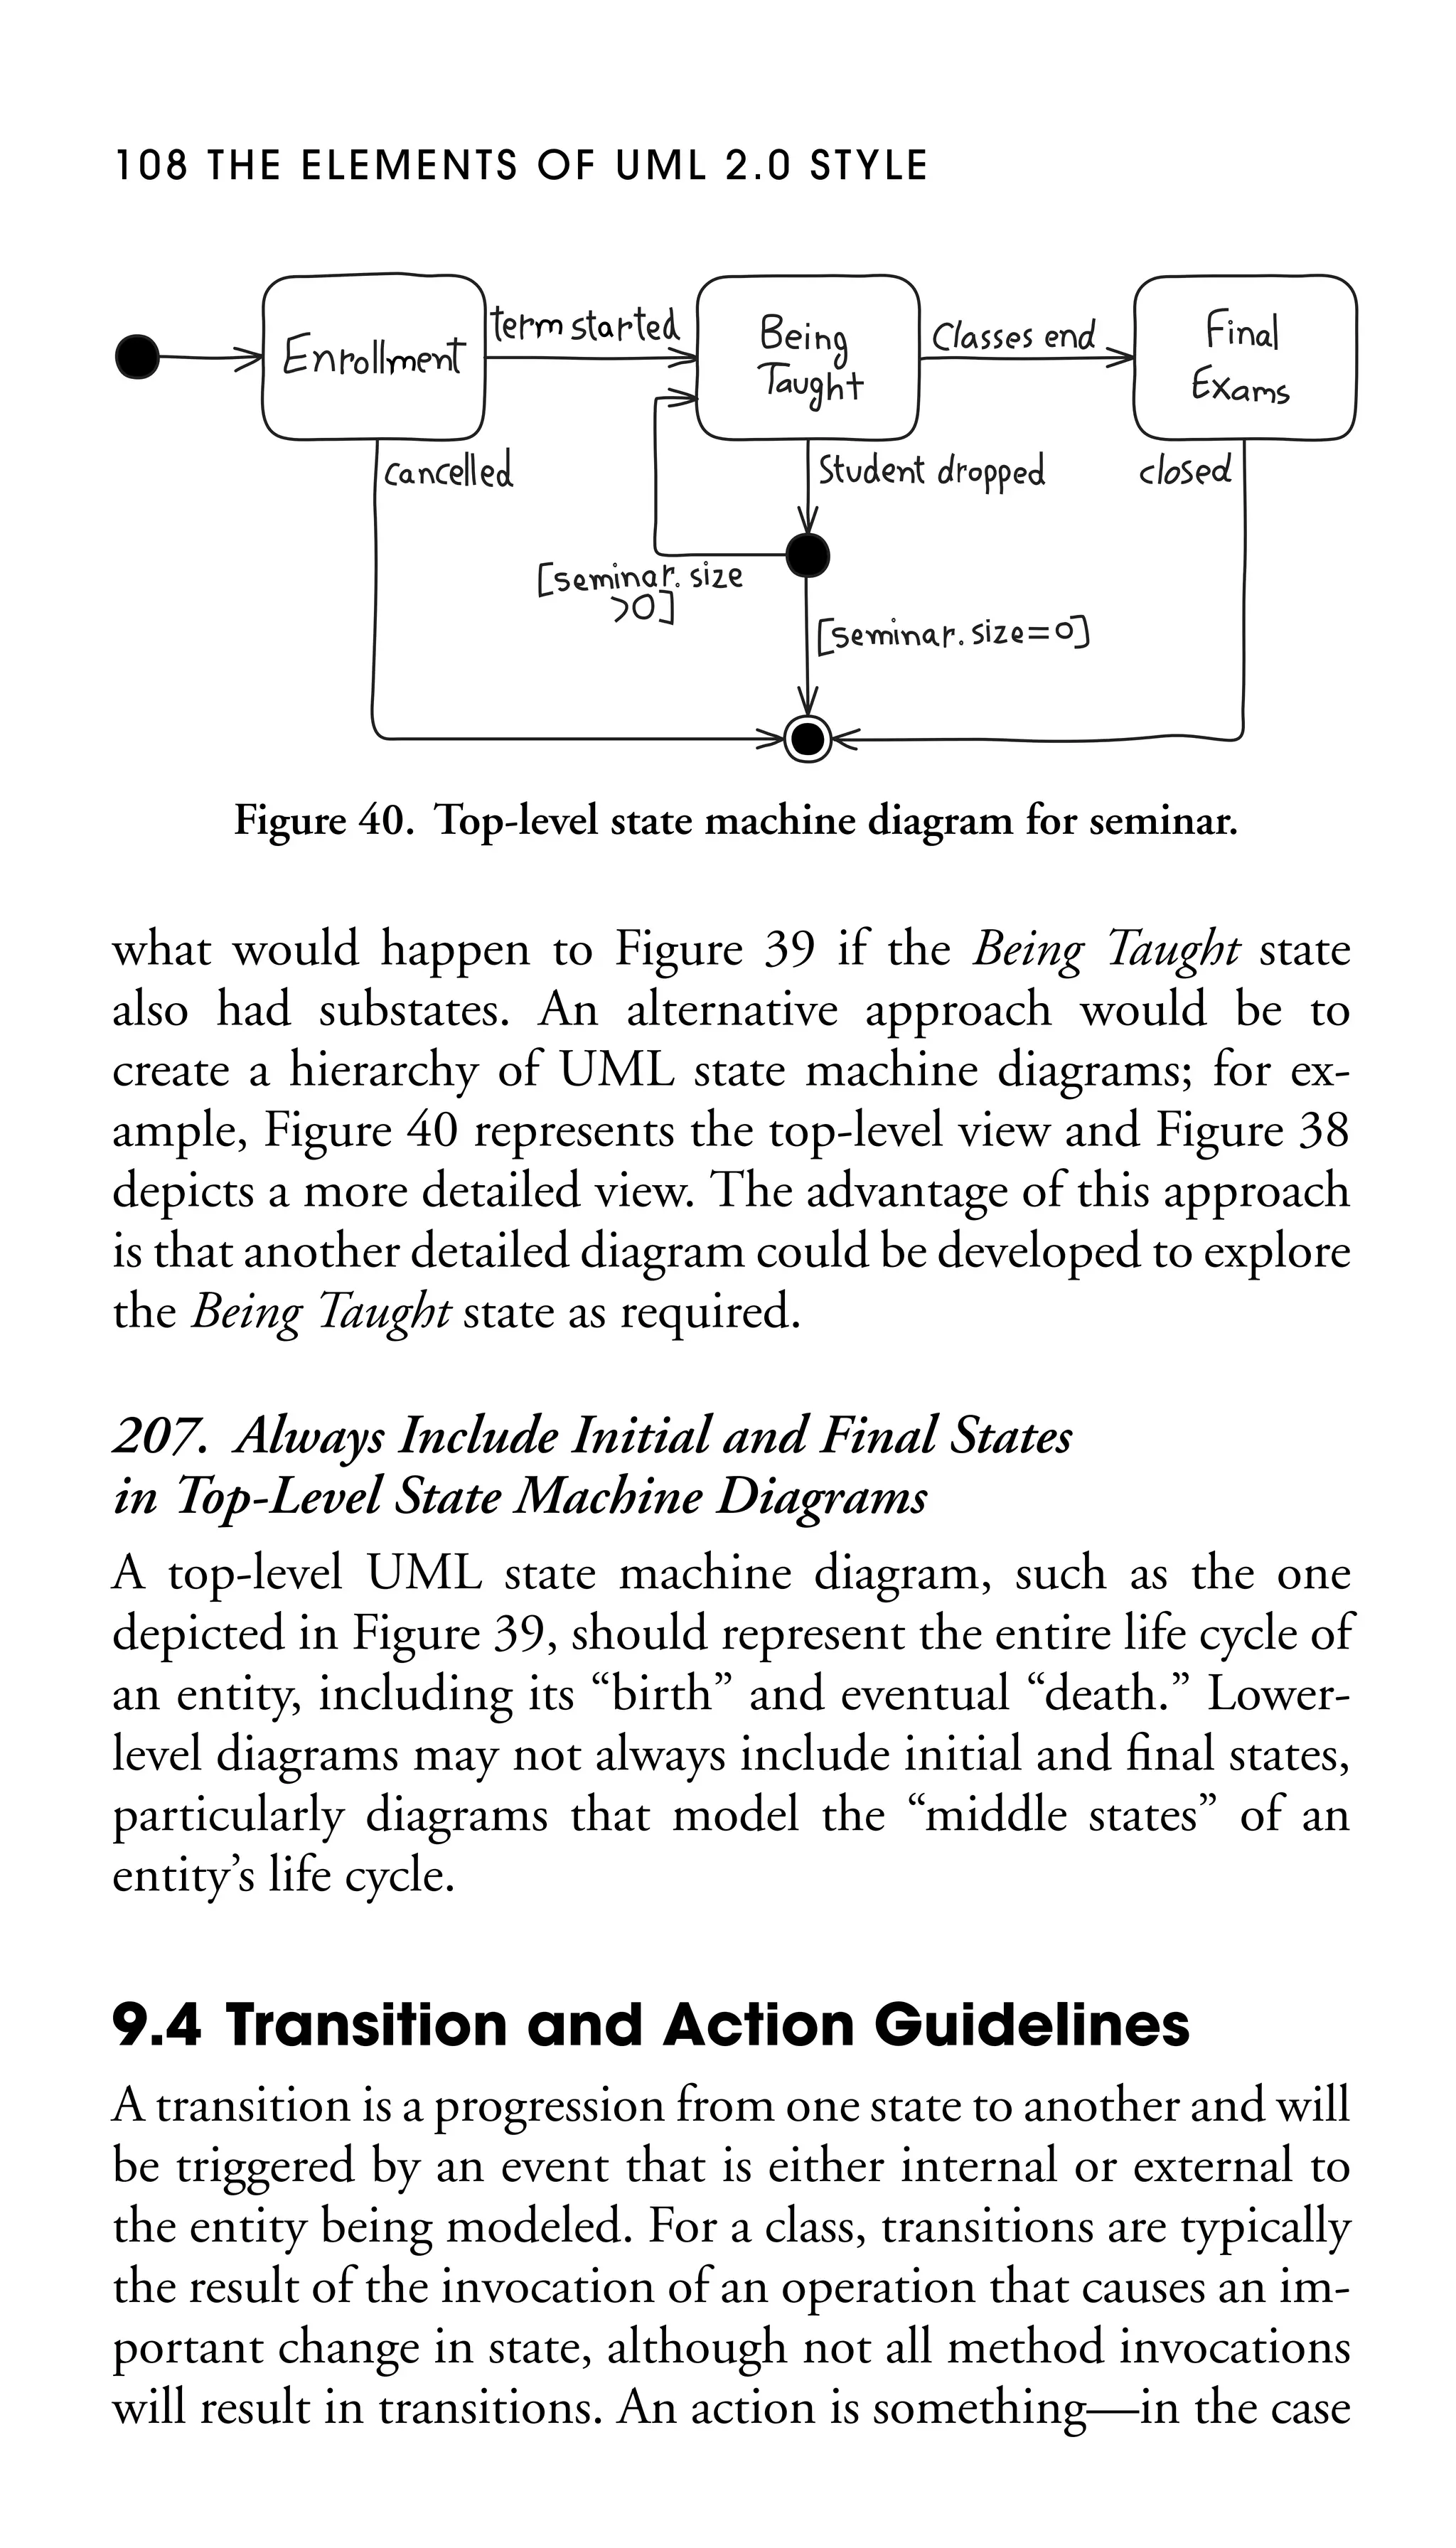
![107
Scheduled
Proposed
Enrollment
cancelled
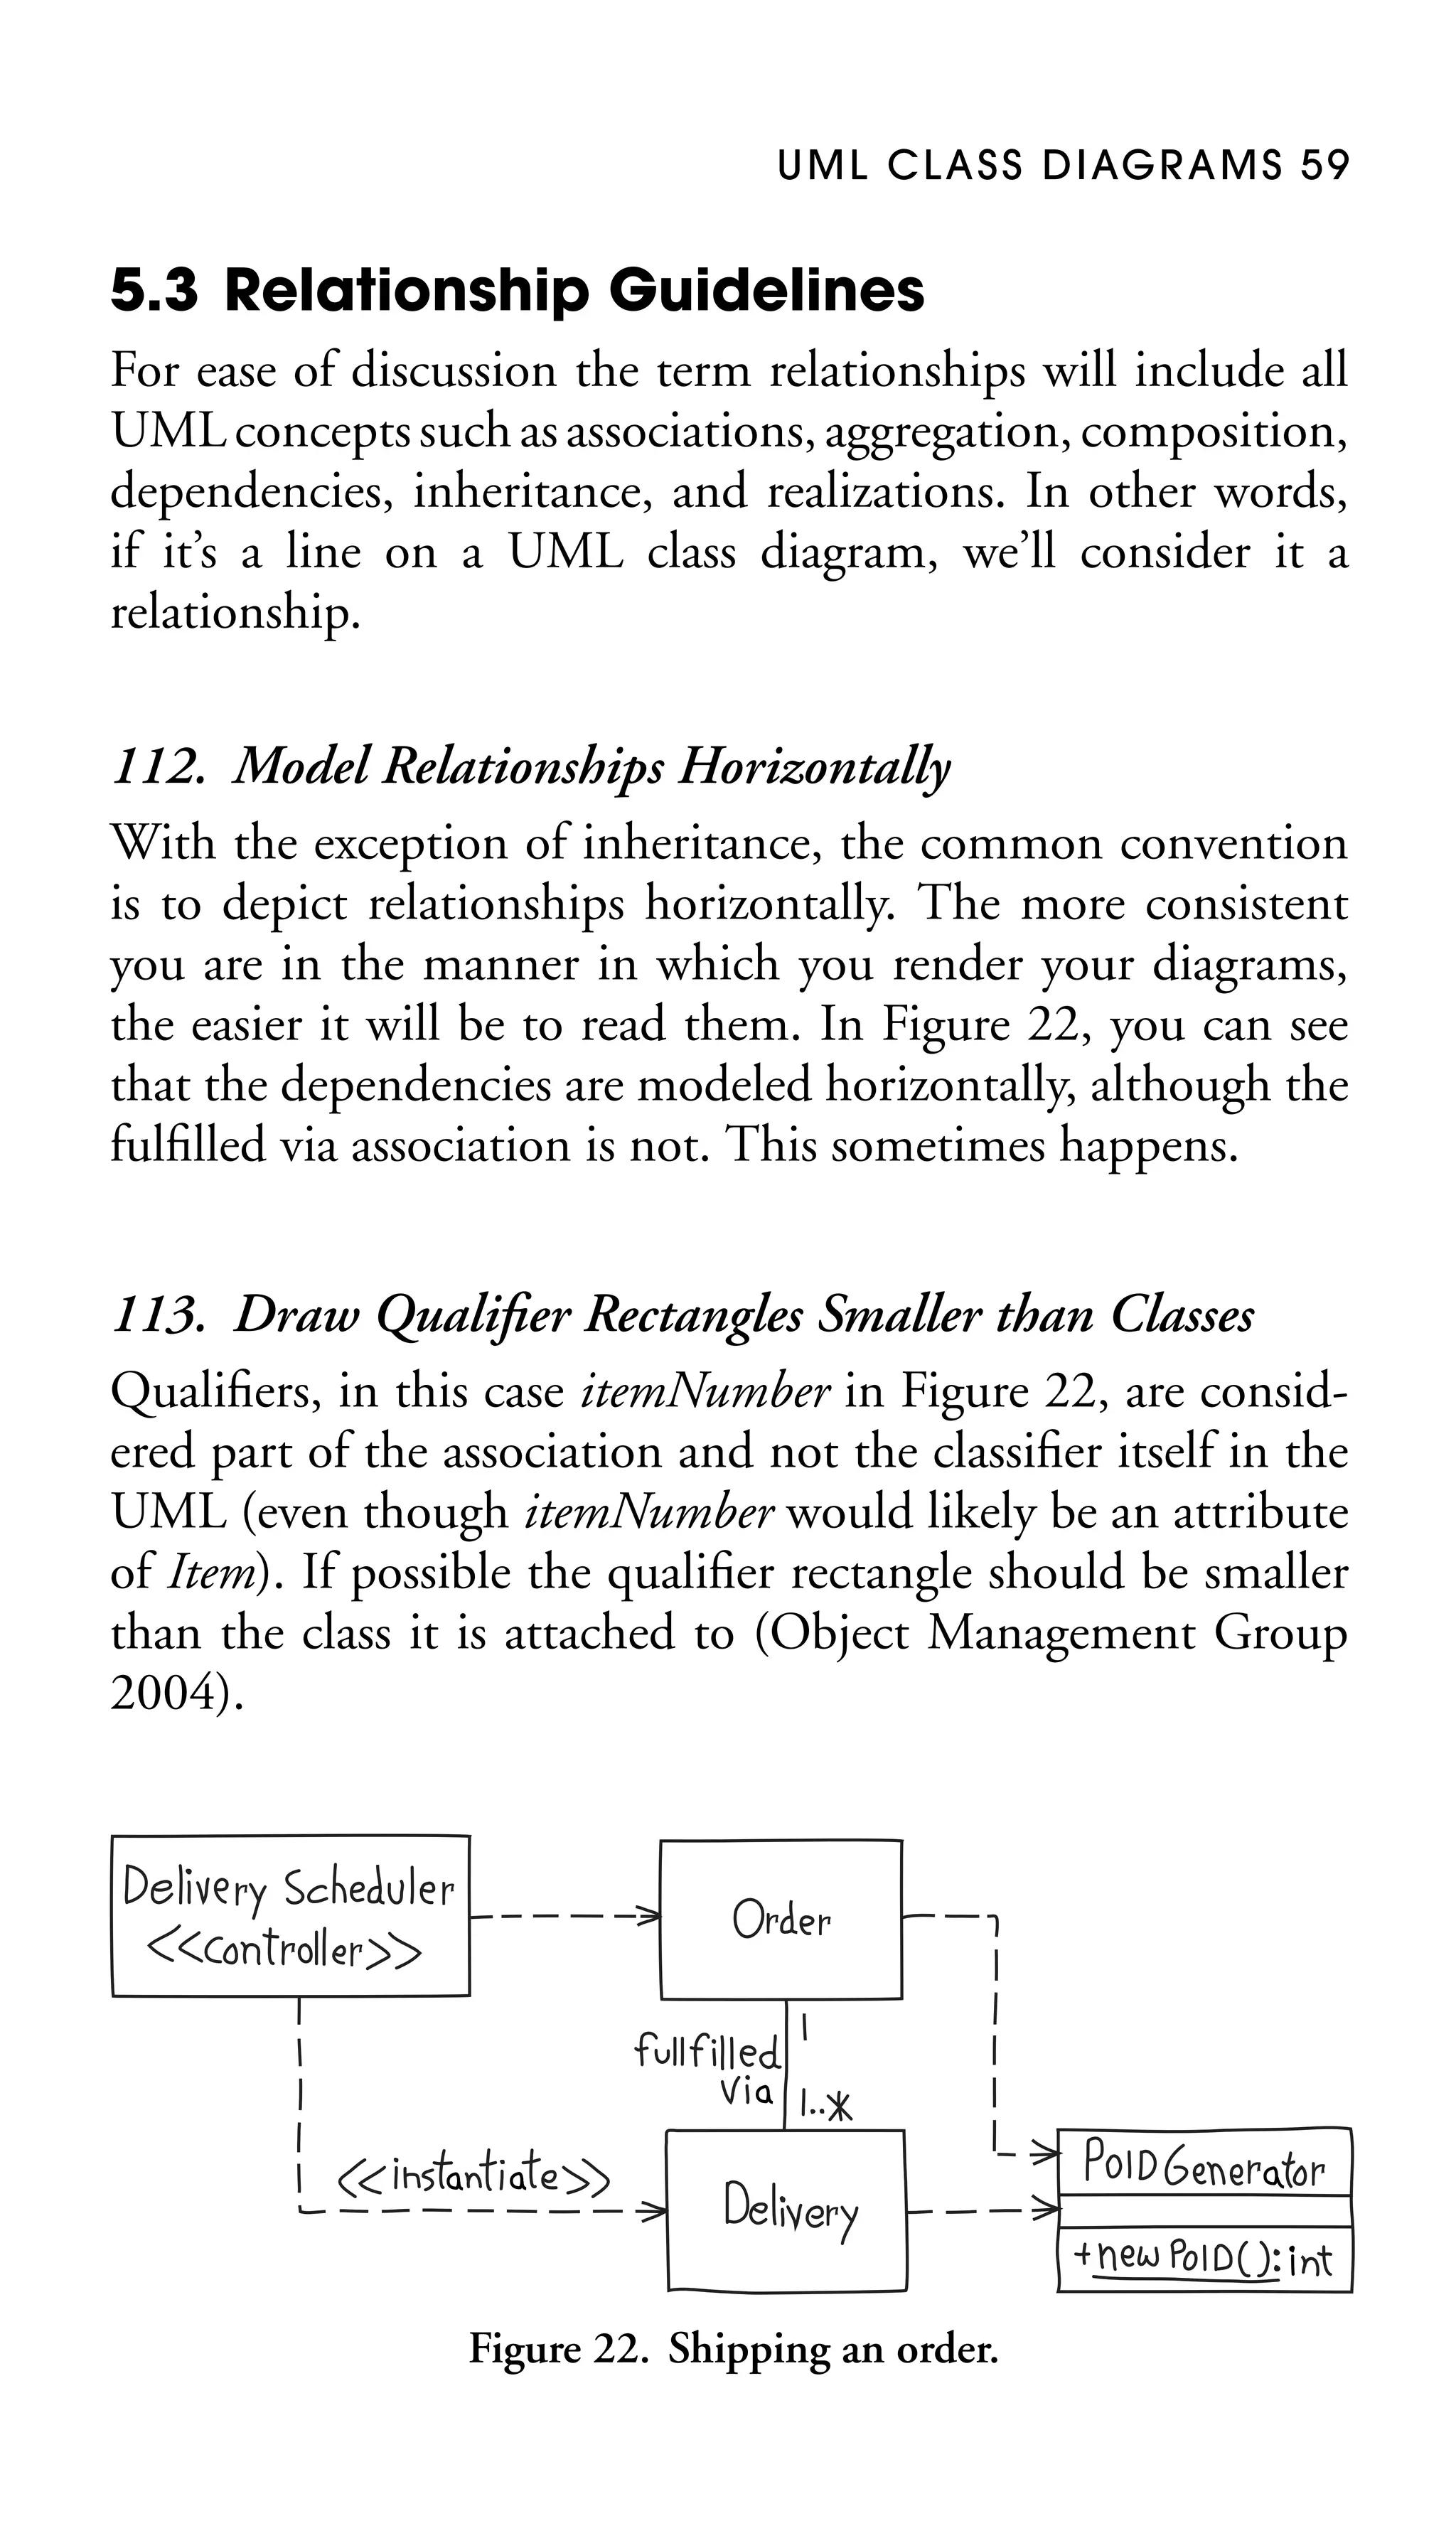
Closed to
Enrollment
term
started
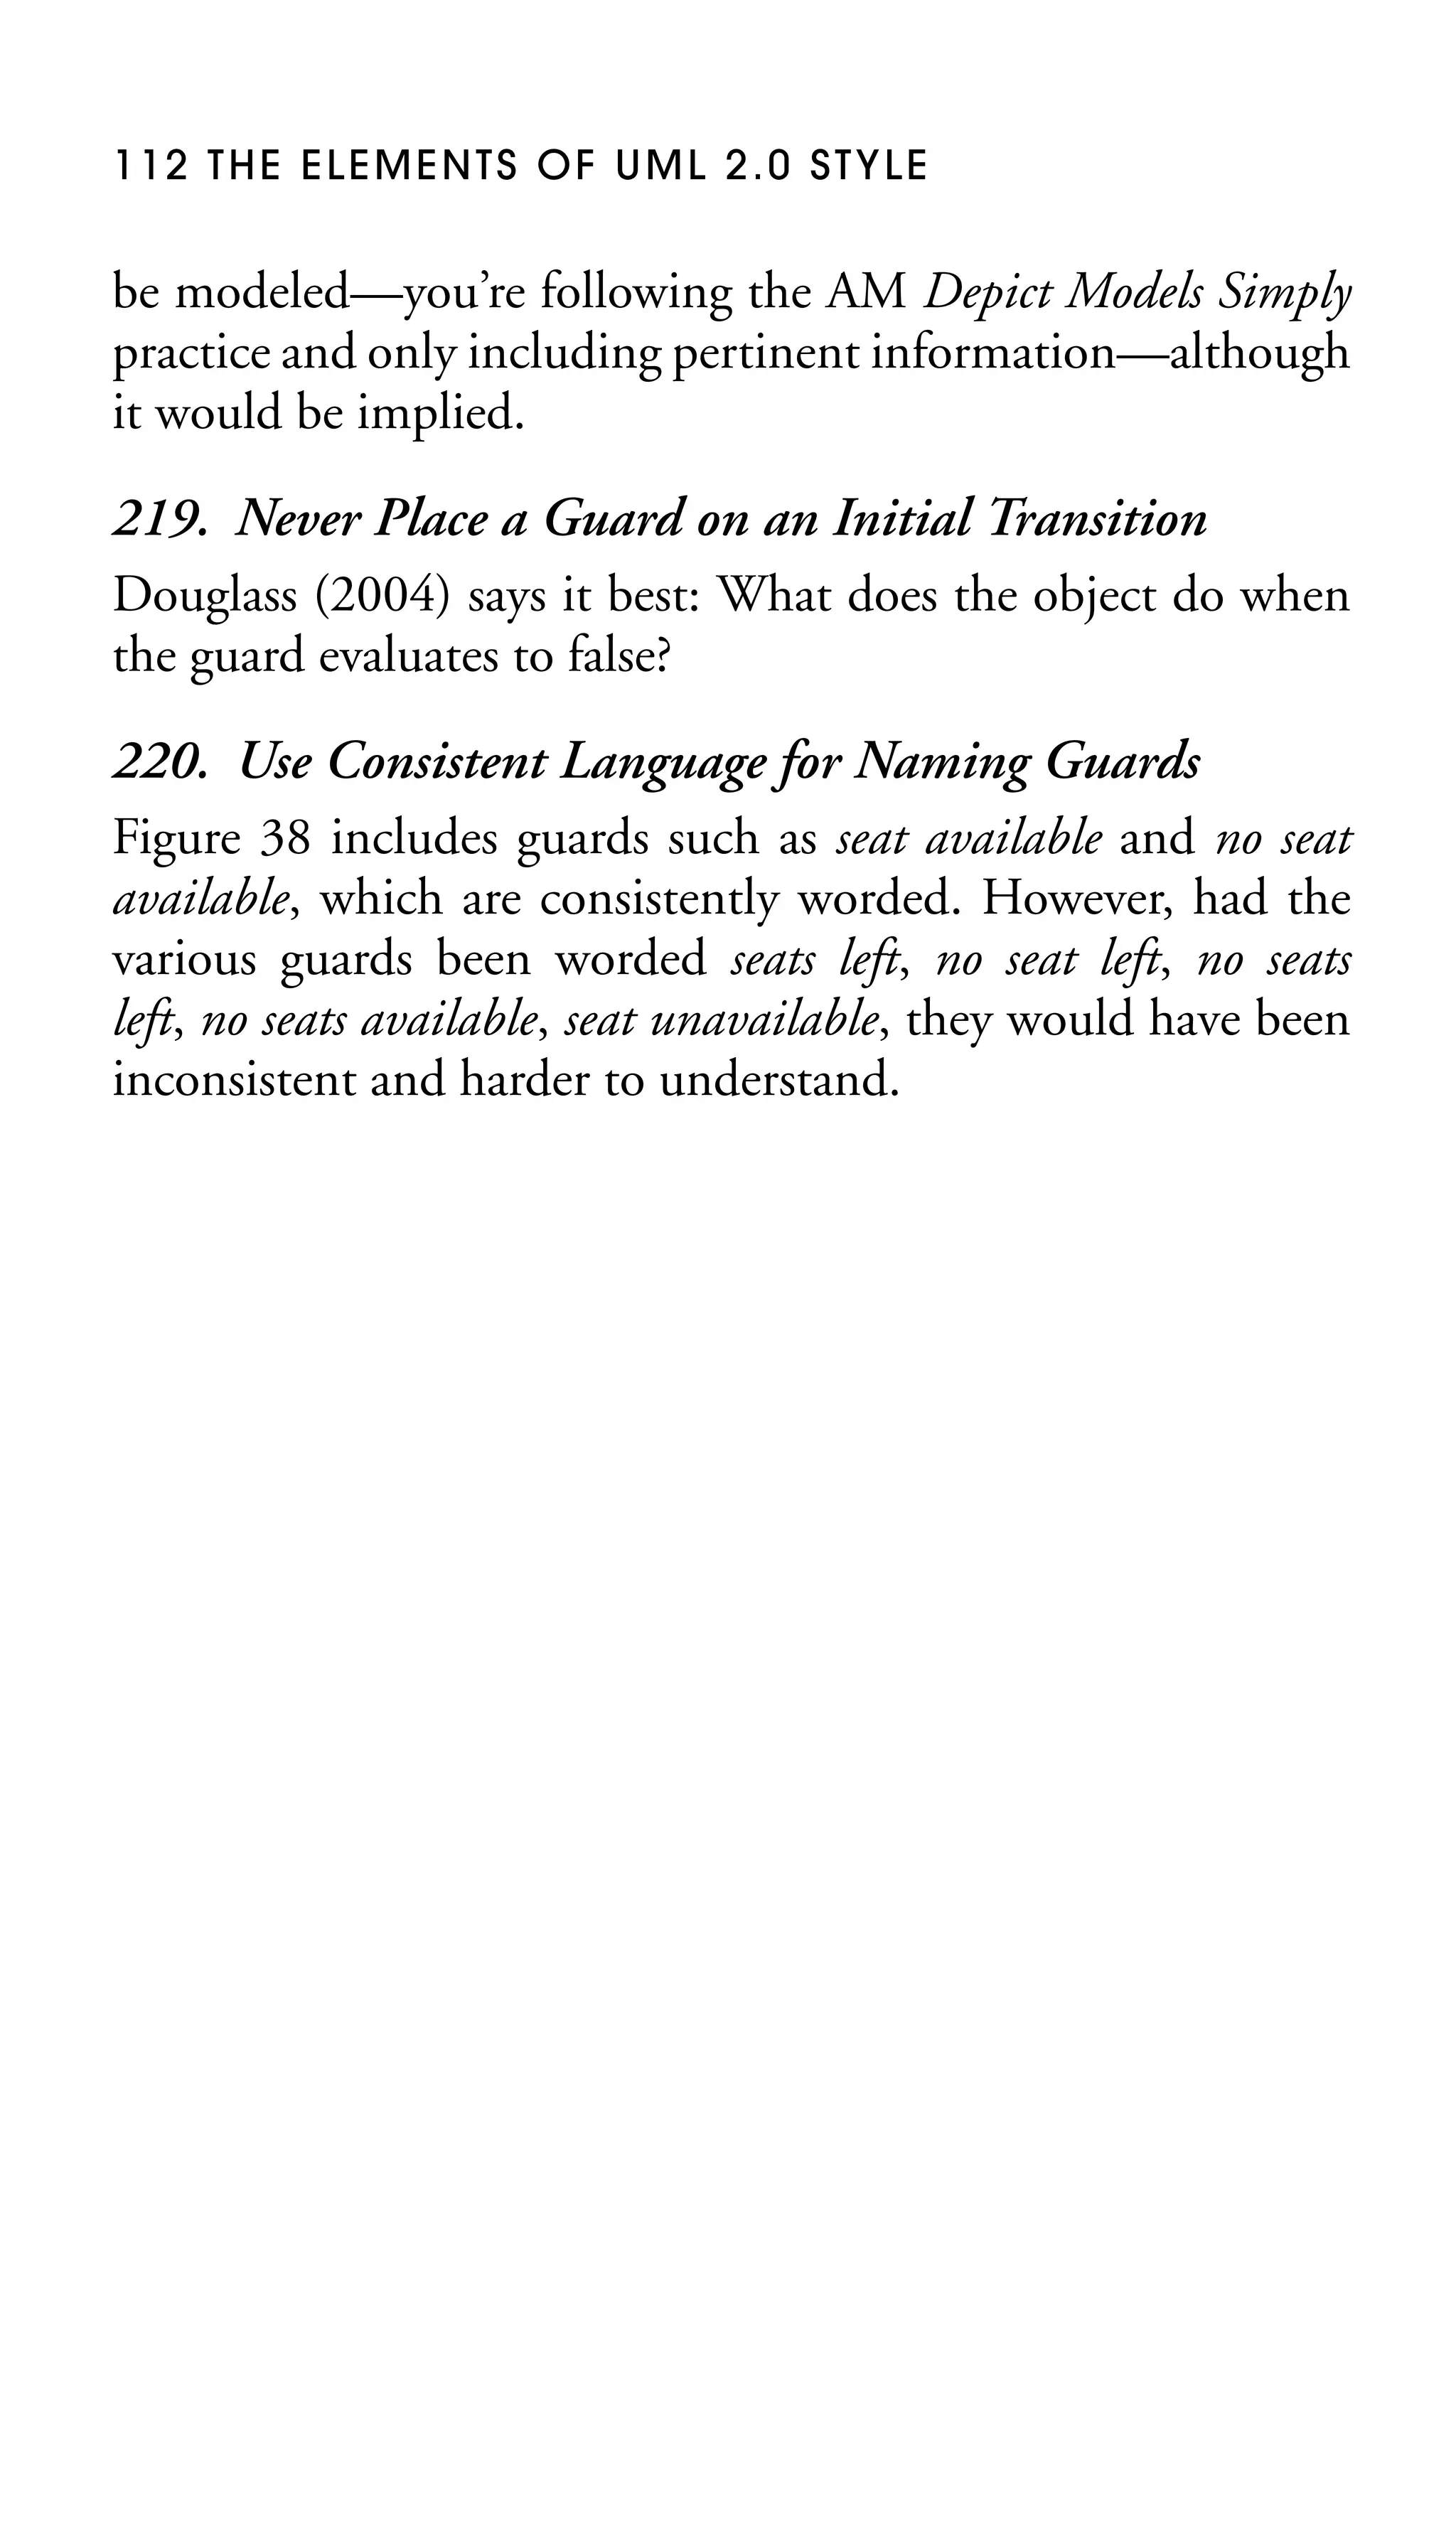
Figure 39. Complete life cycle of a seminar.
Full
Open For
Enrollment
classes
end
student dropped
[seminar size = 0]
Being
Taught
student dropped
[seminar size > 0]
closed
Final
Exams](https://image.slidesharecdn.com/2005-050521616786theelementsofuml2style-131128083647-phpapp02/75/the-elements-of-uml-2-style-120-2048.jpg)
![114
Enroll in University
[correct]
Fill Out Enrollment
Forms
1
[help available]
Enroll In
Seminar(s)
1
AD #: 007
Enrolling in the
University for the first
time
Make Initial Tuition
Payment
Attend University
Overview
Presentation
Obtain Help to Fill
Out Forms
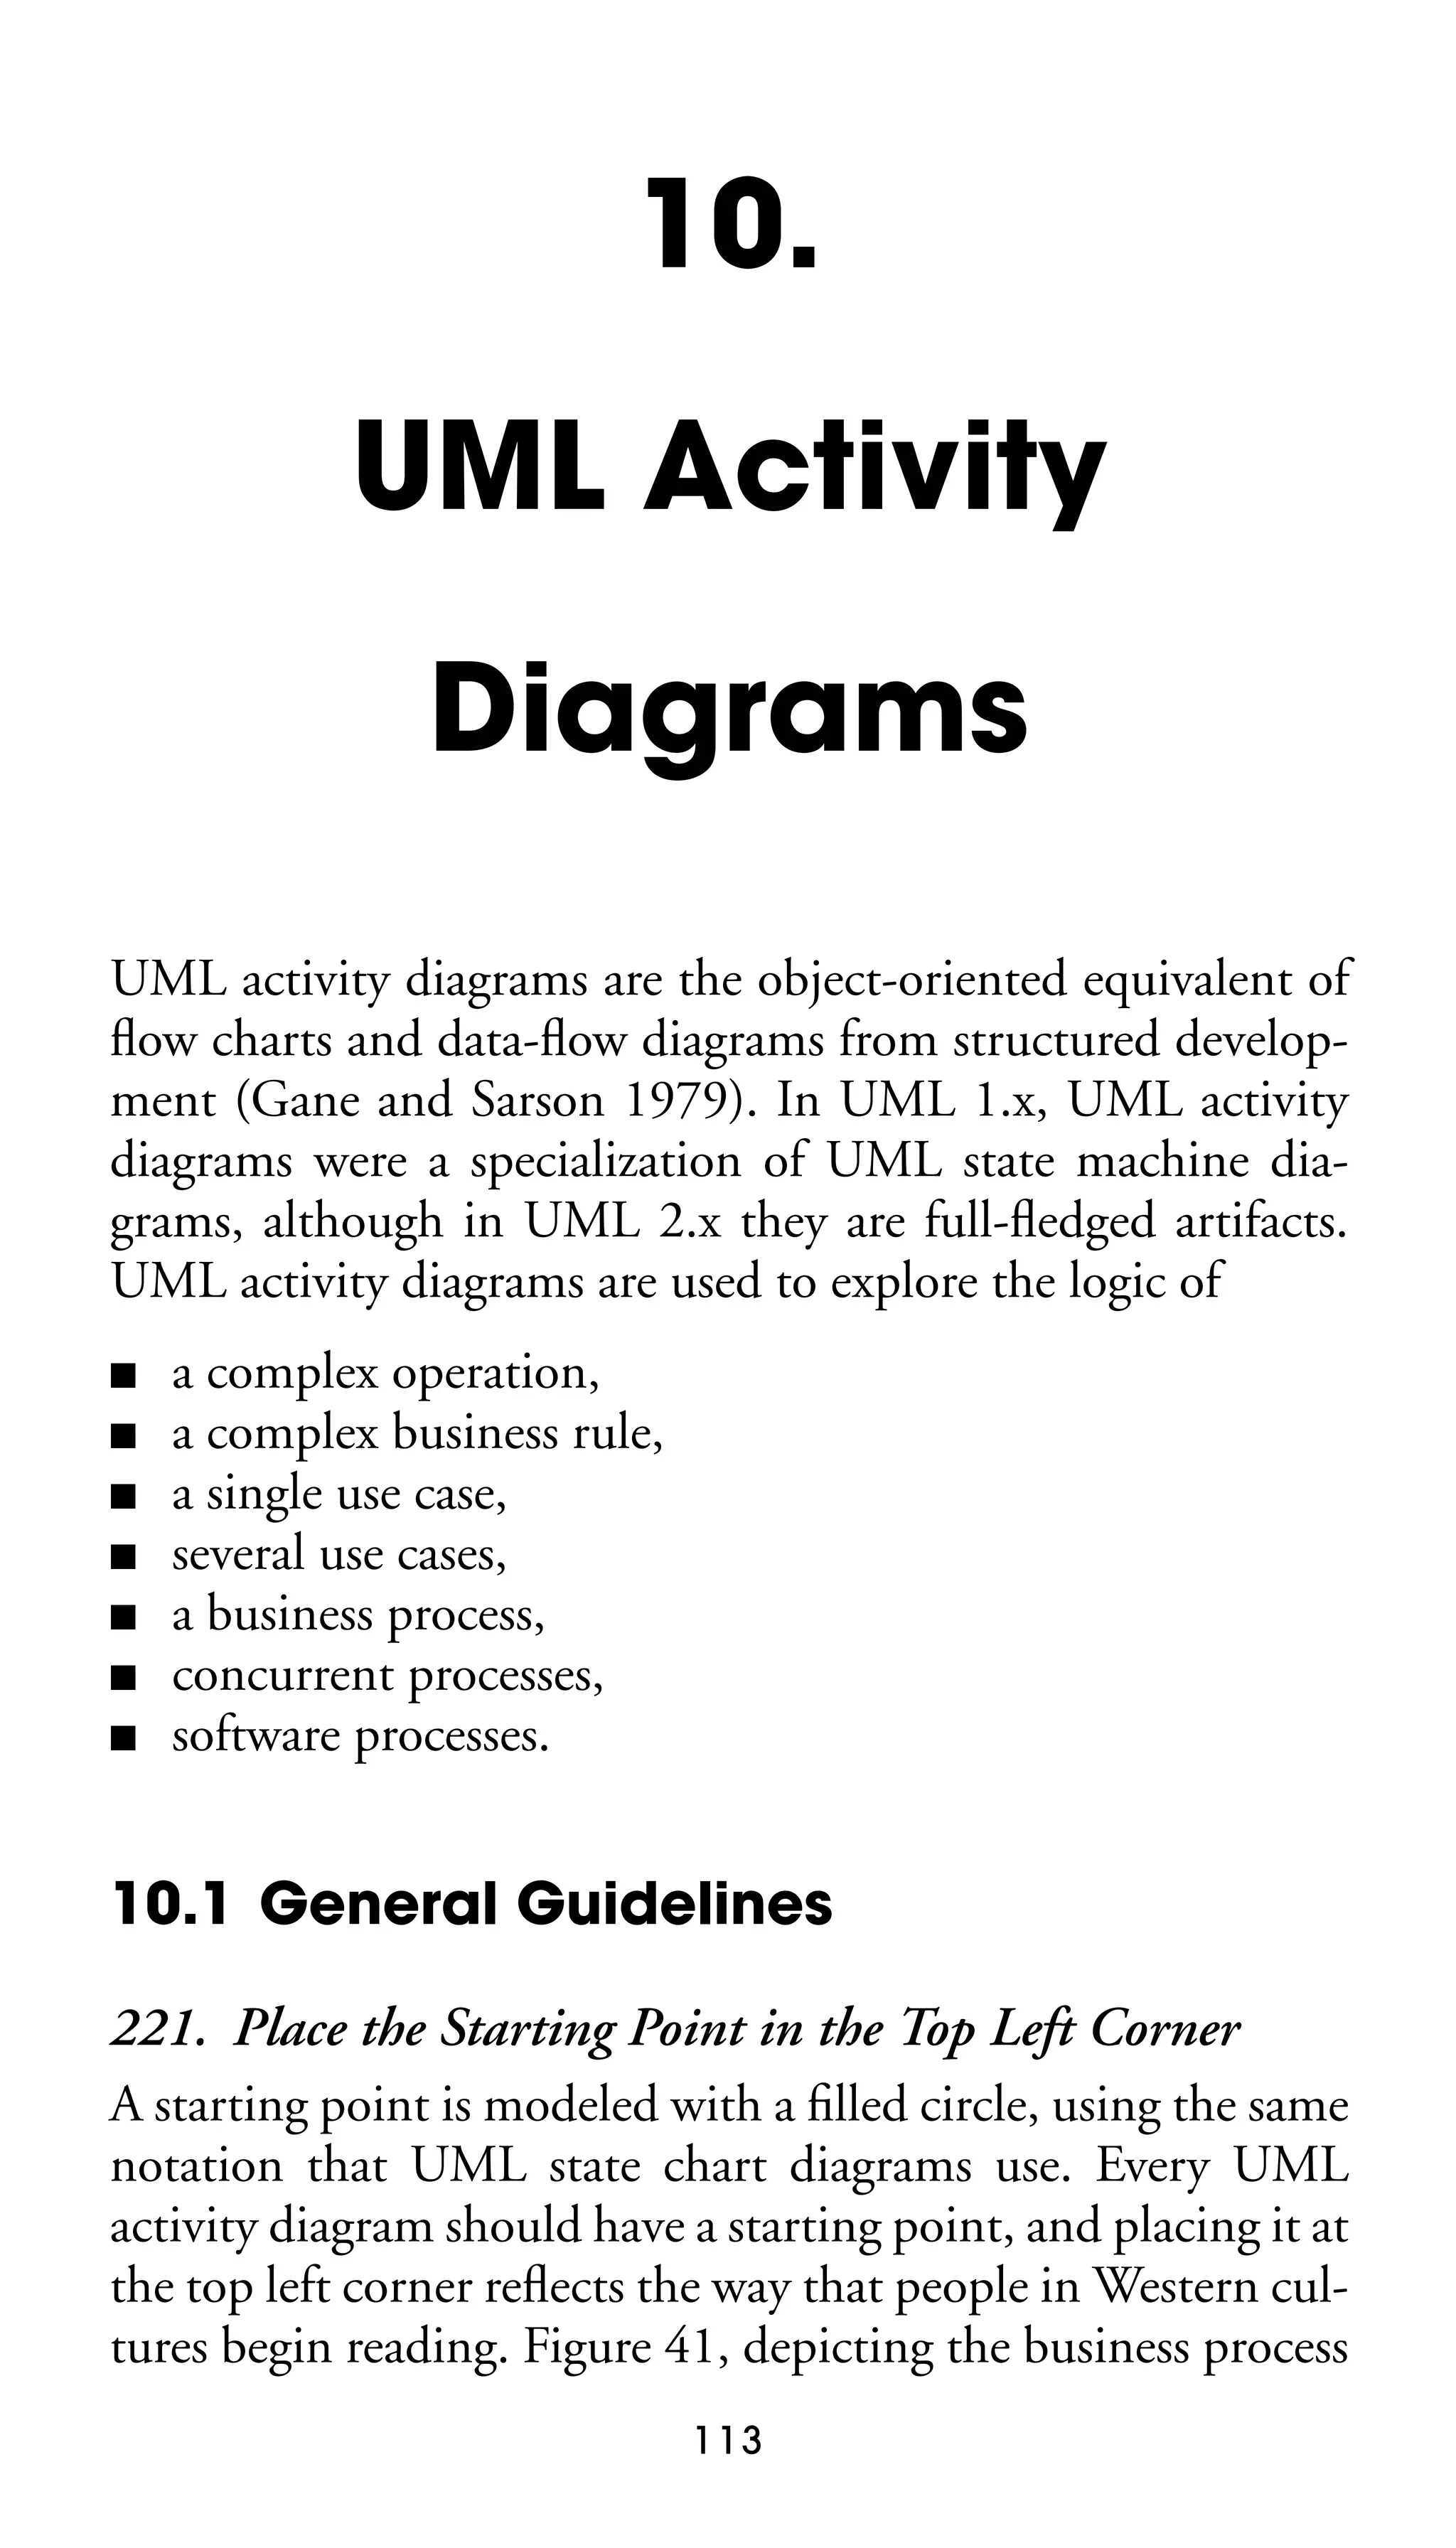
Figure 41. Modeling a business process with a UML activity diagram.
[trivial
problems]
[incorrect]
[otherwise]](https://image.slidesharecdn.com/2005-050521616786theelementsofuml2style-131128083647-phpapp02/75/the-elements-of-uml-2-style-127-2048.jpg)
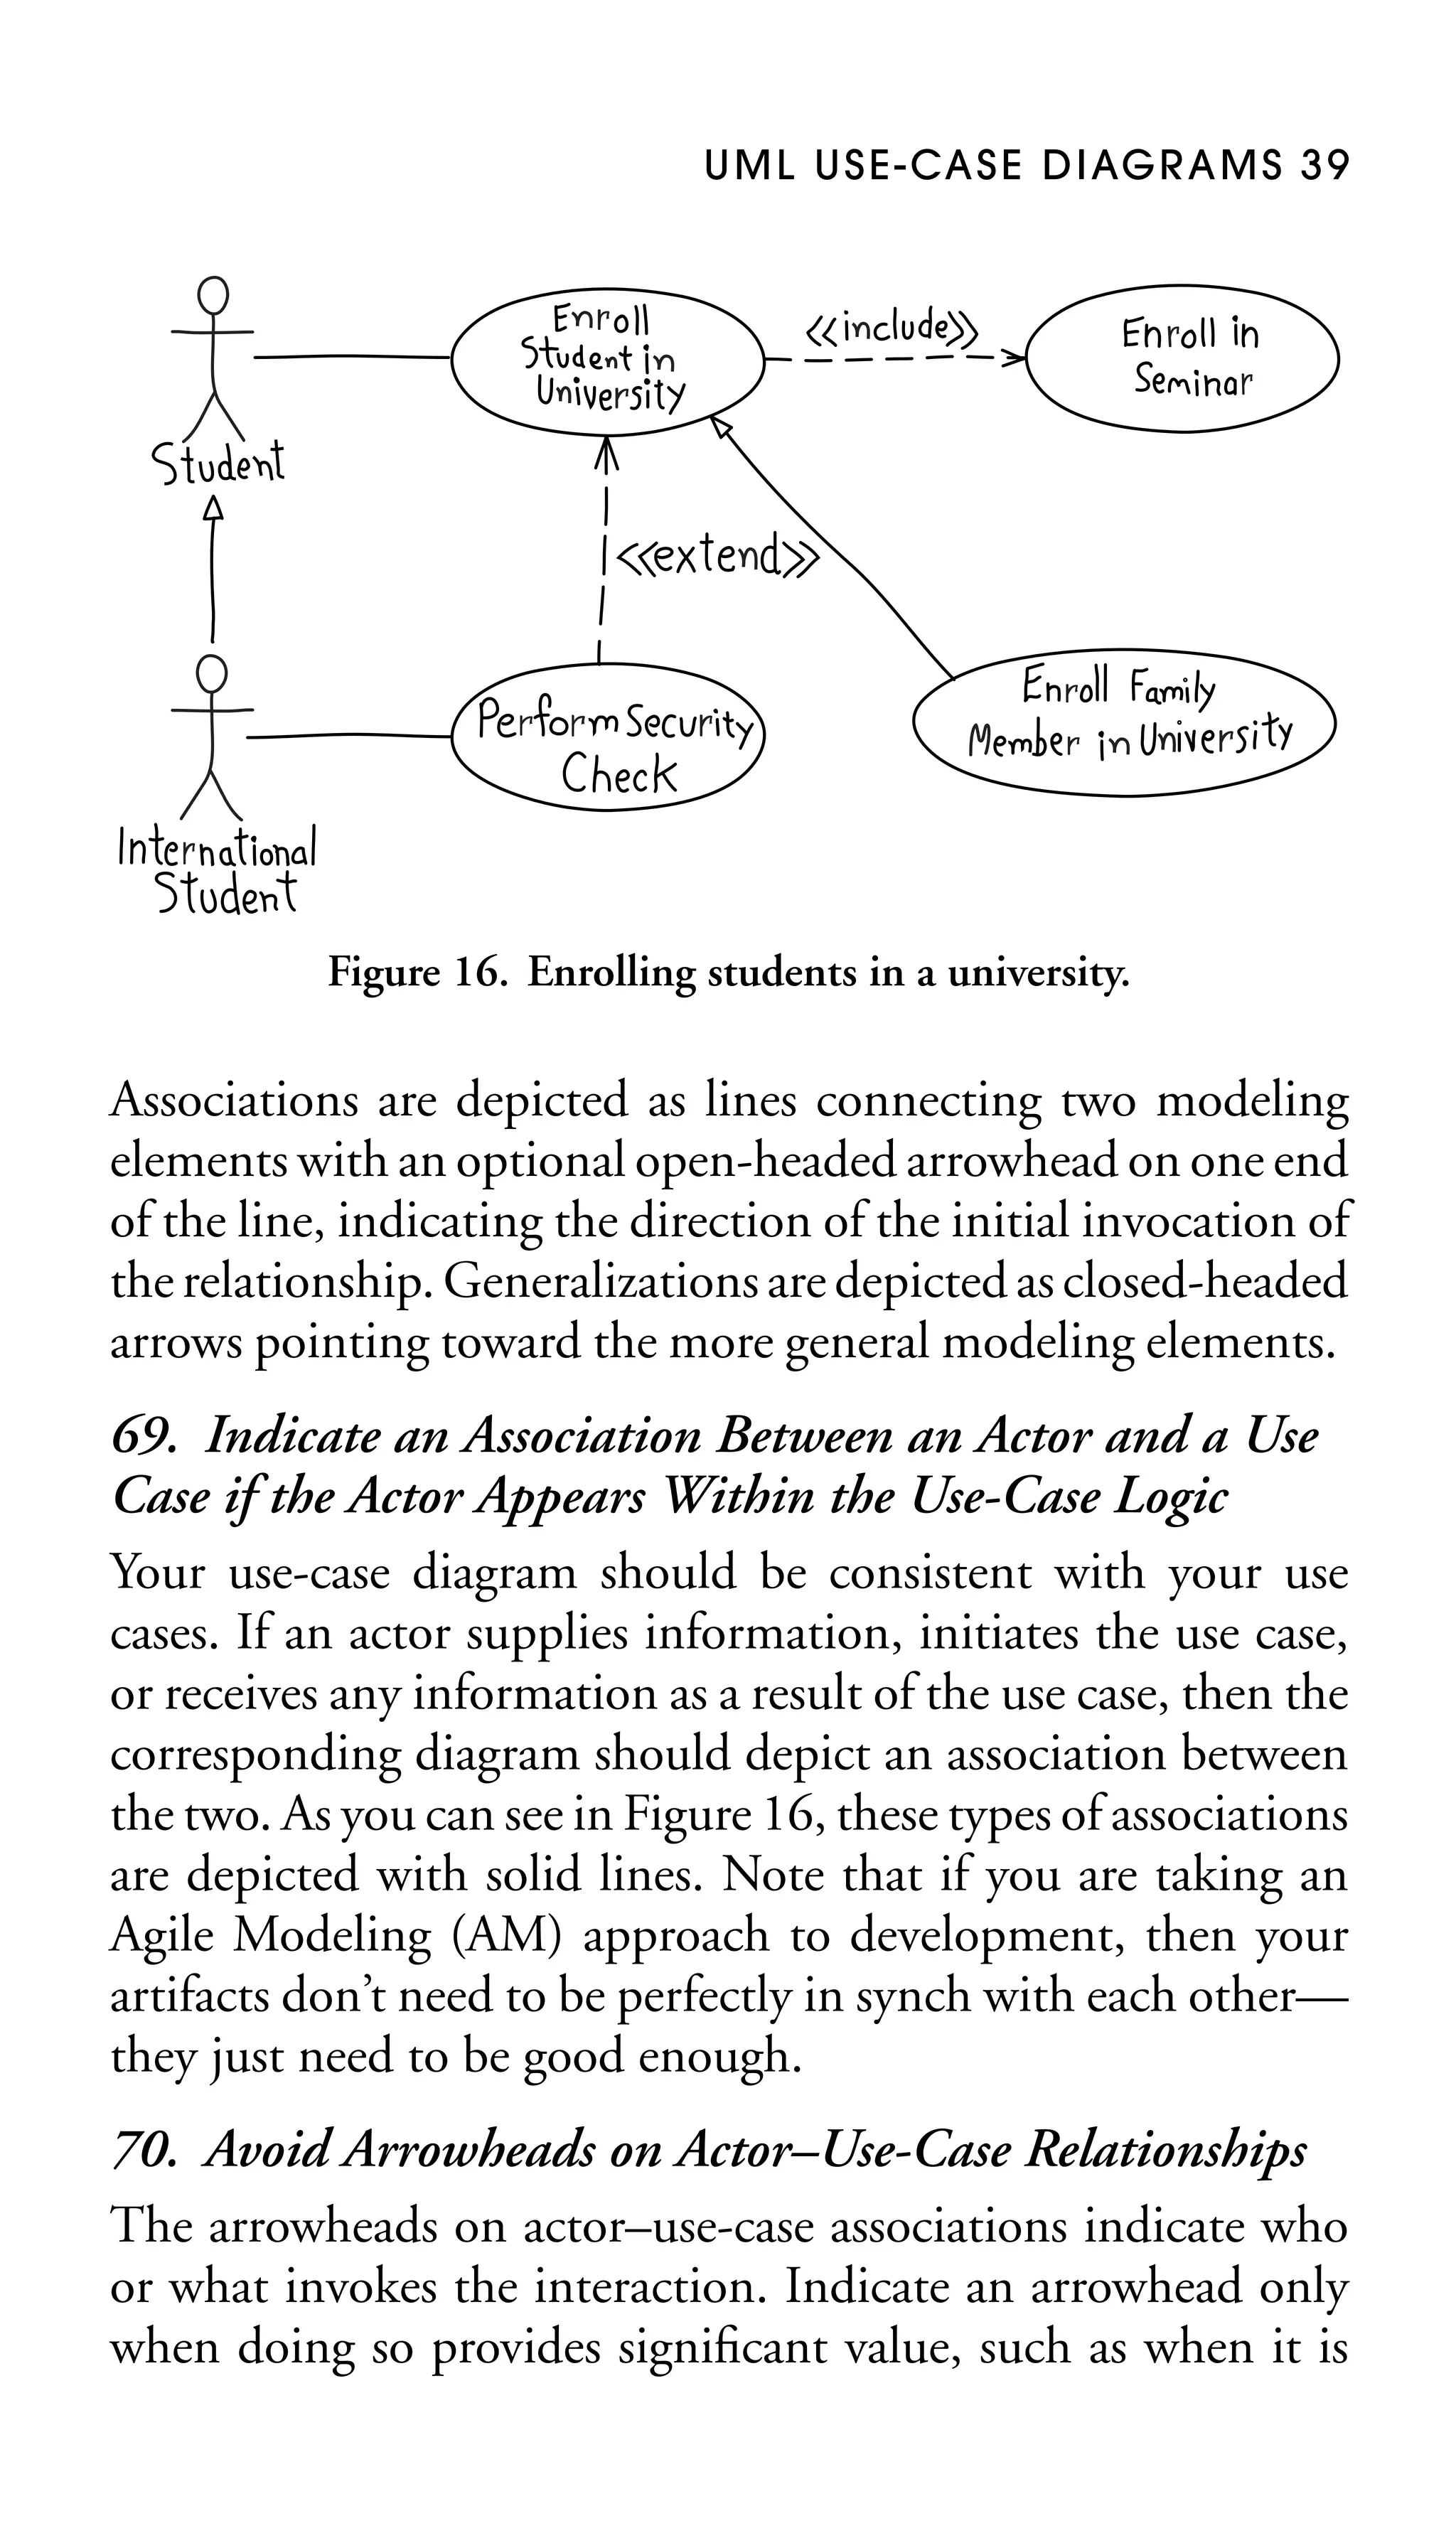
![U M L AC T I V I T Y D I AG R A M S 1 1 7
229. Reflect the Previous Activity by Using
Decision Points
In Figure 41, you can see that there is no label on the decision
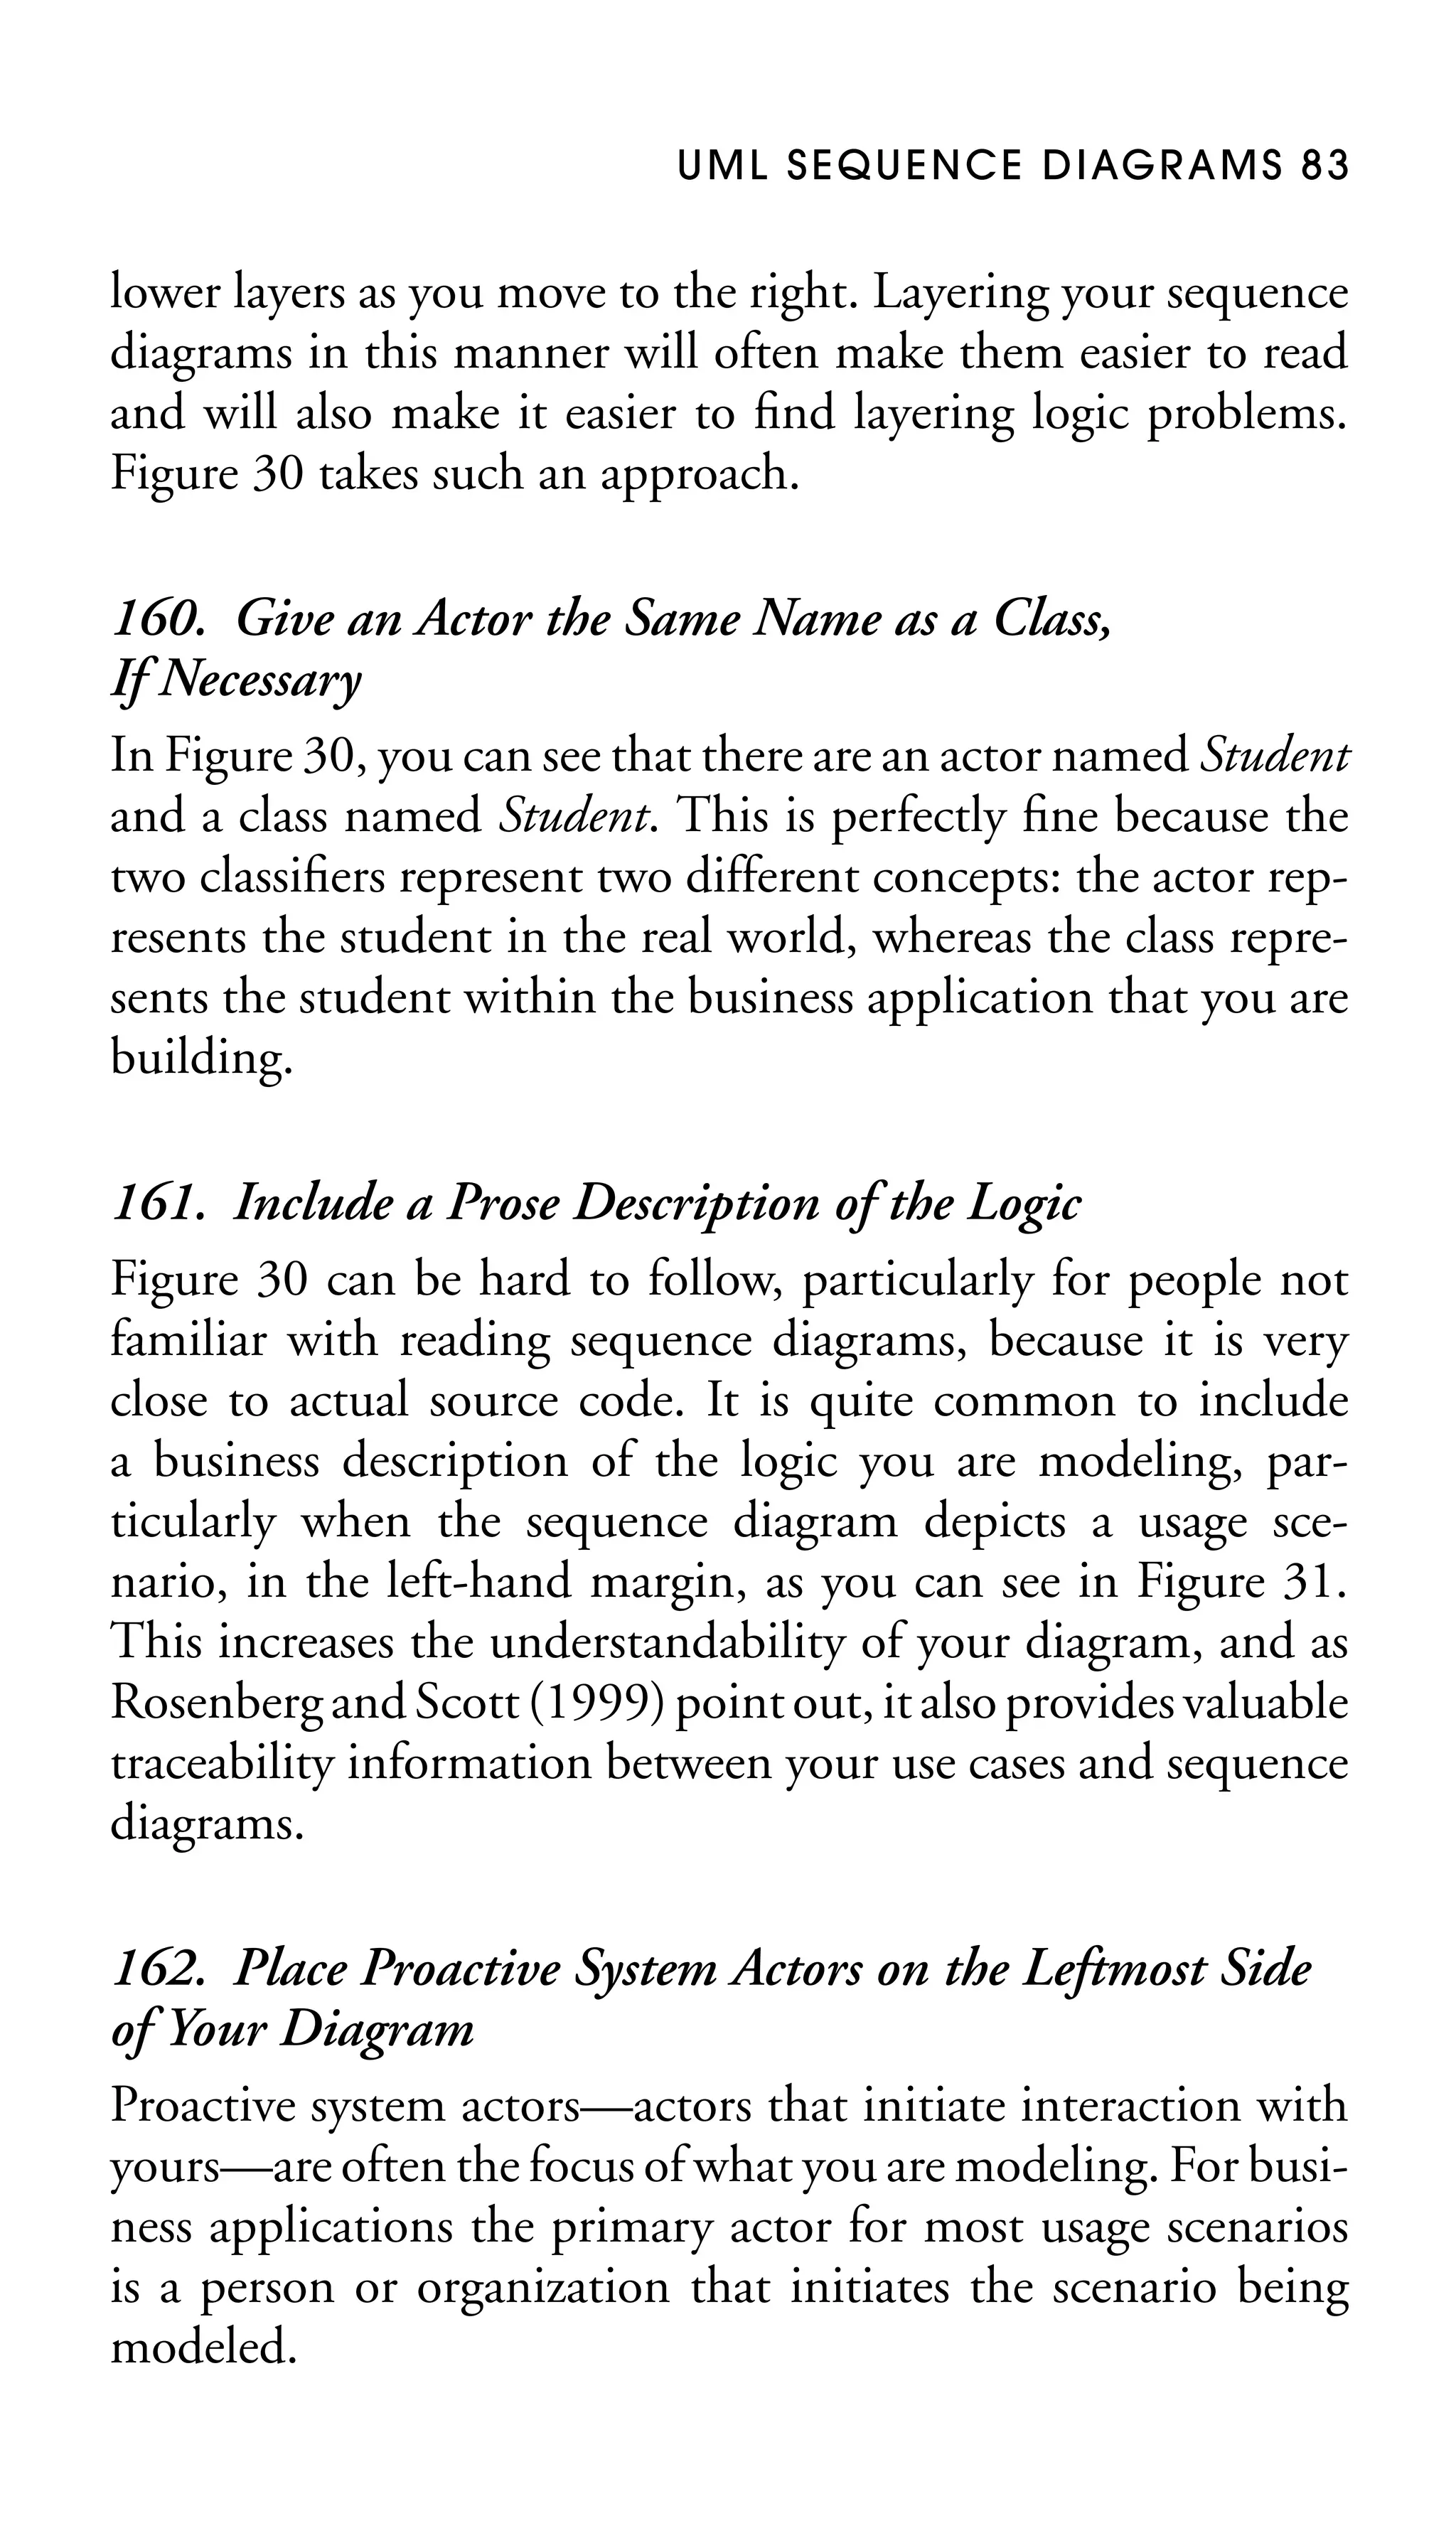
point, unlike traditional flow charts, which would include text
describing the actual decision being made. You need to imply
that the decision concerns whether the person was enrolled
in the university based on the activity that the decision point
follows. The guards on the activity edges leaving the decision
point, depicted using the format [description], also help to
describe the decision point.
230. Avoid Superfluous Decision Points
The Fill Out Enrollment Forms activity in Figure 41 includes
an implied decision point, a check to see that the forms are
filled out properly. This simplifies the diagram by avoiding an
additional diamond.
231. Ensure That Each Activity Edge Leaving
a Decision Point Has a Guard
This ensures that you have thought through all possibilities
for that decision point.
232. Do Not Overlap Guards
The guards on the activity edges leaving a decision point, or
an activity, must be consistent with one another. For example,
guards such as x < 0, x = 0, and x > 0 are consistent, whereas
guards such as x < or 0 and x – 0 are not consistent because
>
–
they overlap. (It isn’t clear what should happen when x is 0.)
In Figure 41, the guards on the exit activity edges from the
Fill Out Enrollment Forms activity do not overlap, nor do the
guards on the decision point.](https://image.slidesharecdn.com/2005-050521616786theelementsofuml2style-131128083647-phpapp02/75/the-elements-of-uml-2-style-130-2048.jpg)
![118 THE ELEMENTS OF UML 2.0 STYLE
233. Ensure That Guards on Decision Points Form
a Complete Set
It must always be possible to leave a decision point. Therefore,
the guards on its exit activity edges must be complete. For
example, guards such as x < 0 and x > 0 are not complete
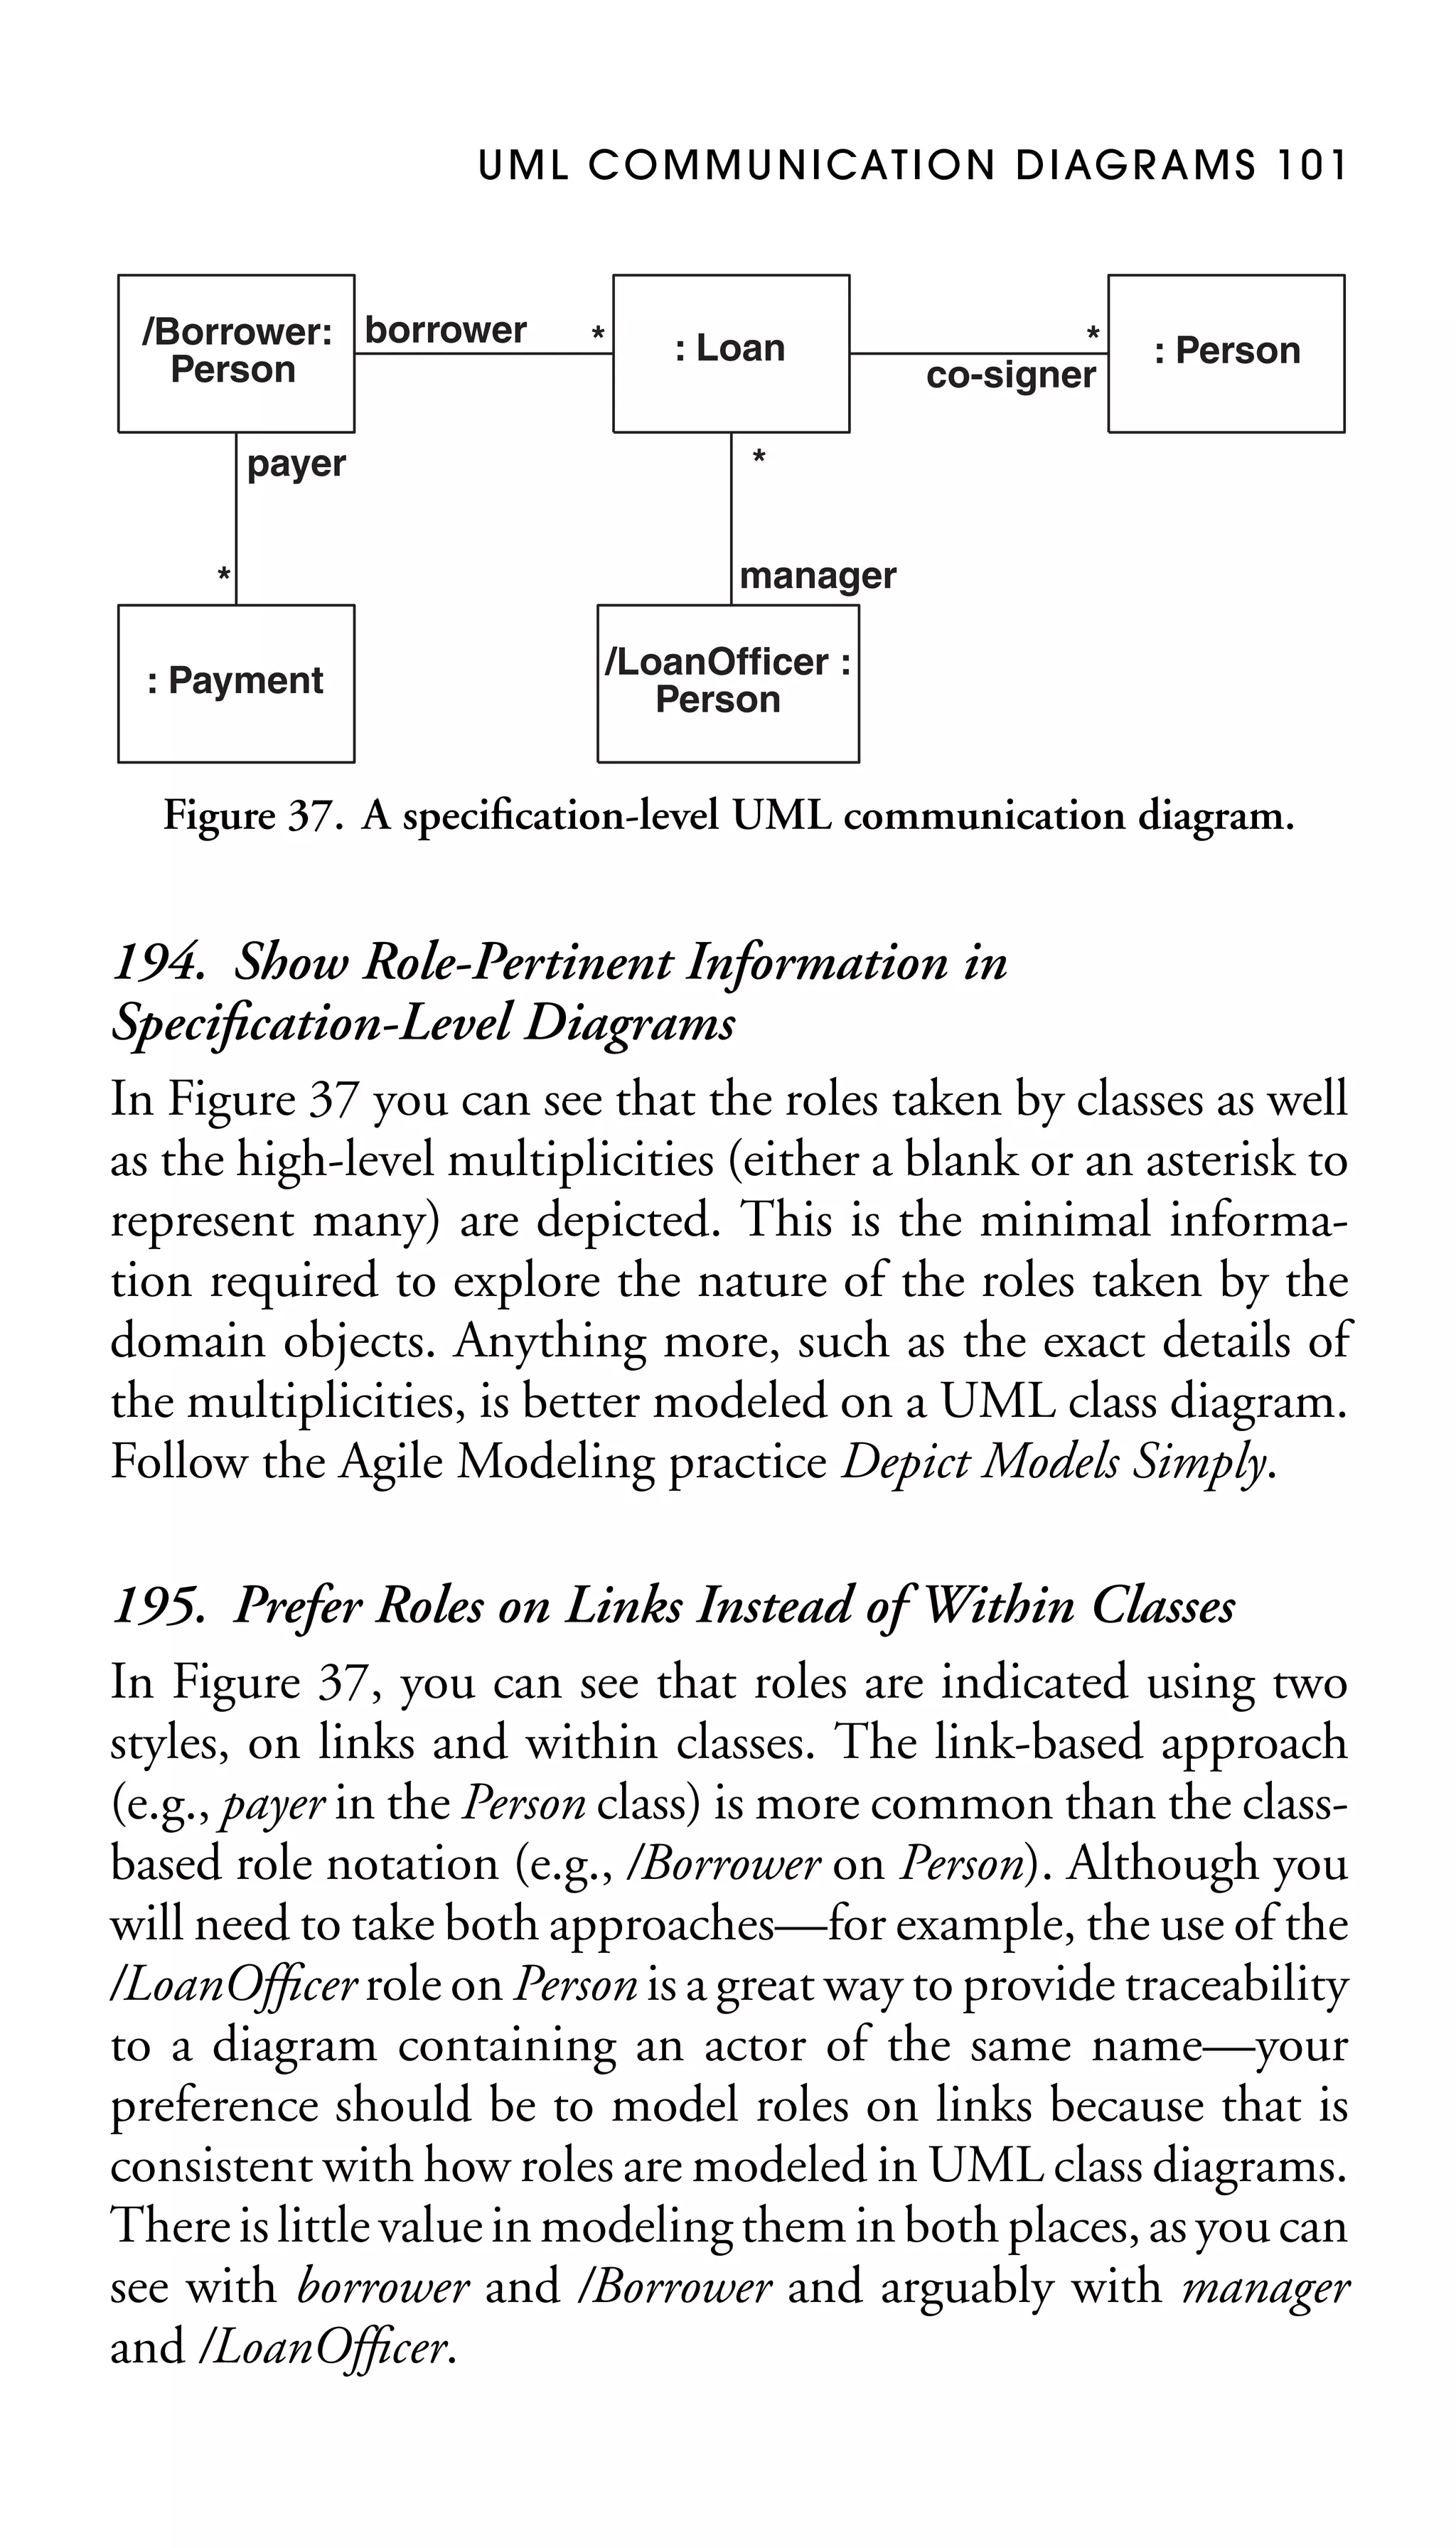
because it isn’t clear what happens when x is 0.
234. Ensure That Exit Guards and Activity Invariants
Form a Complete Set
An activity invariant is a condition that is always true when
your system is processing an activity. For example, in Figure 41
an invariant of the Enroll In University activity is that the person is not yet officially a student. Clearly, the conditions that
are true while an activity is being processed must not overlap
with its exit conditions. Furthermore, the invariants and exit
conditions must form a complete set. In other words, the conditions that define when you are in an activity plus the conditions that define when you leave the activity must add up.
235. Apply an [Otherwise] Guard for
“Fall-Through” Logic
In Figure 41, you can see that one of the activity edges on the
decision point is labeled Otherwise, a catchall condition for
the situation in which problems with the forms are not trivial
and help is not available. This avoided a very wordy guard,
thus simplifying the diagram.
236. Model Guards Only If They Add Value
An activity edge will not necessarily include a guard, even when
an activity includes several exit activity edges. When a UML
activity diagram is used to model a software process (Figure 42)
or a business process (Figure 46), the activity edges often
represent sharing or movement of information and objects](https://image.slidesharecdn.com/2005-050521616786theelementsofuml2style-131128083647-phpapp02/75/the-elements-of-uml-2-style-131-2048.jpg)
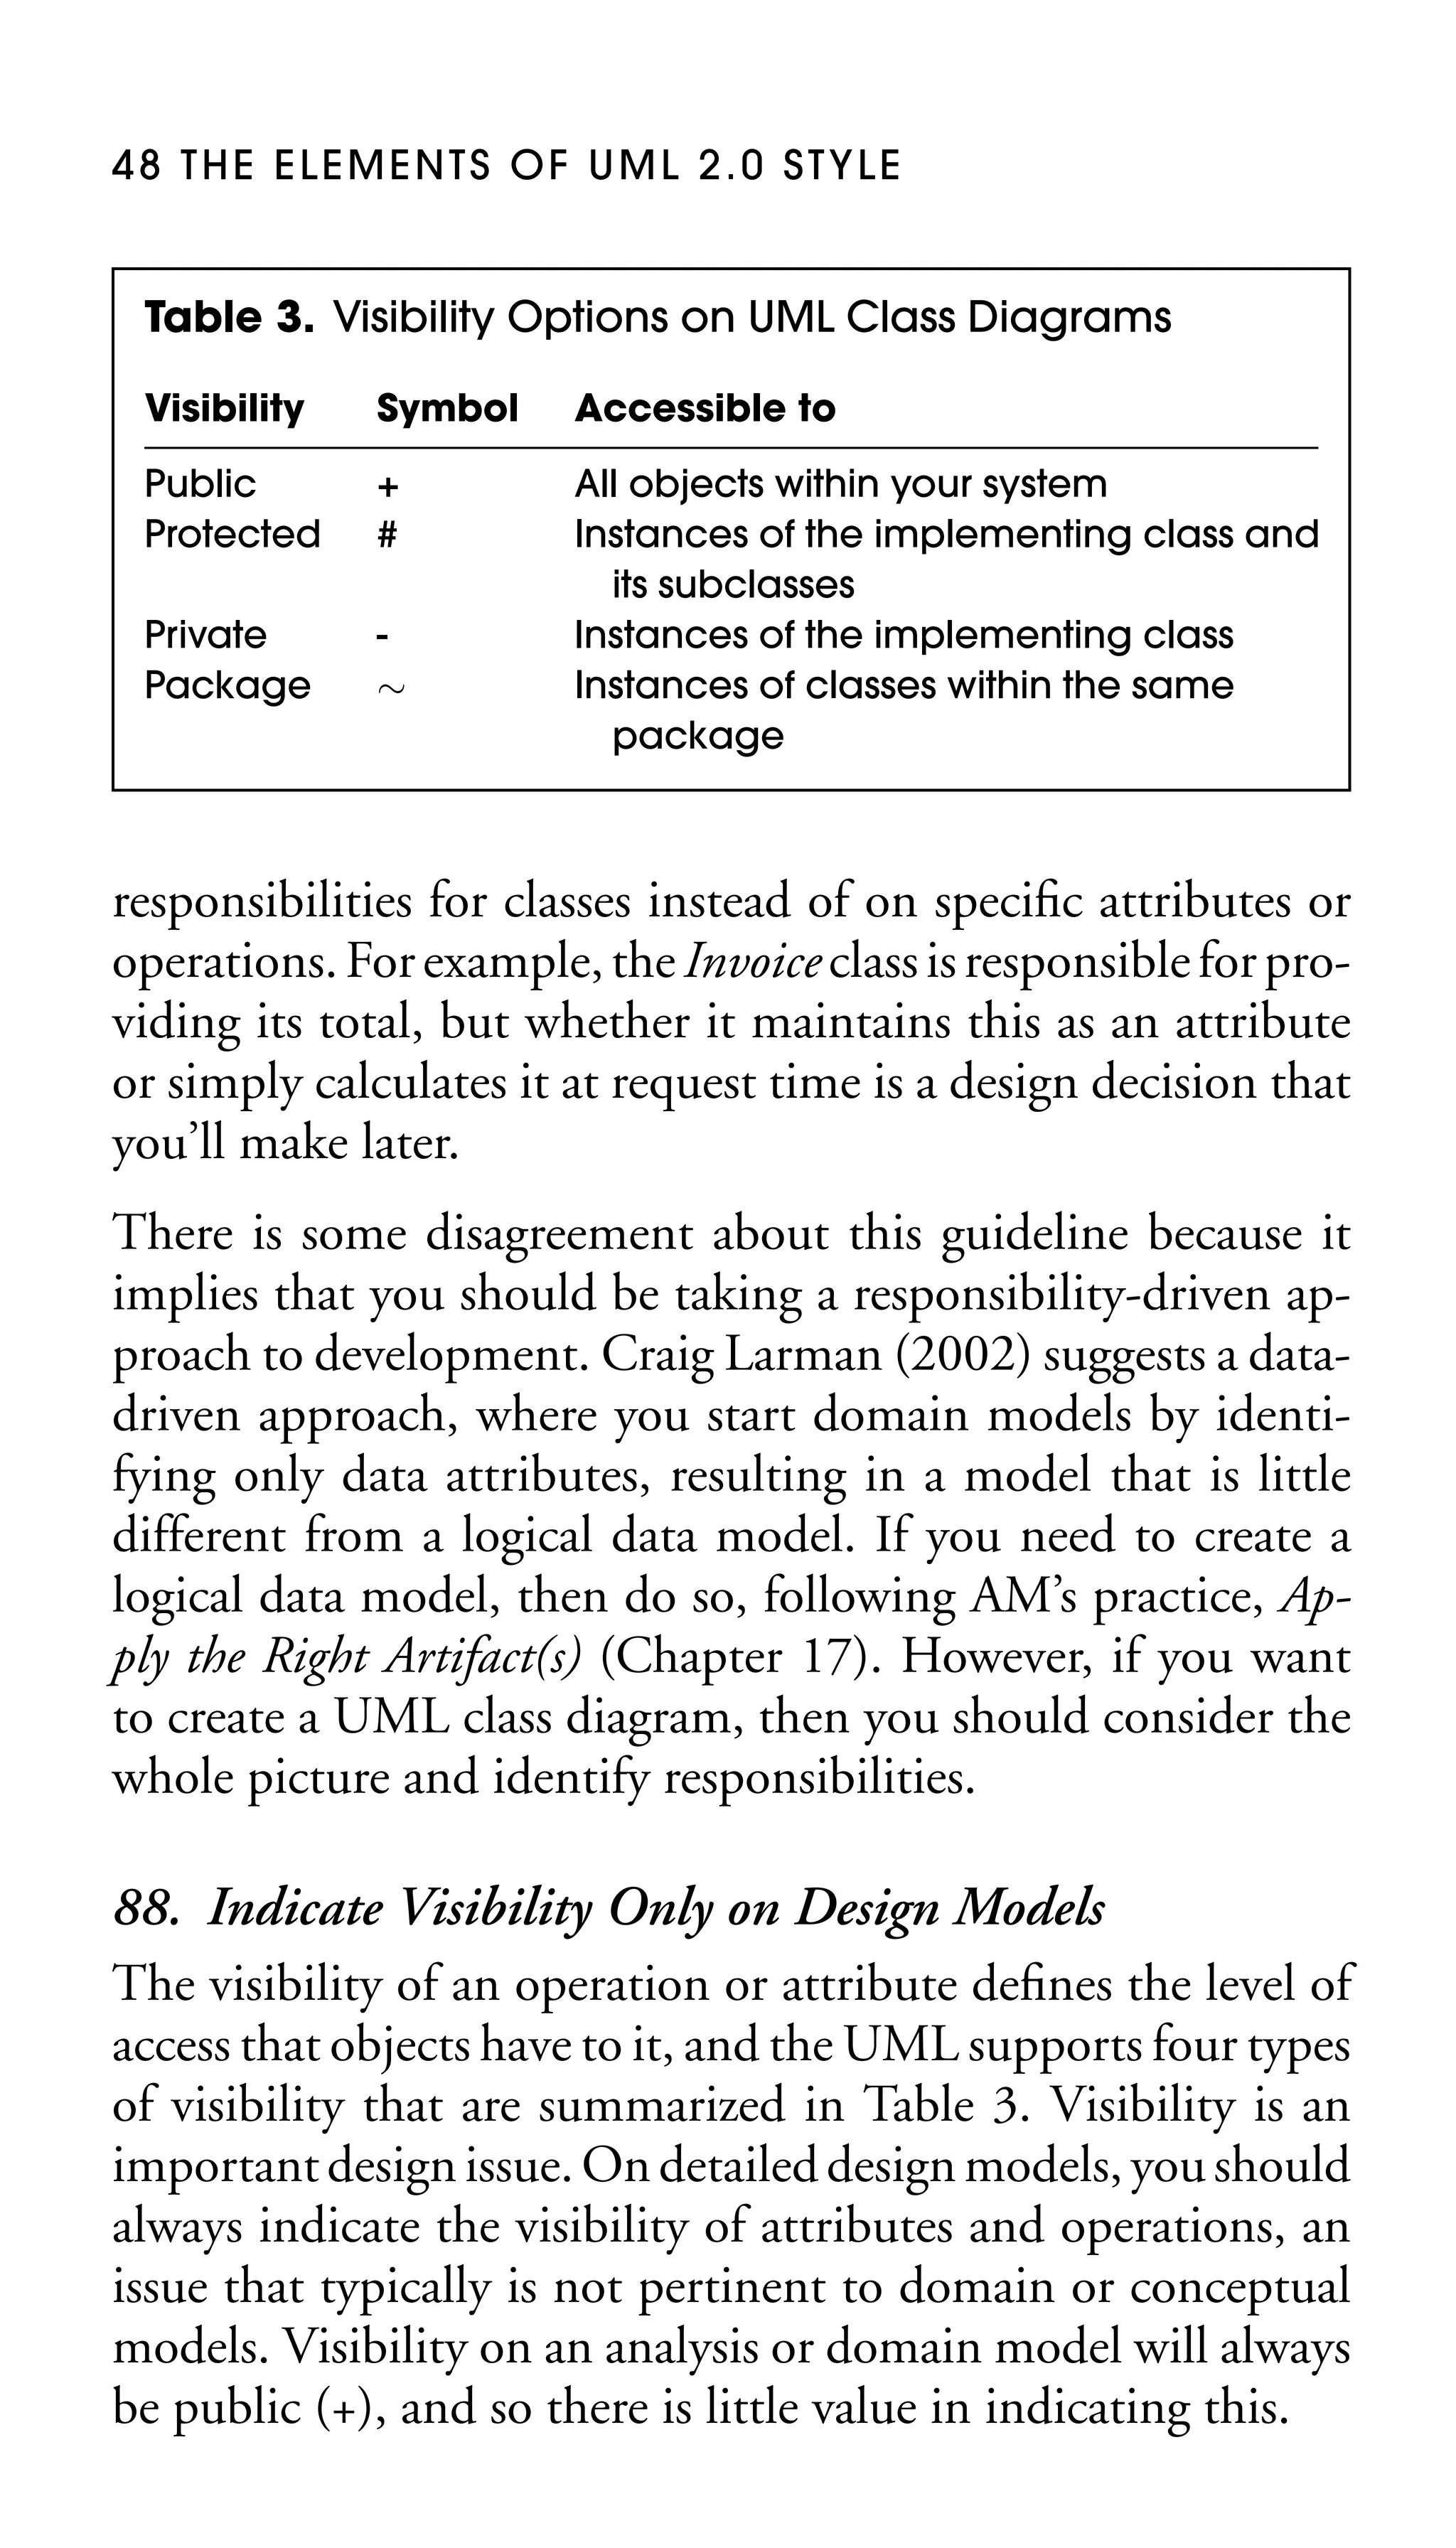
![120 THE ELEMENTS OF UML 2.0 STYLE
[account.balance >=
withdraw.amount]
[account.balance <
withdraw.amount]
<<decisionInput>>
account.balance >=
withdraw.amount
[true]
[false]
Sufficient
Balance?
[true]
[false]
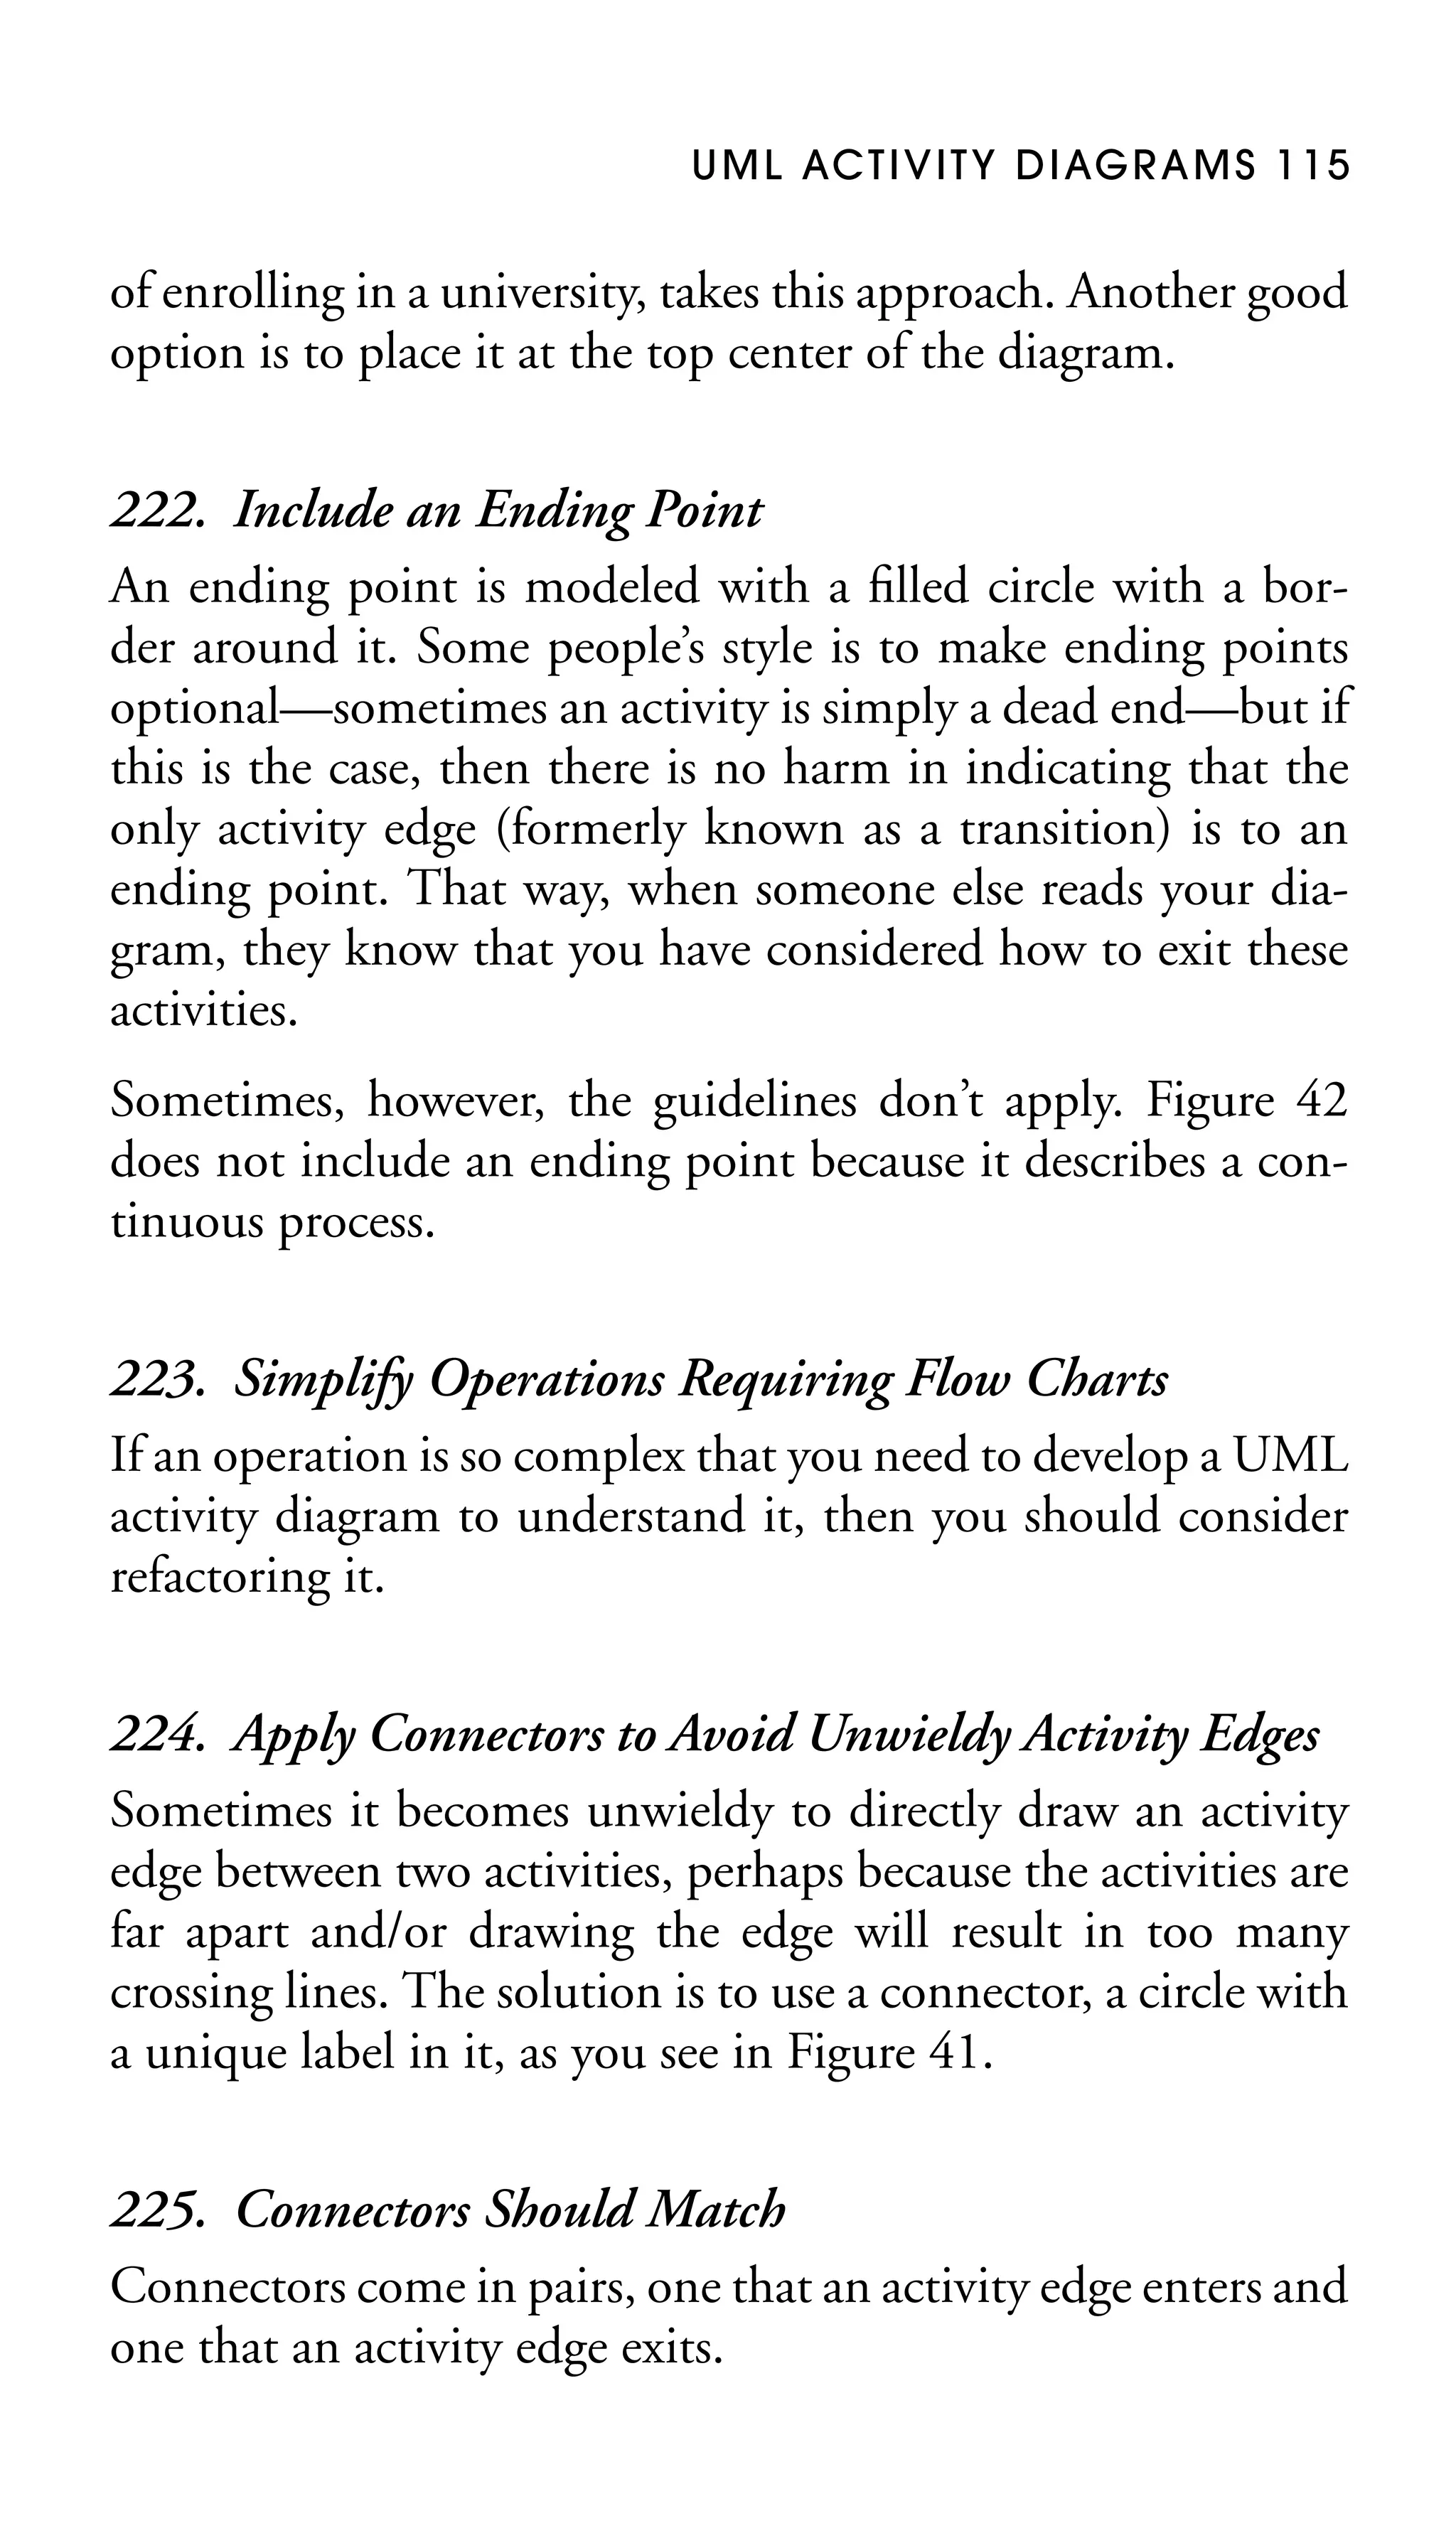
Figure 43. Options for depicting decisions.
238. Simplify Guards By Indicating Decisions
Within Diamonds
The third approach to indicating decision logic in Figure 43
is to simply describe the logic within the decision point diamond. This is constrained by the size of the diamond itself,
diamonds should be smaller than activity bubbles, and your
modeling tool may not support it. This approach reflects traditional flow-charting techniques and is arguably more humanfriendly than the other two approaches.](https://image.slidesharecdn.com/2005-050521616786theelementsofuml2style-131128083647-phpapp02/75/the-elements-of-uml-2-style-133-2048.jpg)
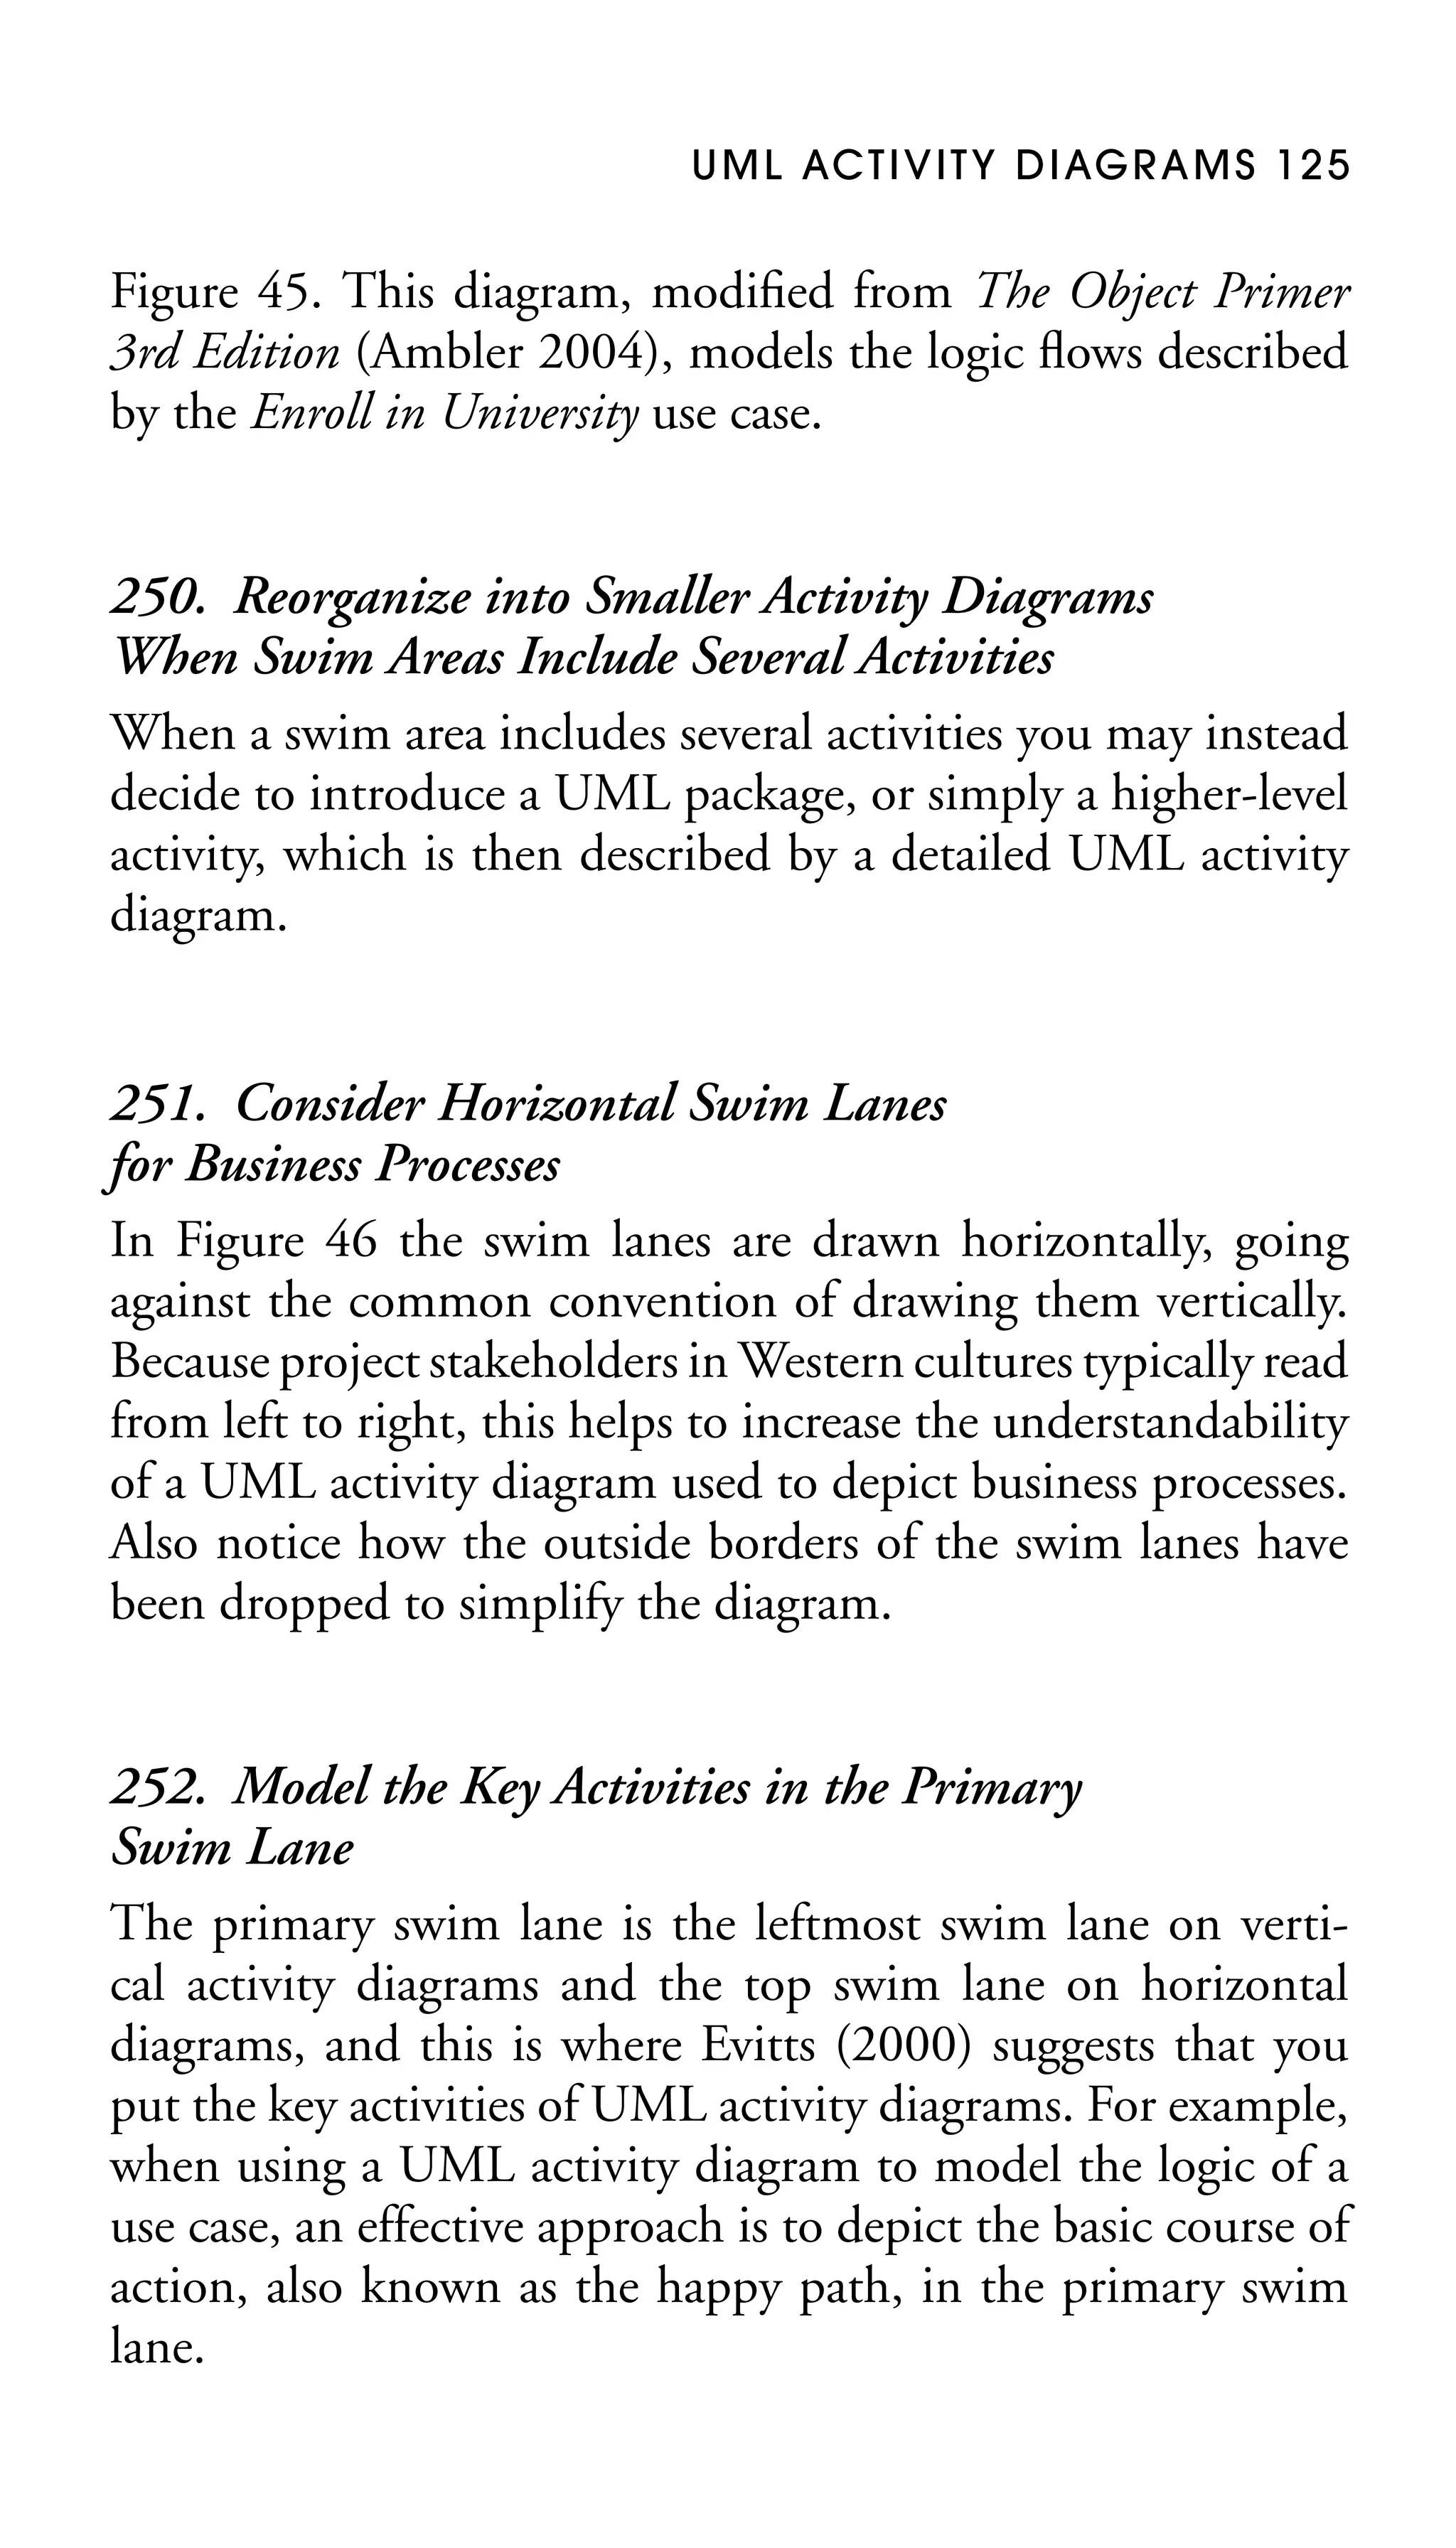
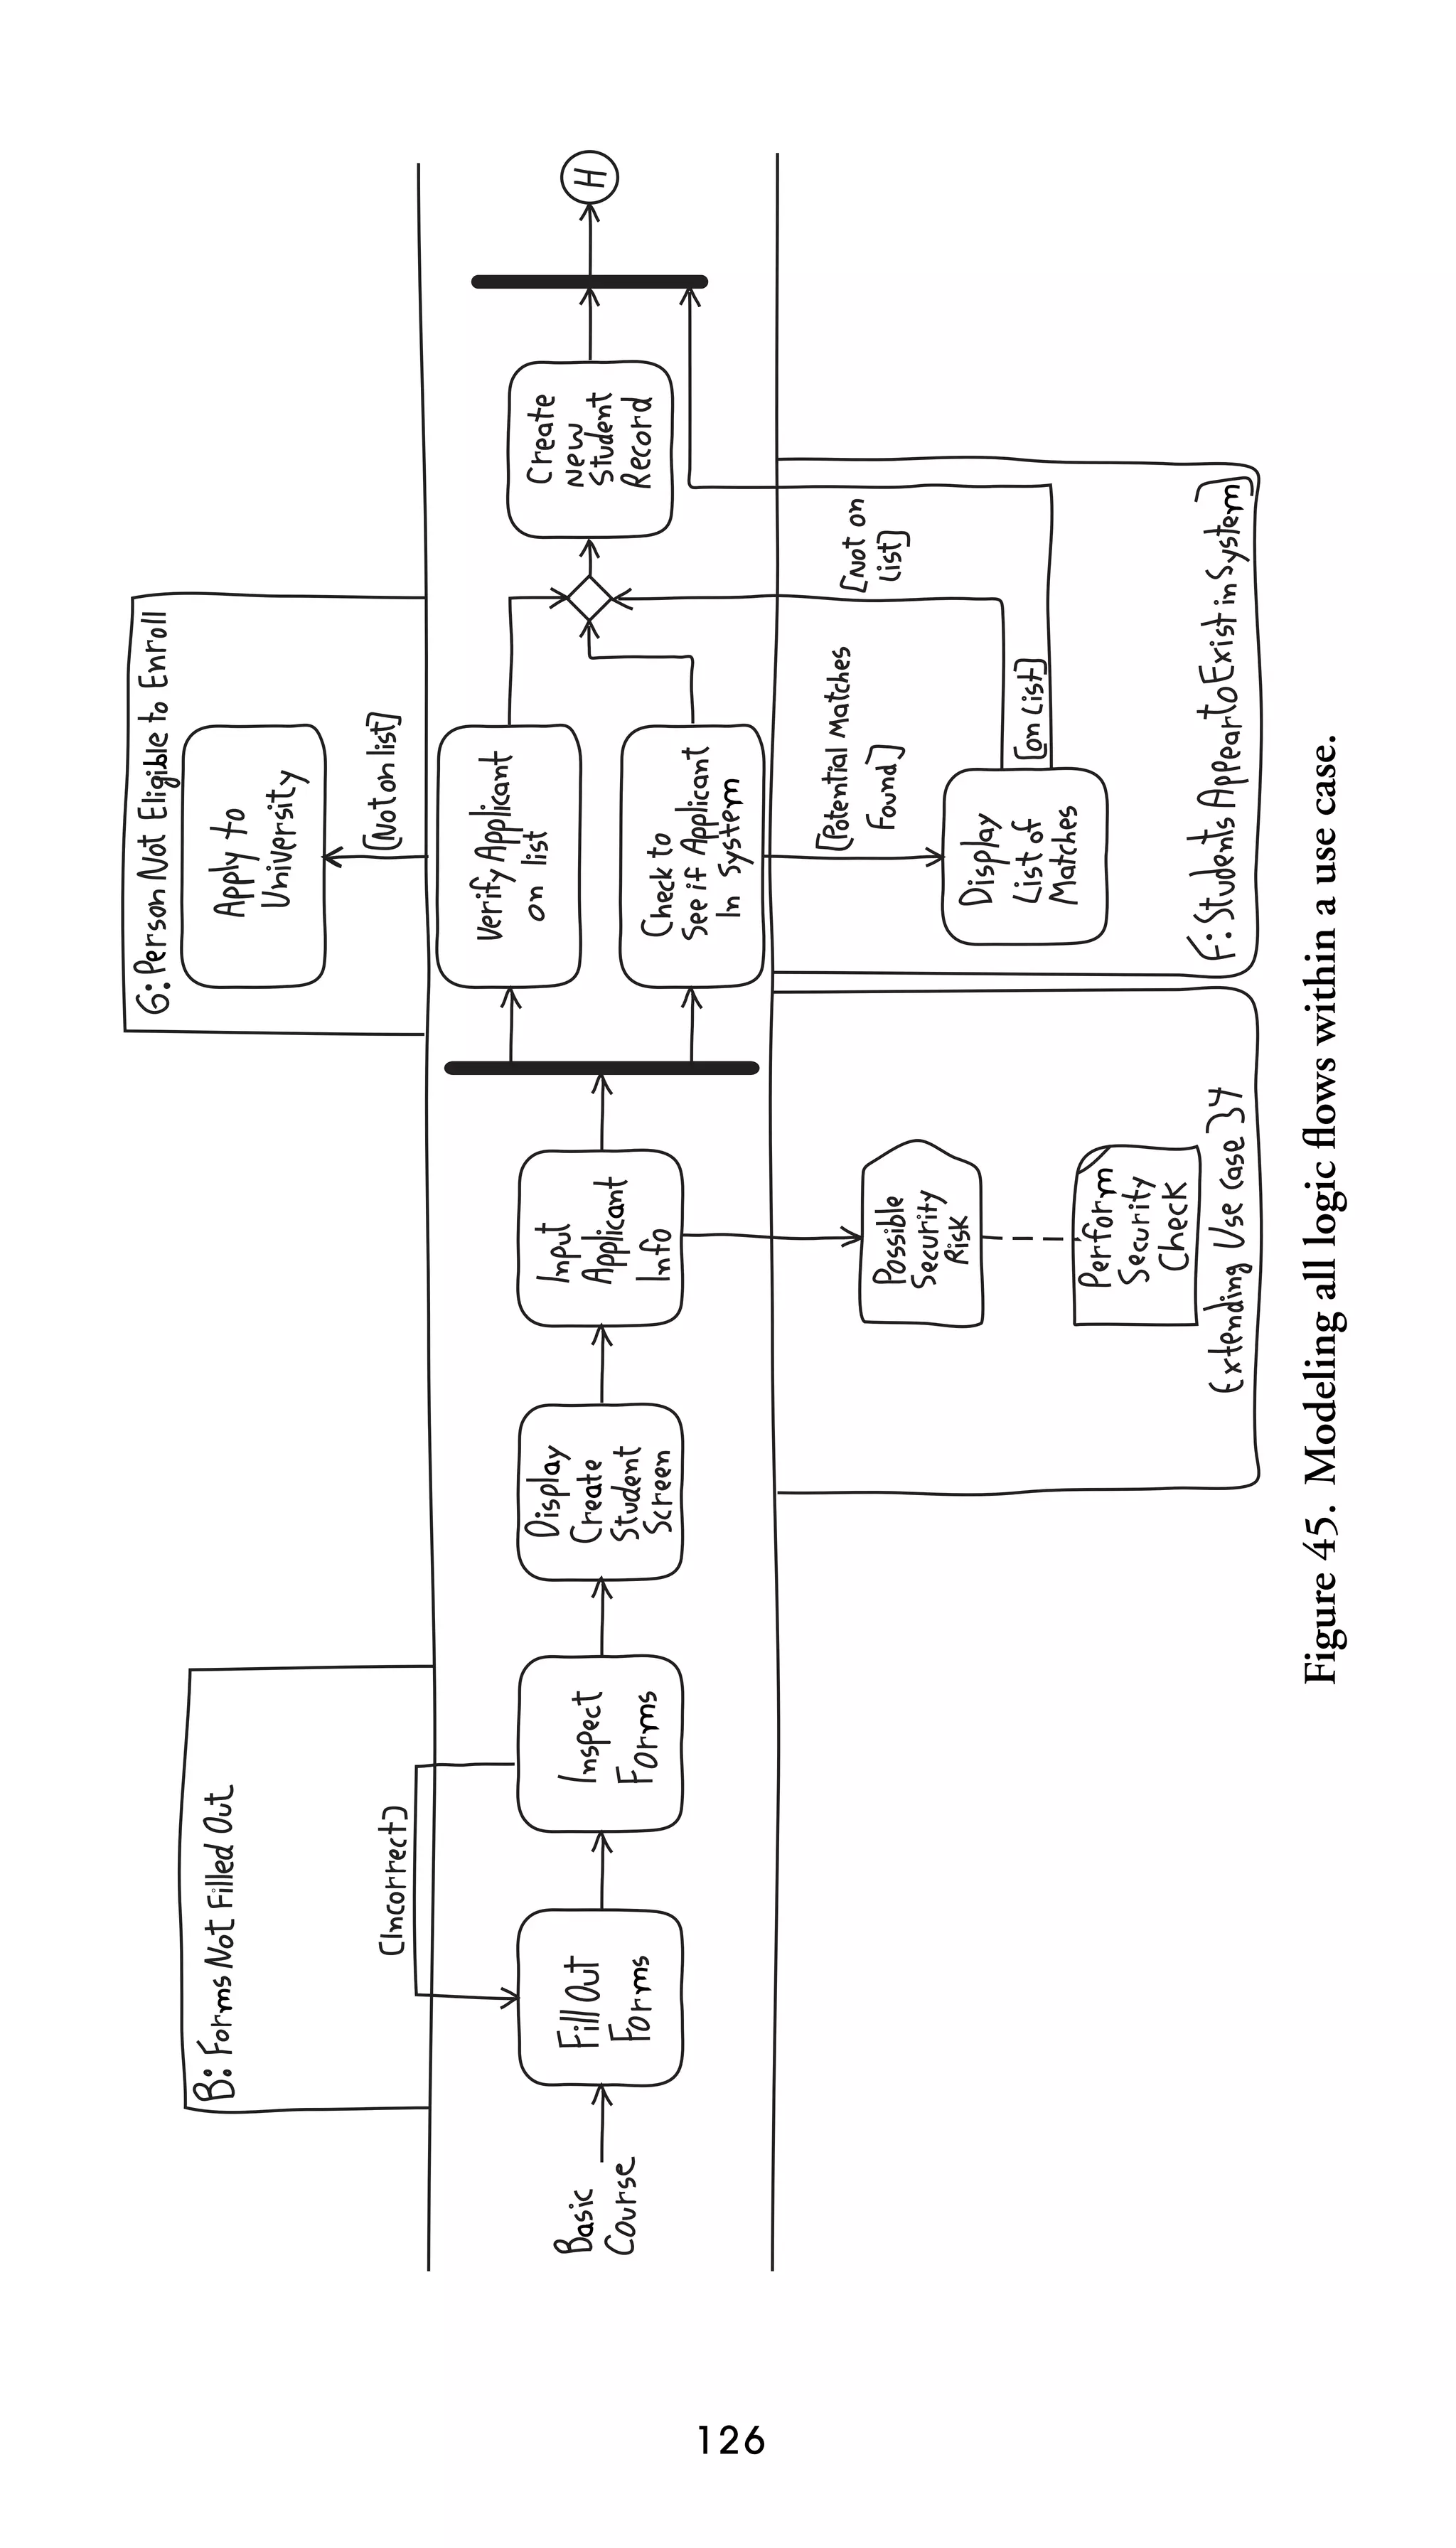
![127
Payroll
Service
Accountant
Consultant
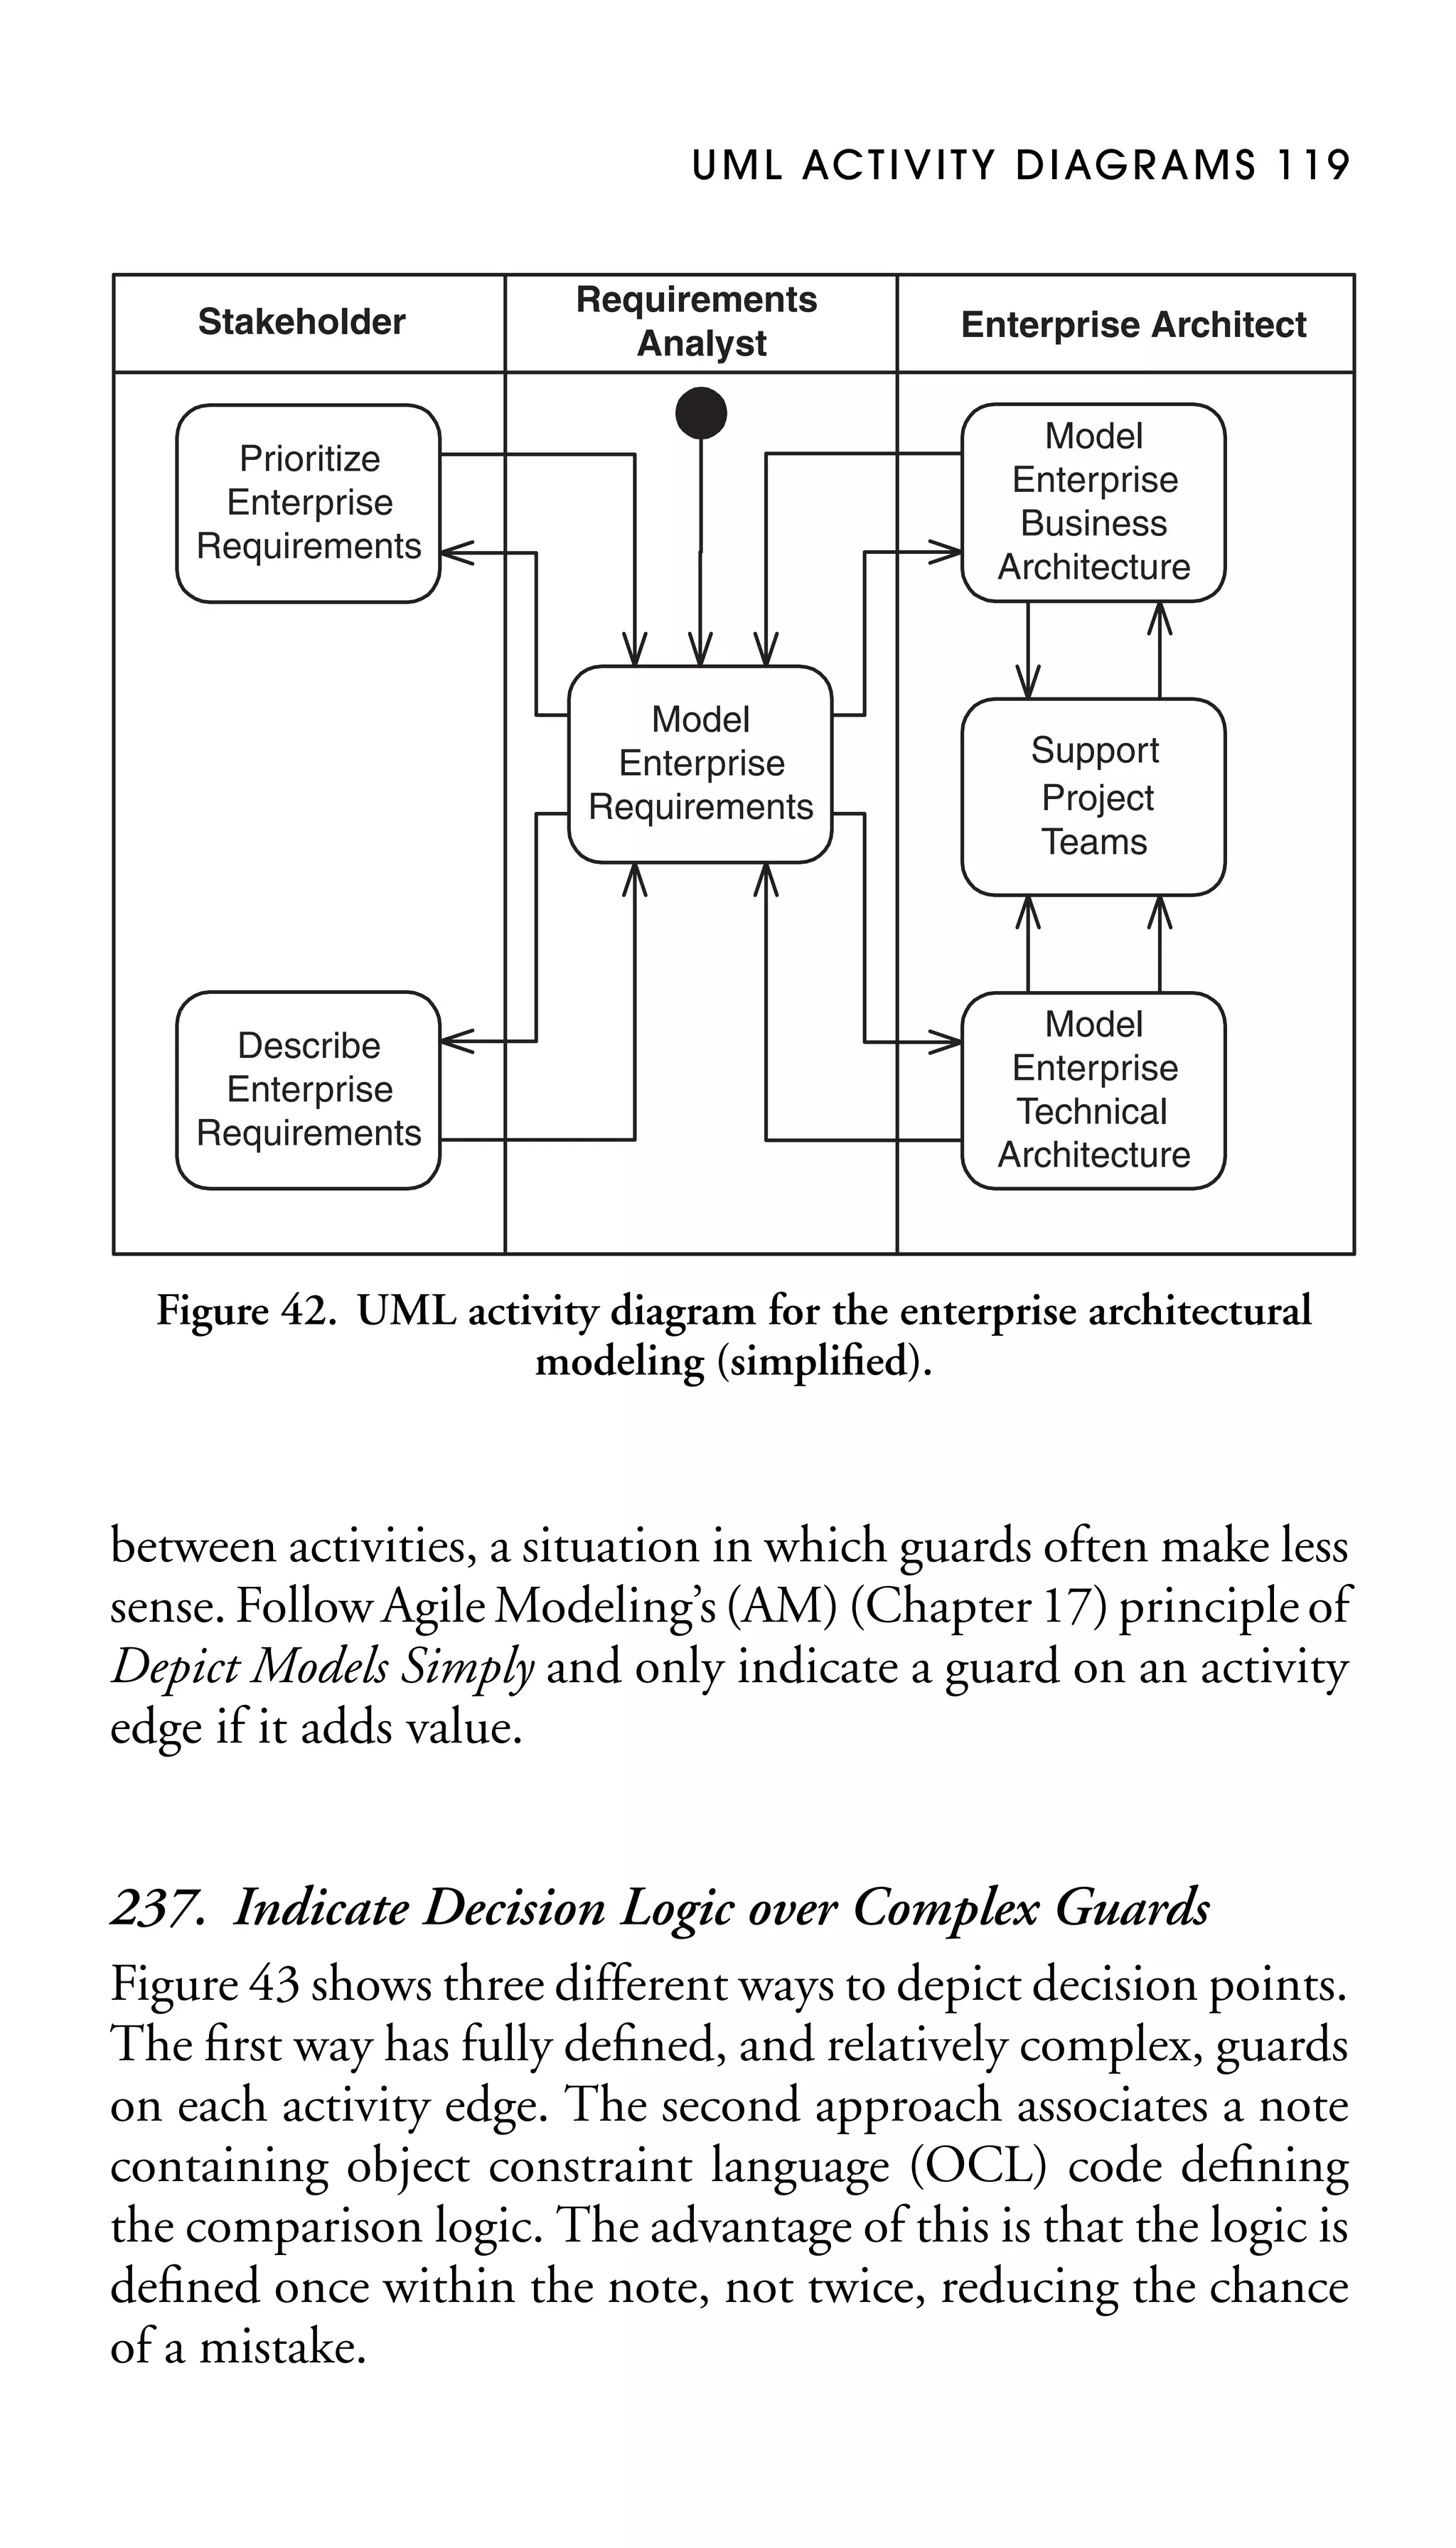
:Expense
Form
[Initial]
Fill Out
Expense
Form
[valid]
Payroll
File
Expense Form Enter Expenses
In Payroll
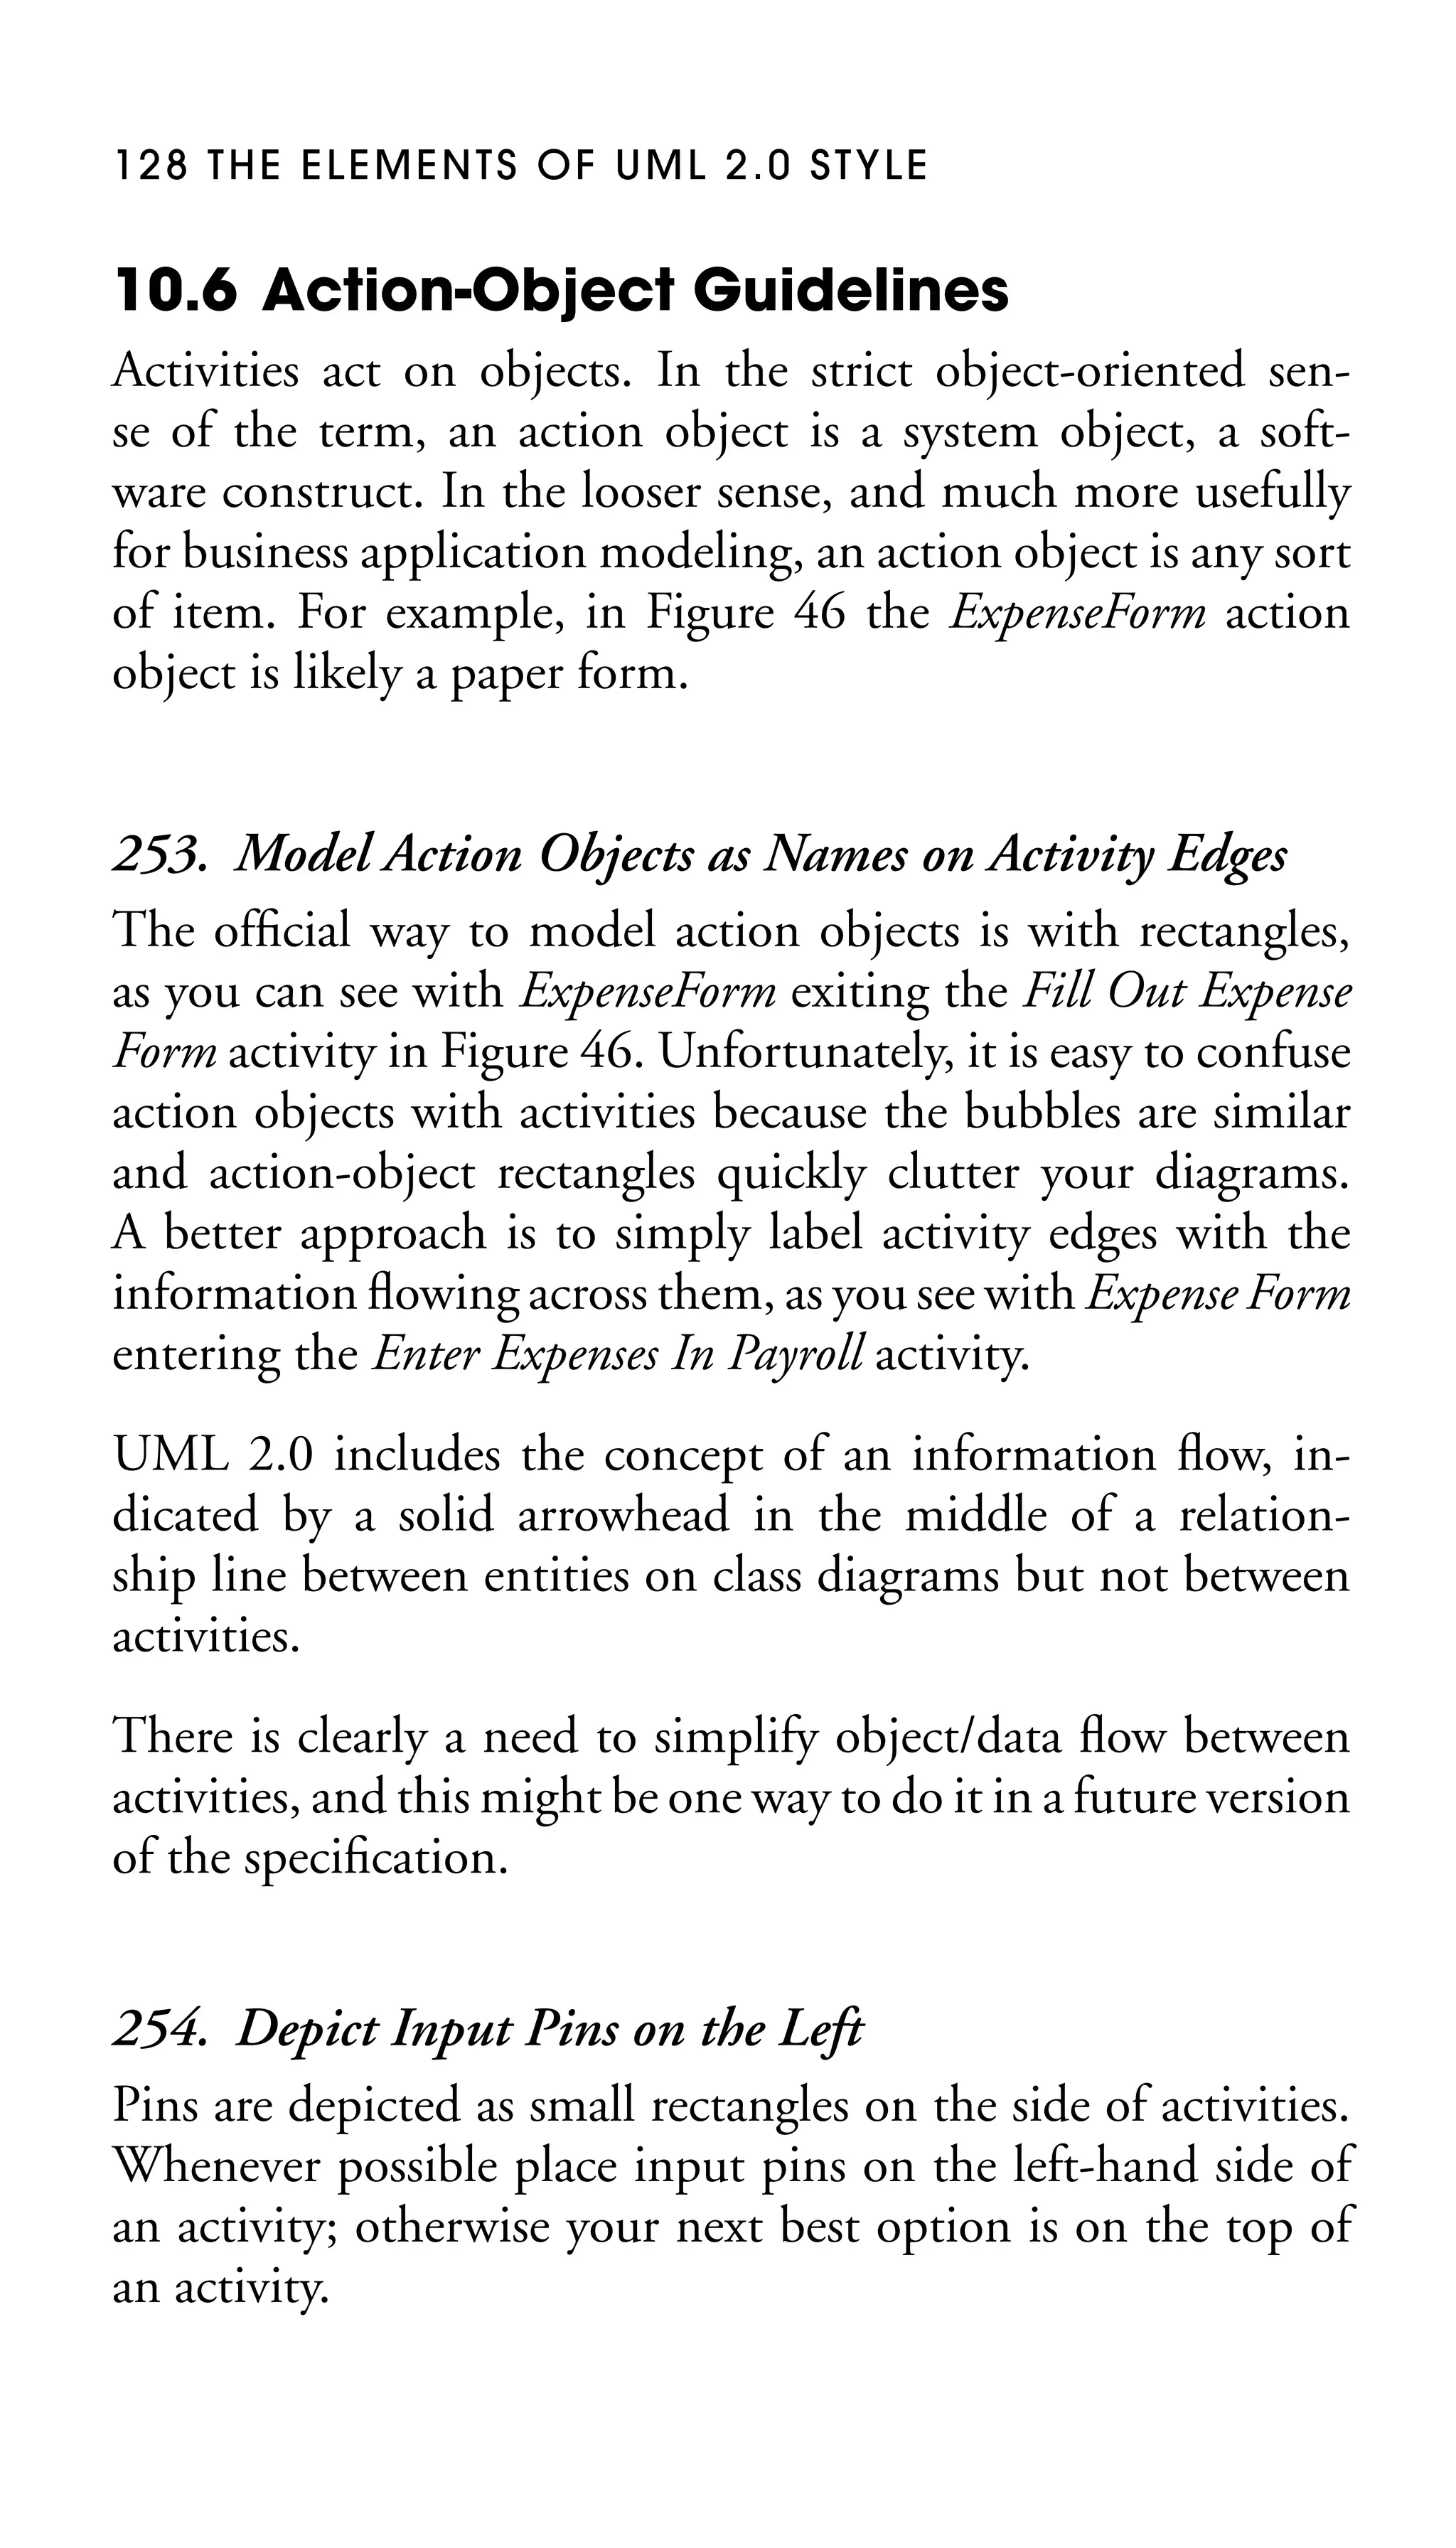
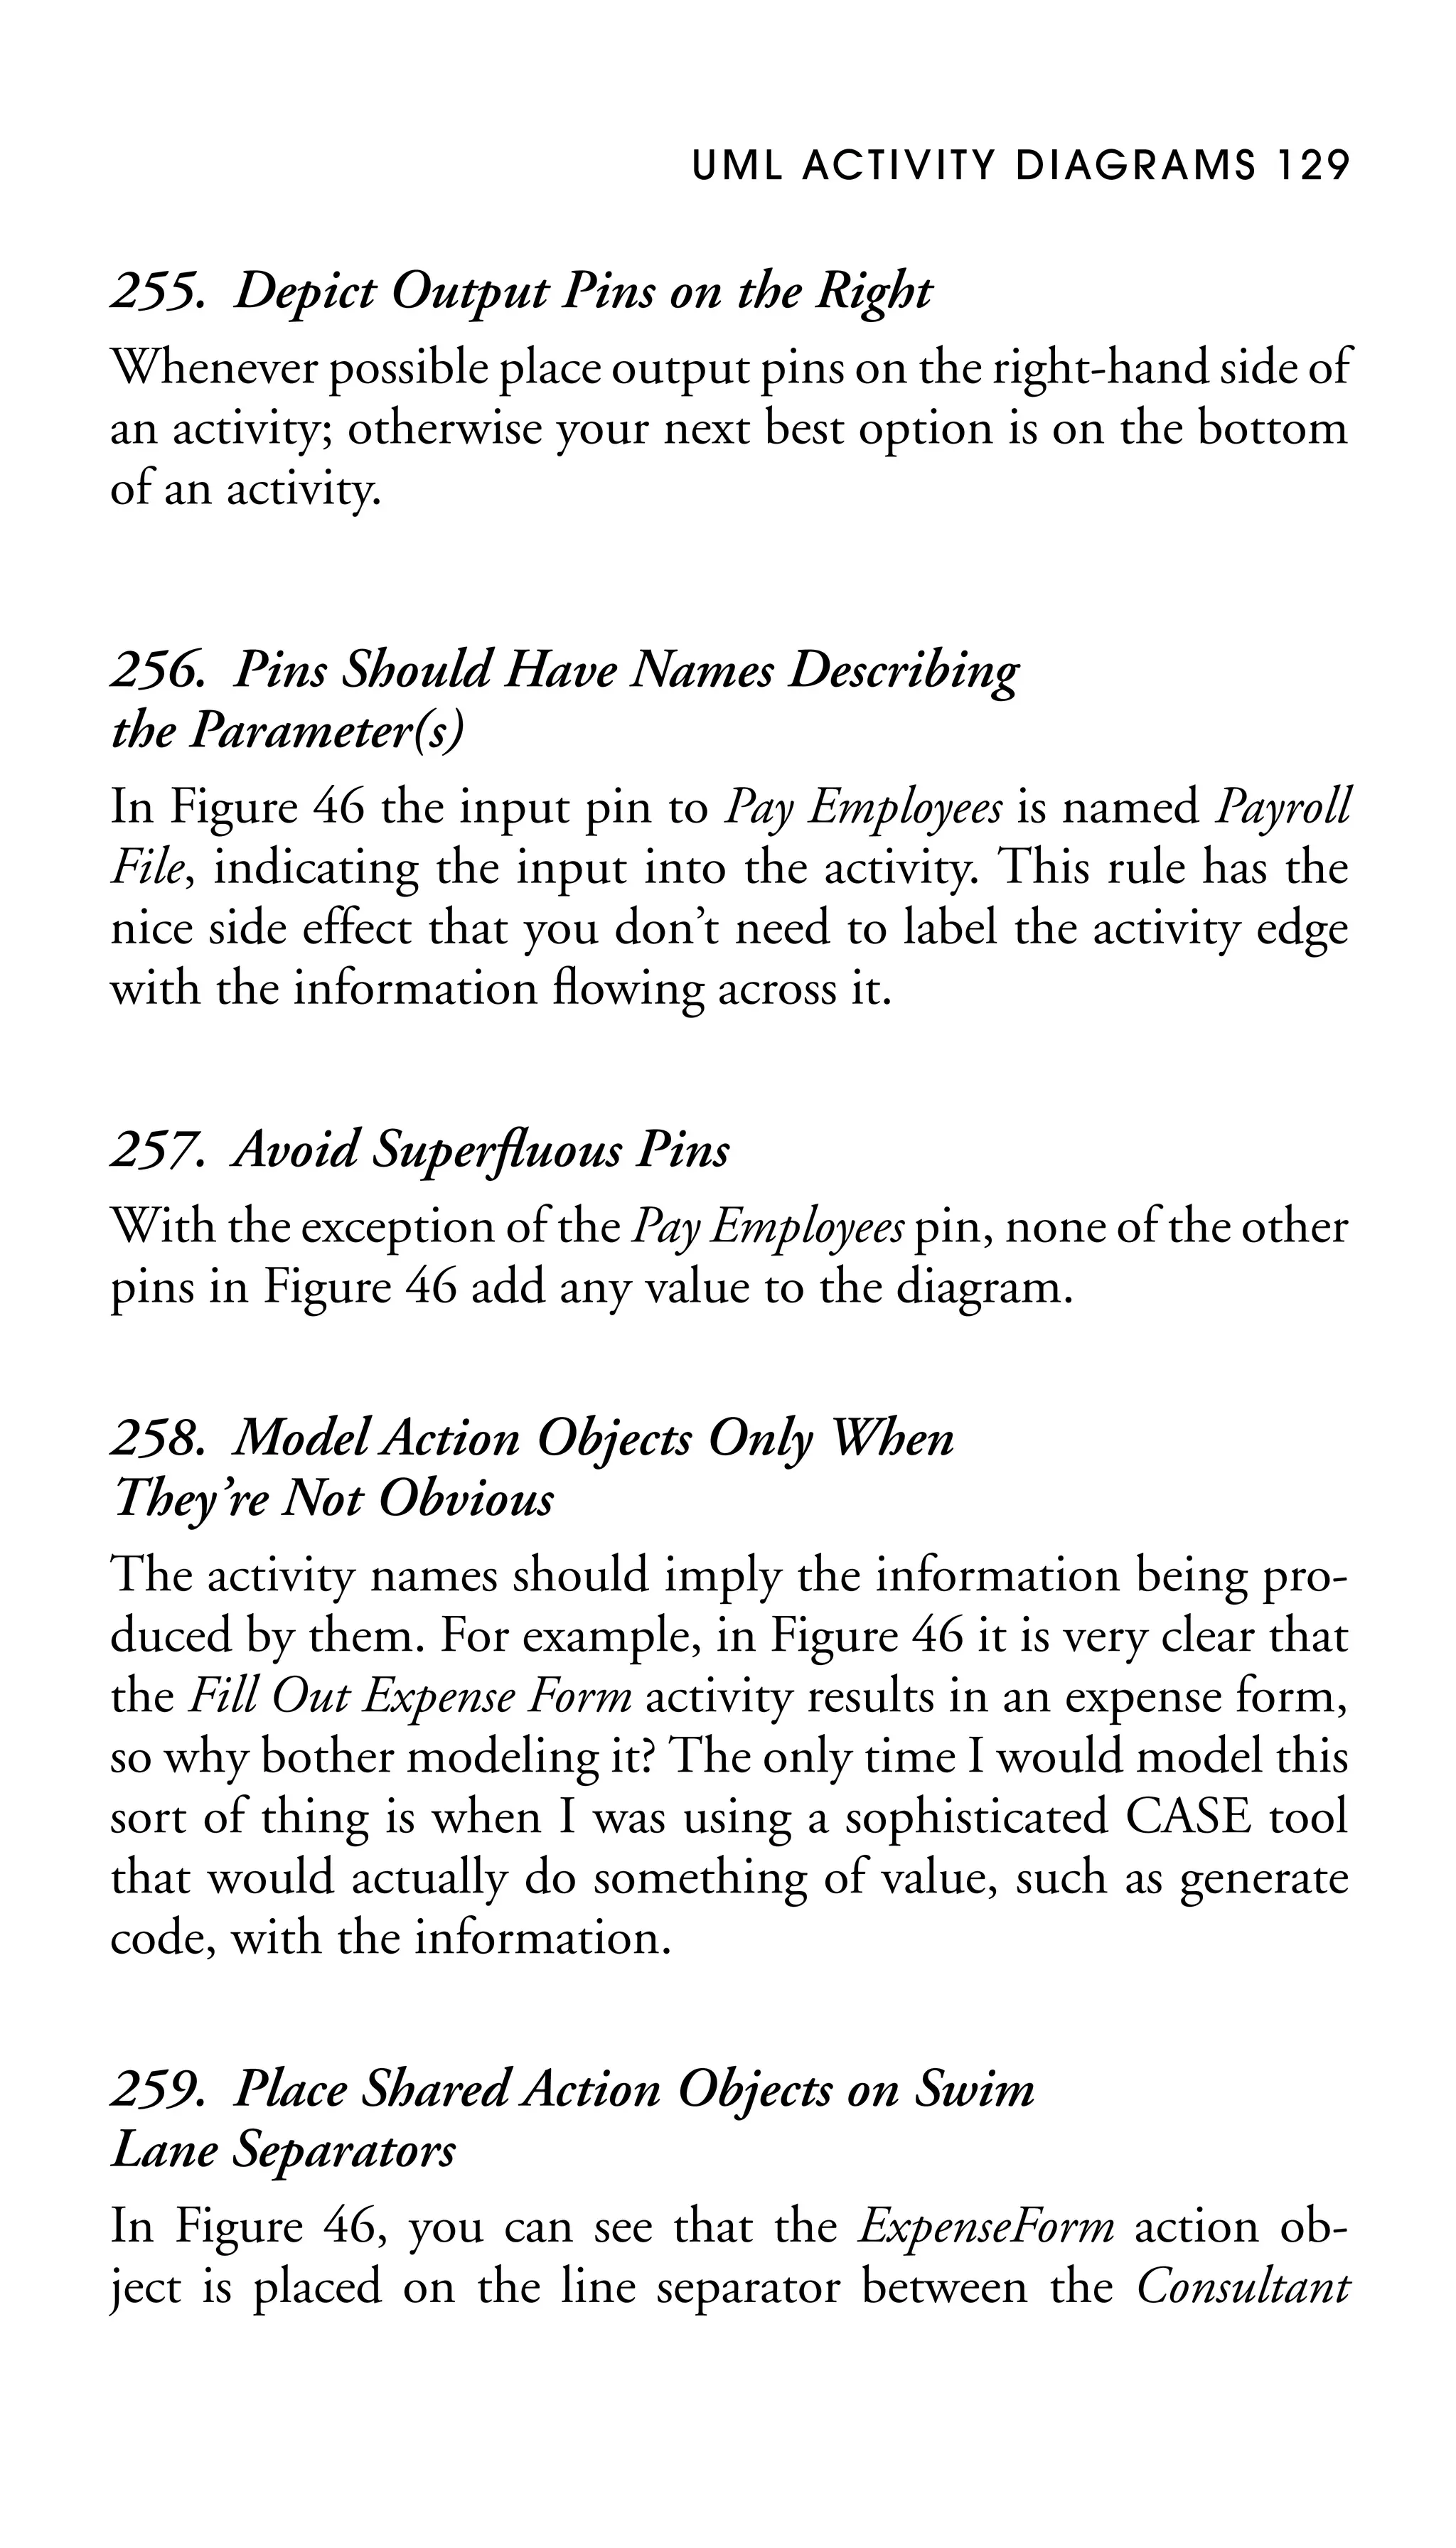
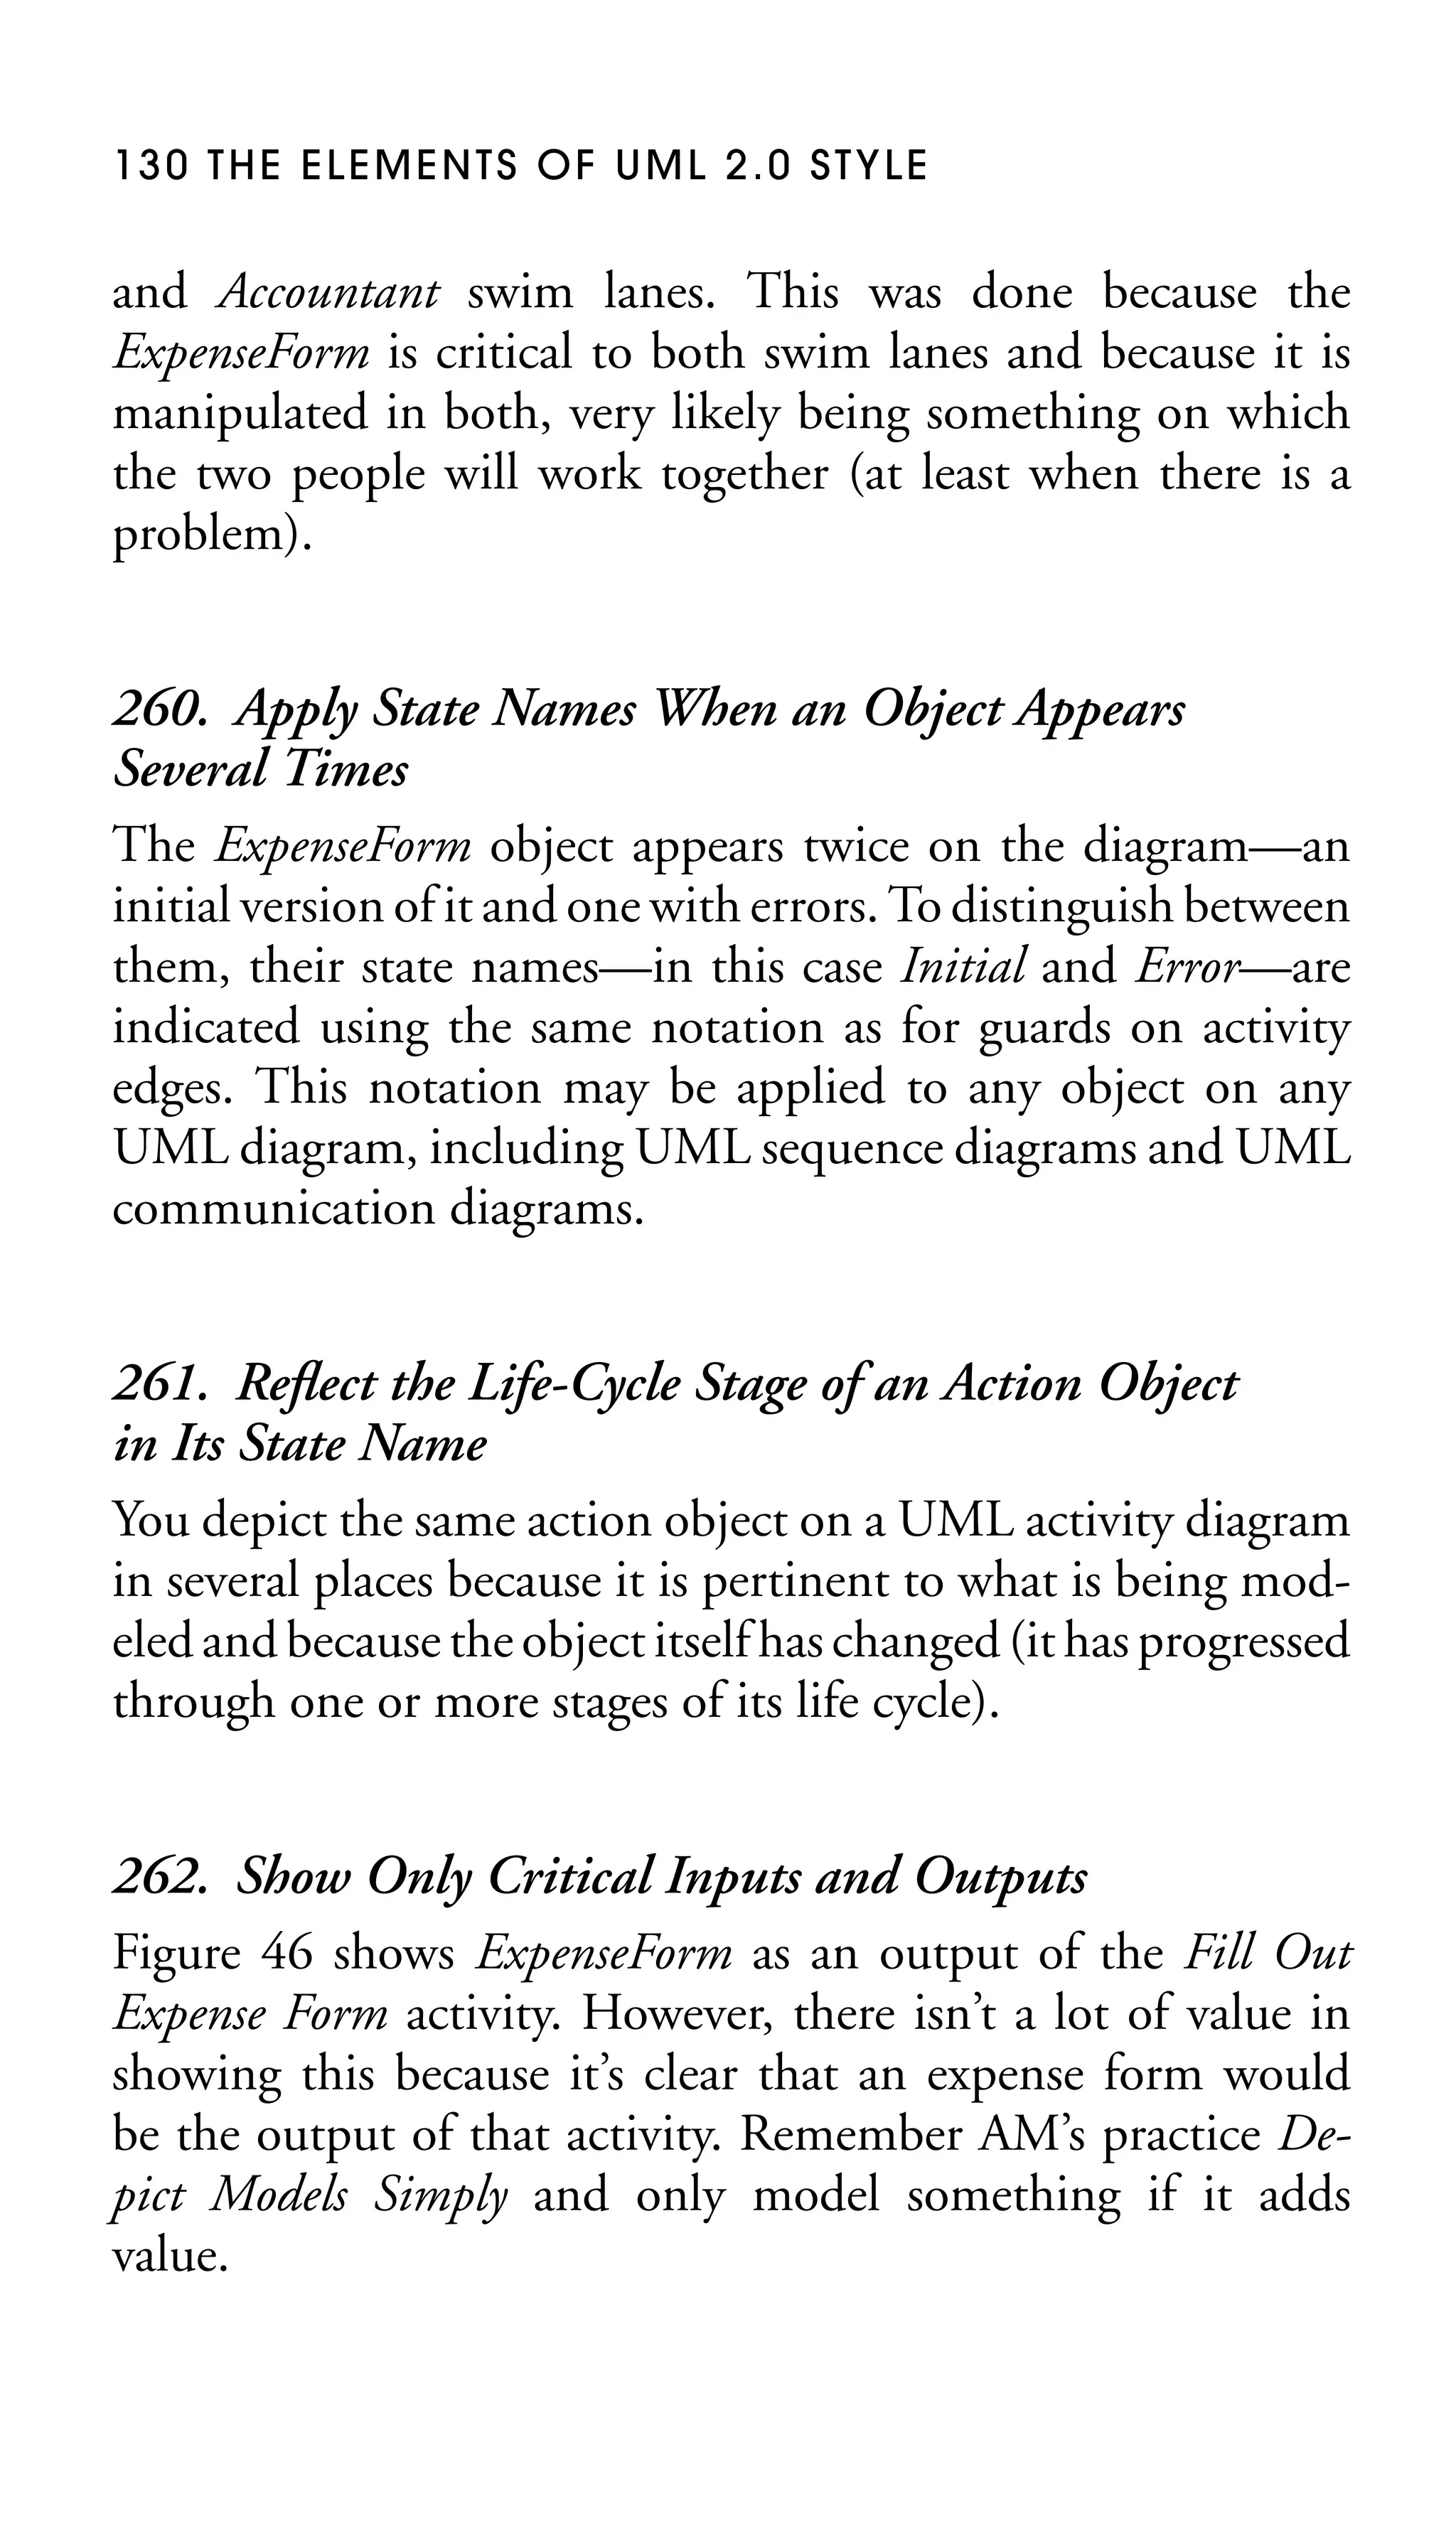
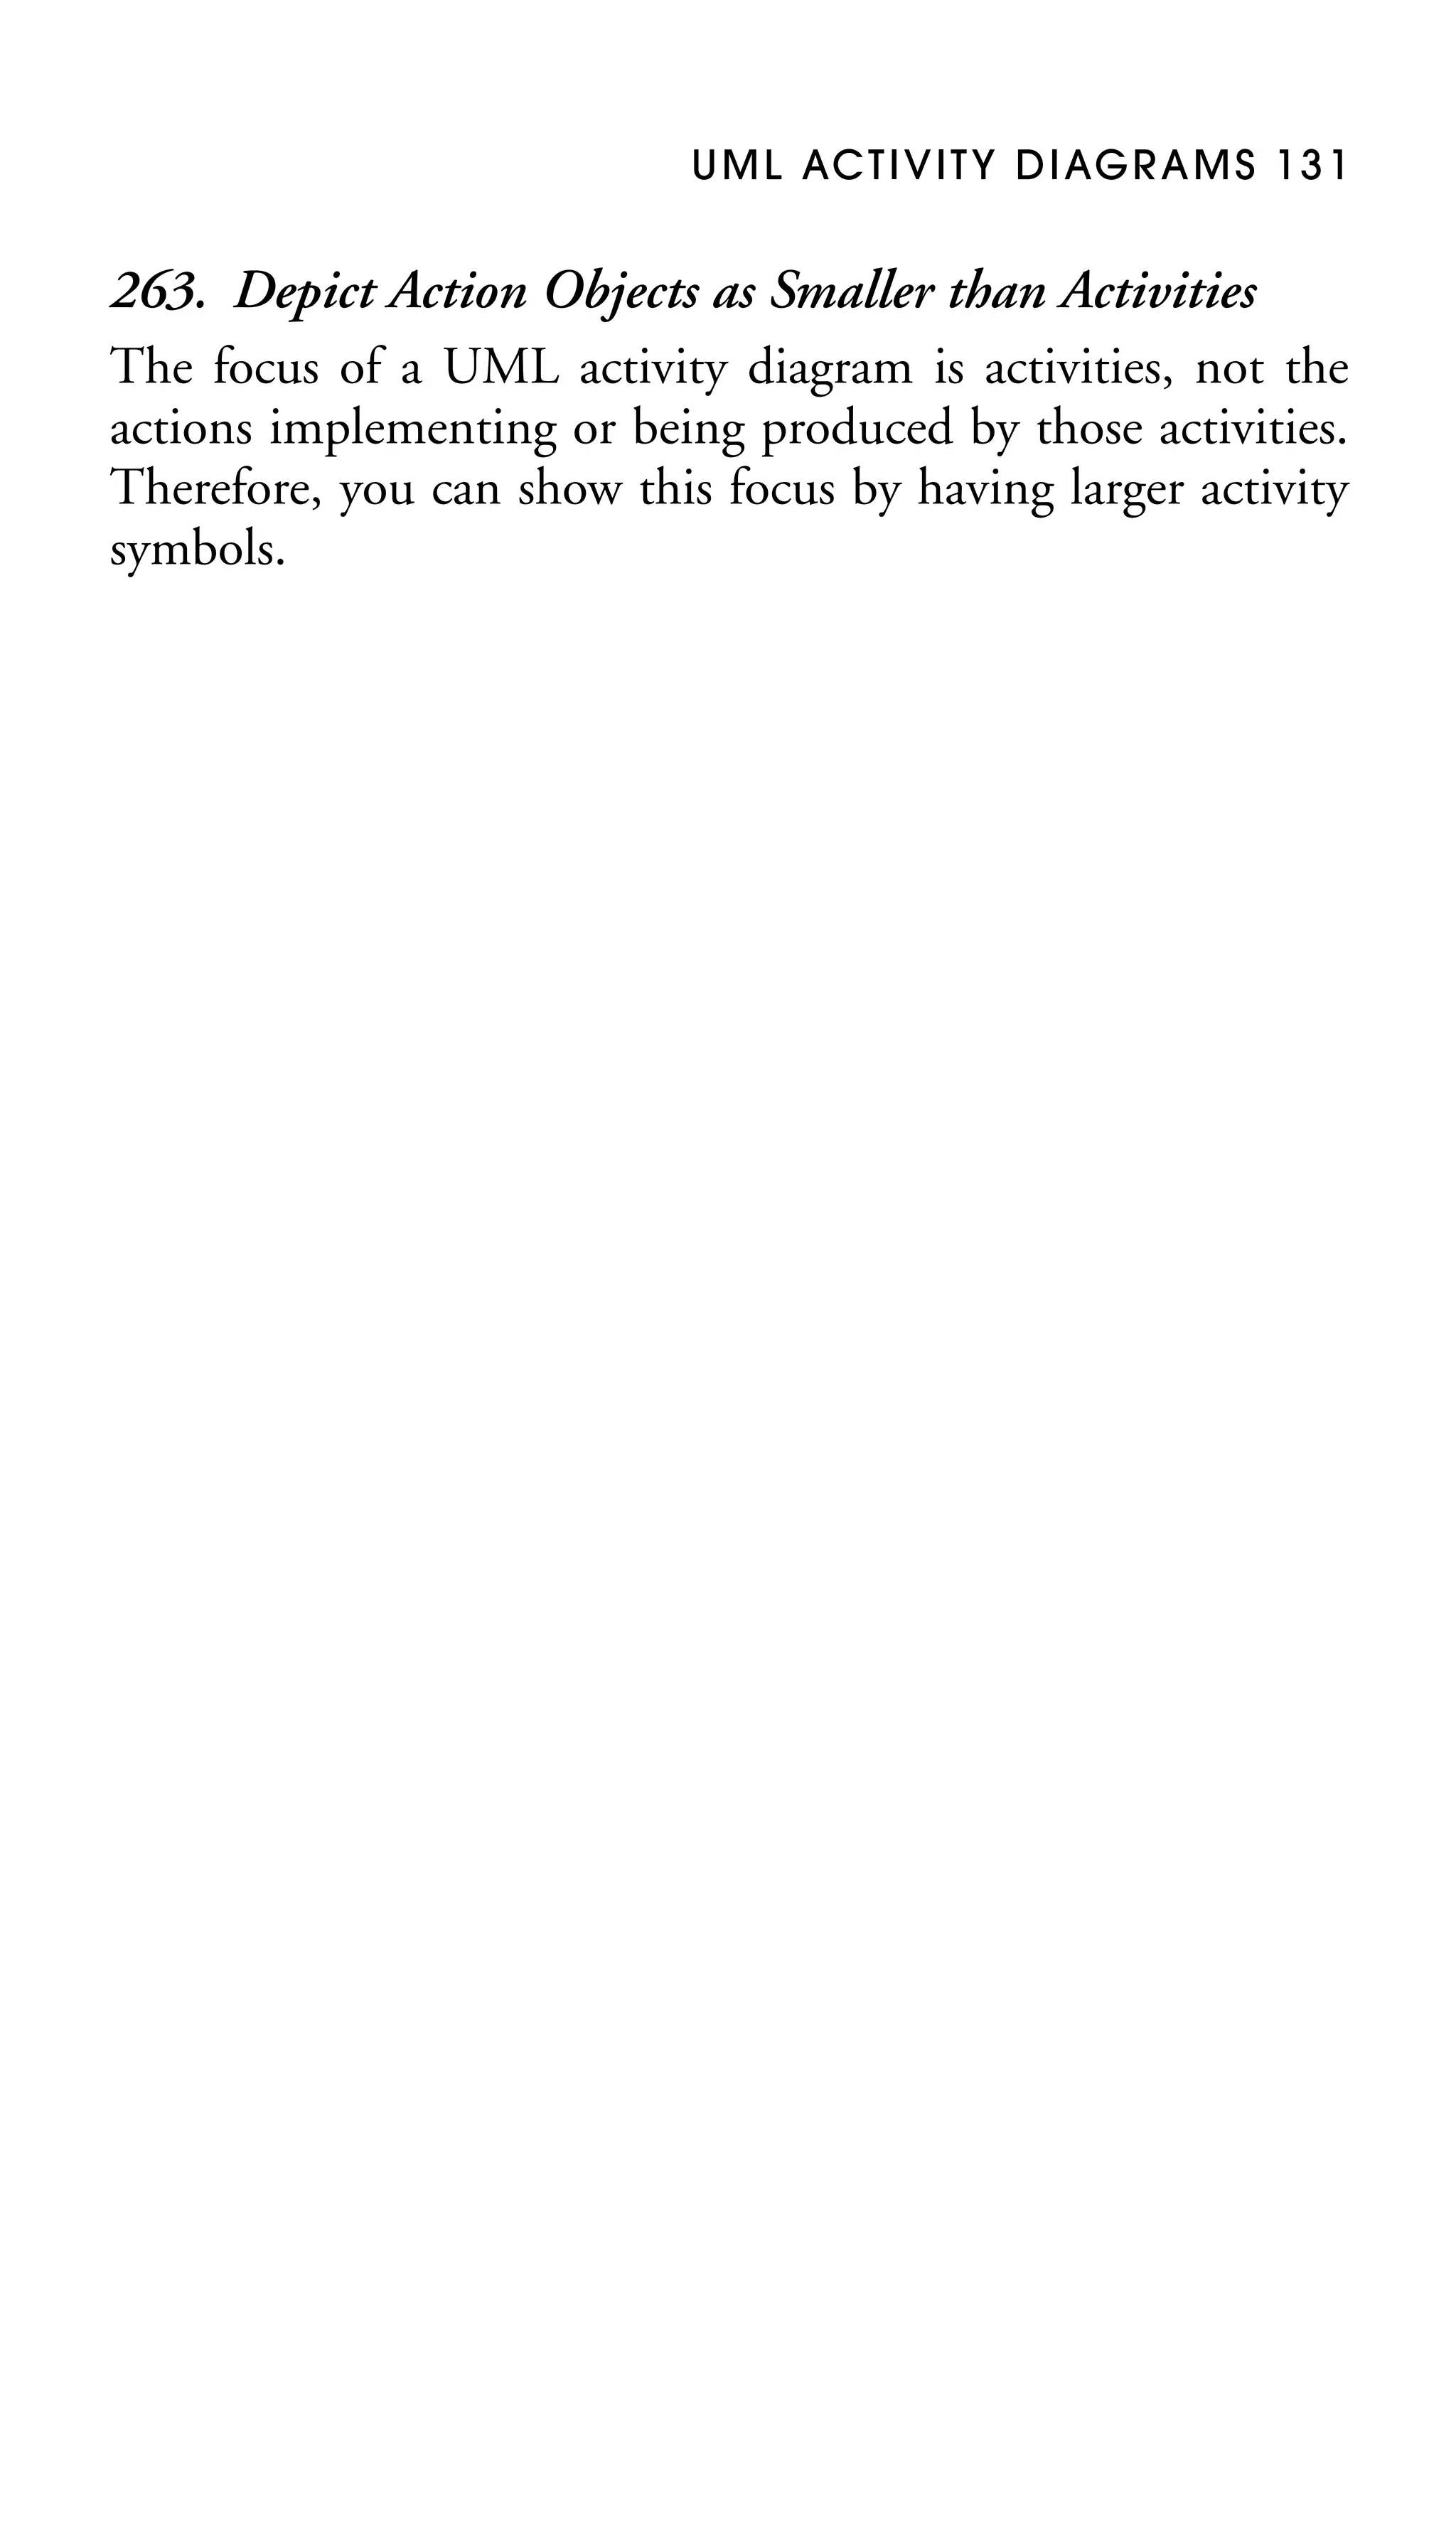
Figure 46. Submitting expenses.
Validate
Expenses
[invalid]
:Expense
Form
[Error]
Pay Employees](https://image.slidesharecdn.com/2005-050521616786theelementsofuml2style-131128083647-phpapp02/75/the-elements-of-uml-2-style-140-2048.jpg)
![155
{0..7
msec}
ref
ref
ref
ref
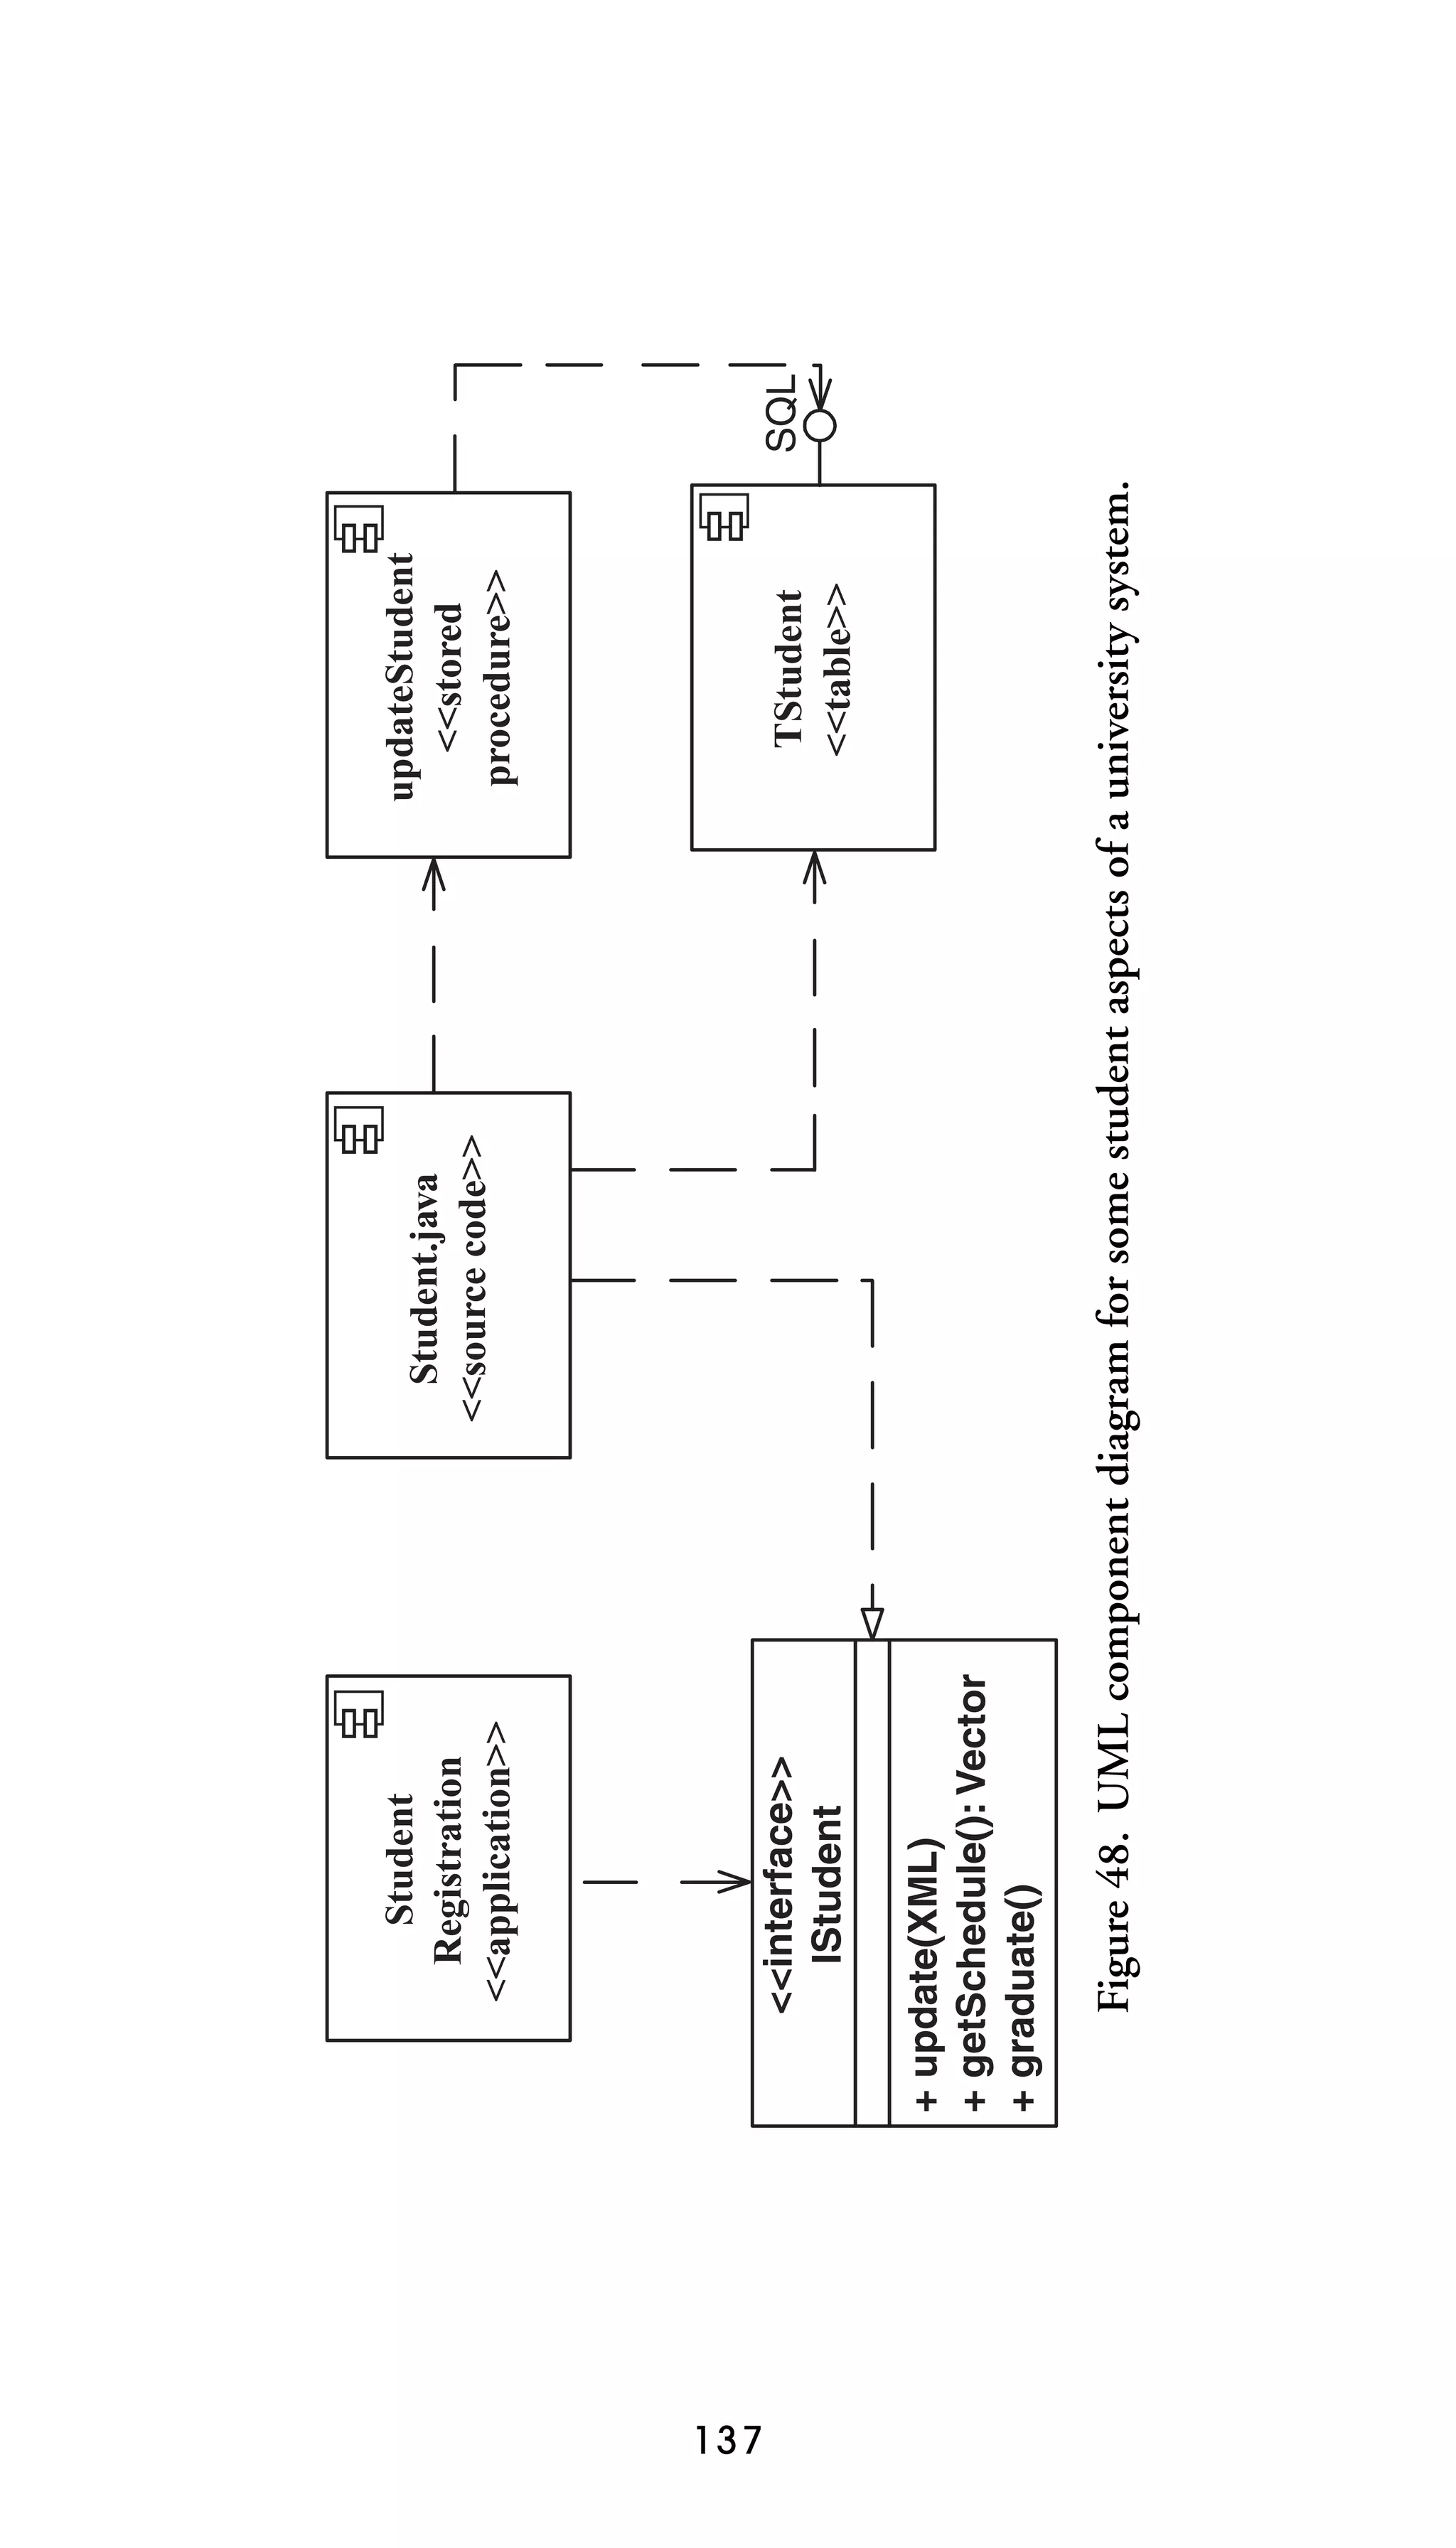
ref
seminar.addToWaitingList(student)
[Seat available]
[No seat]
[Eligible]
[Ineligible]
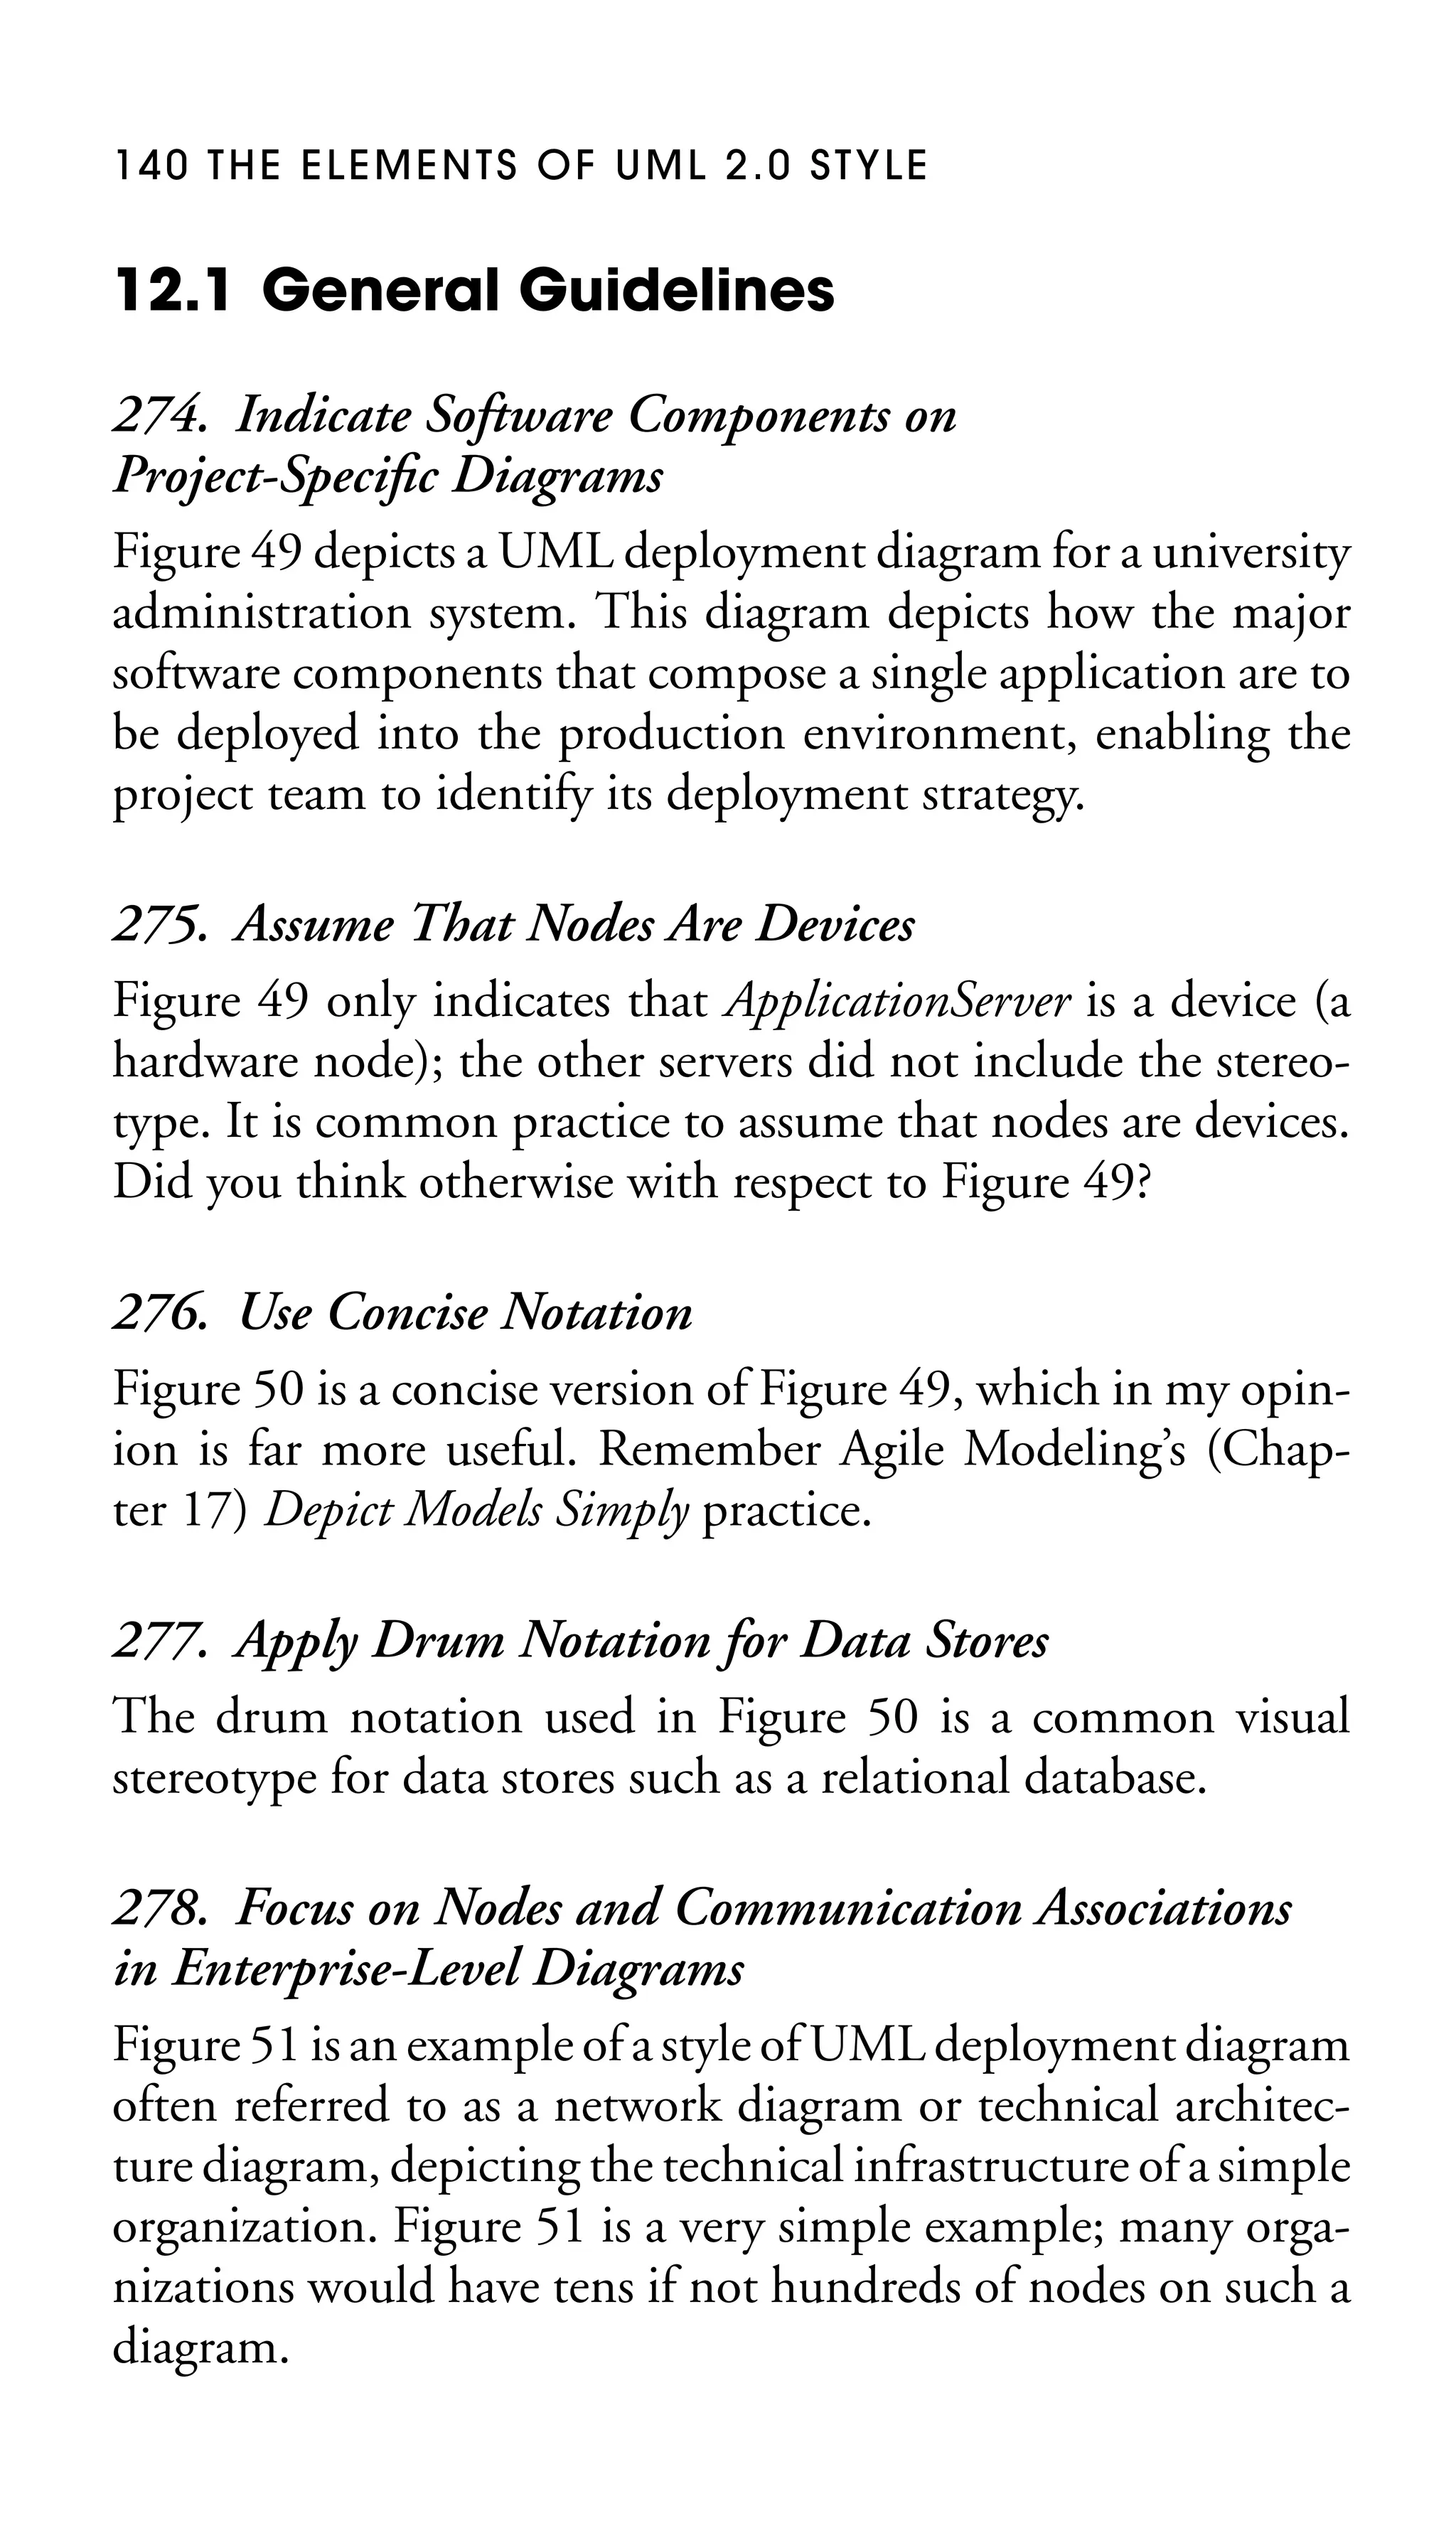
Figure 56. Concise interaction overview diagram.
seminar.enrollStudent(student)
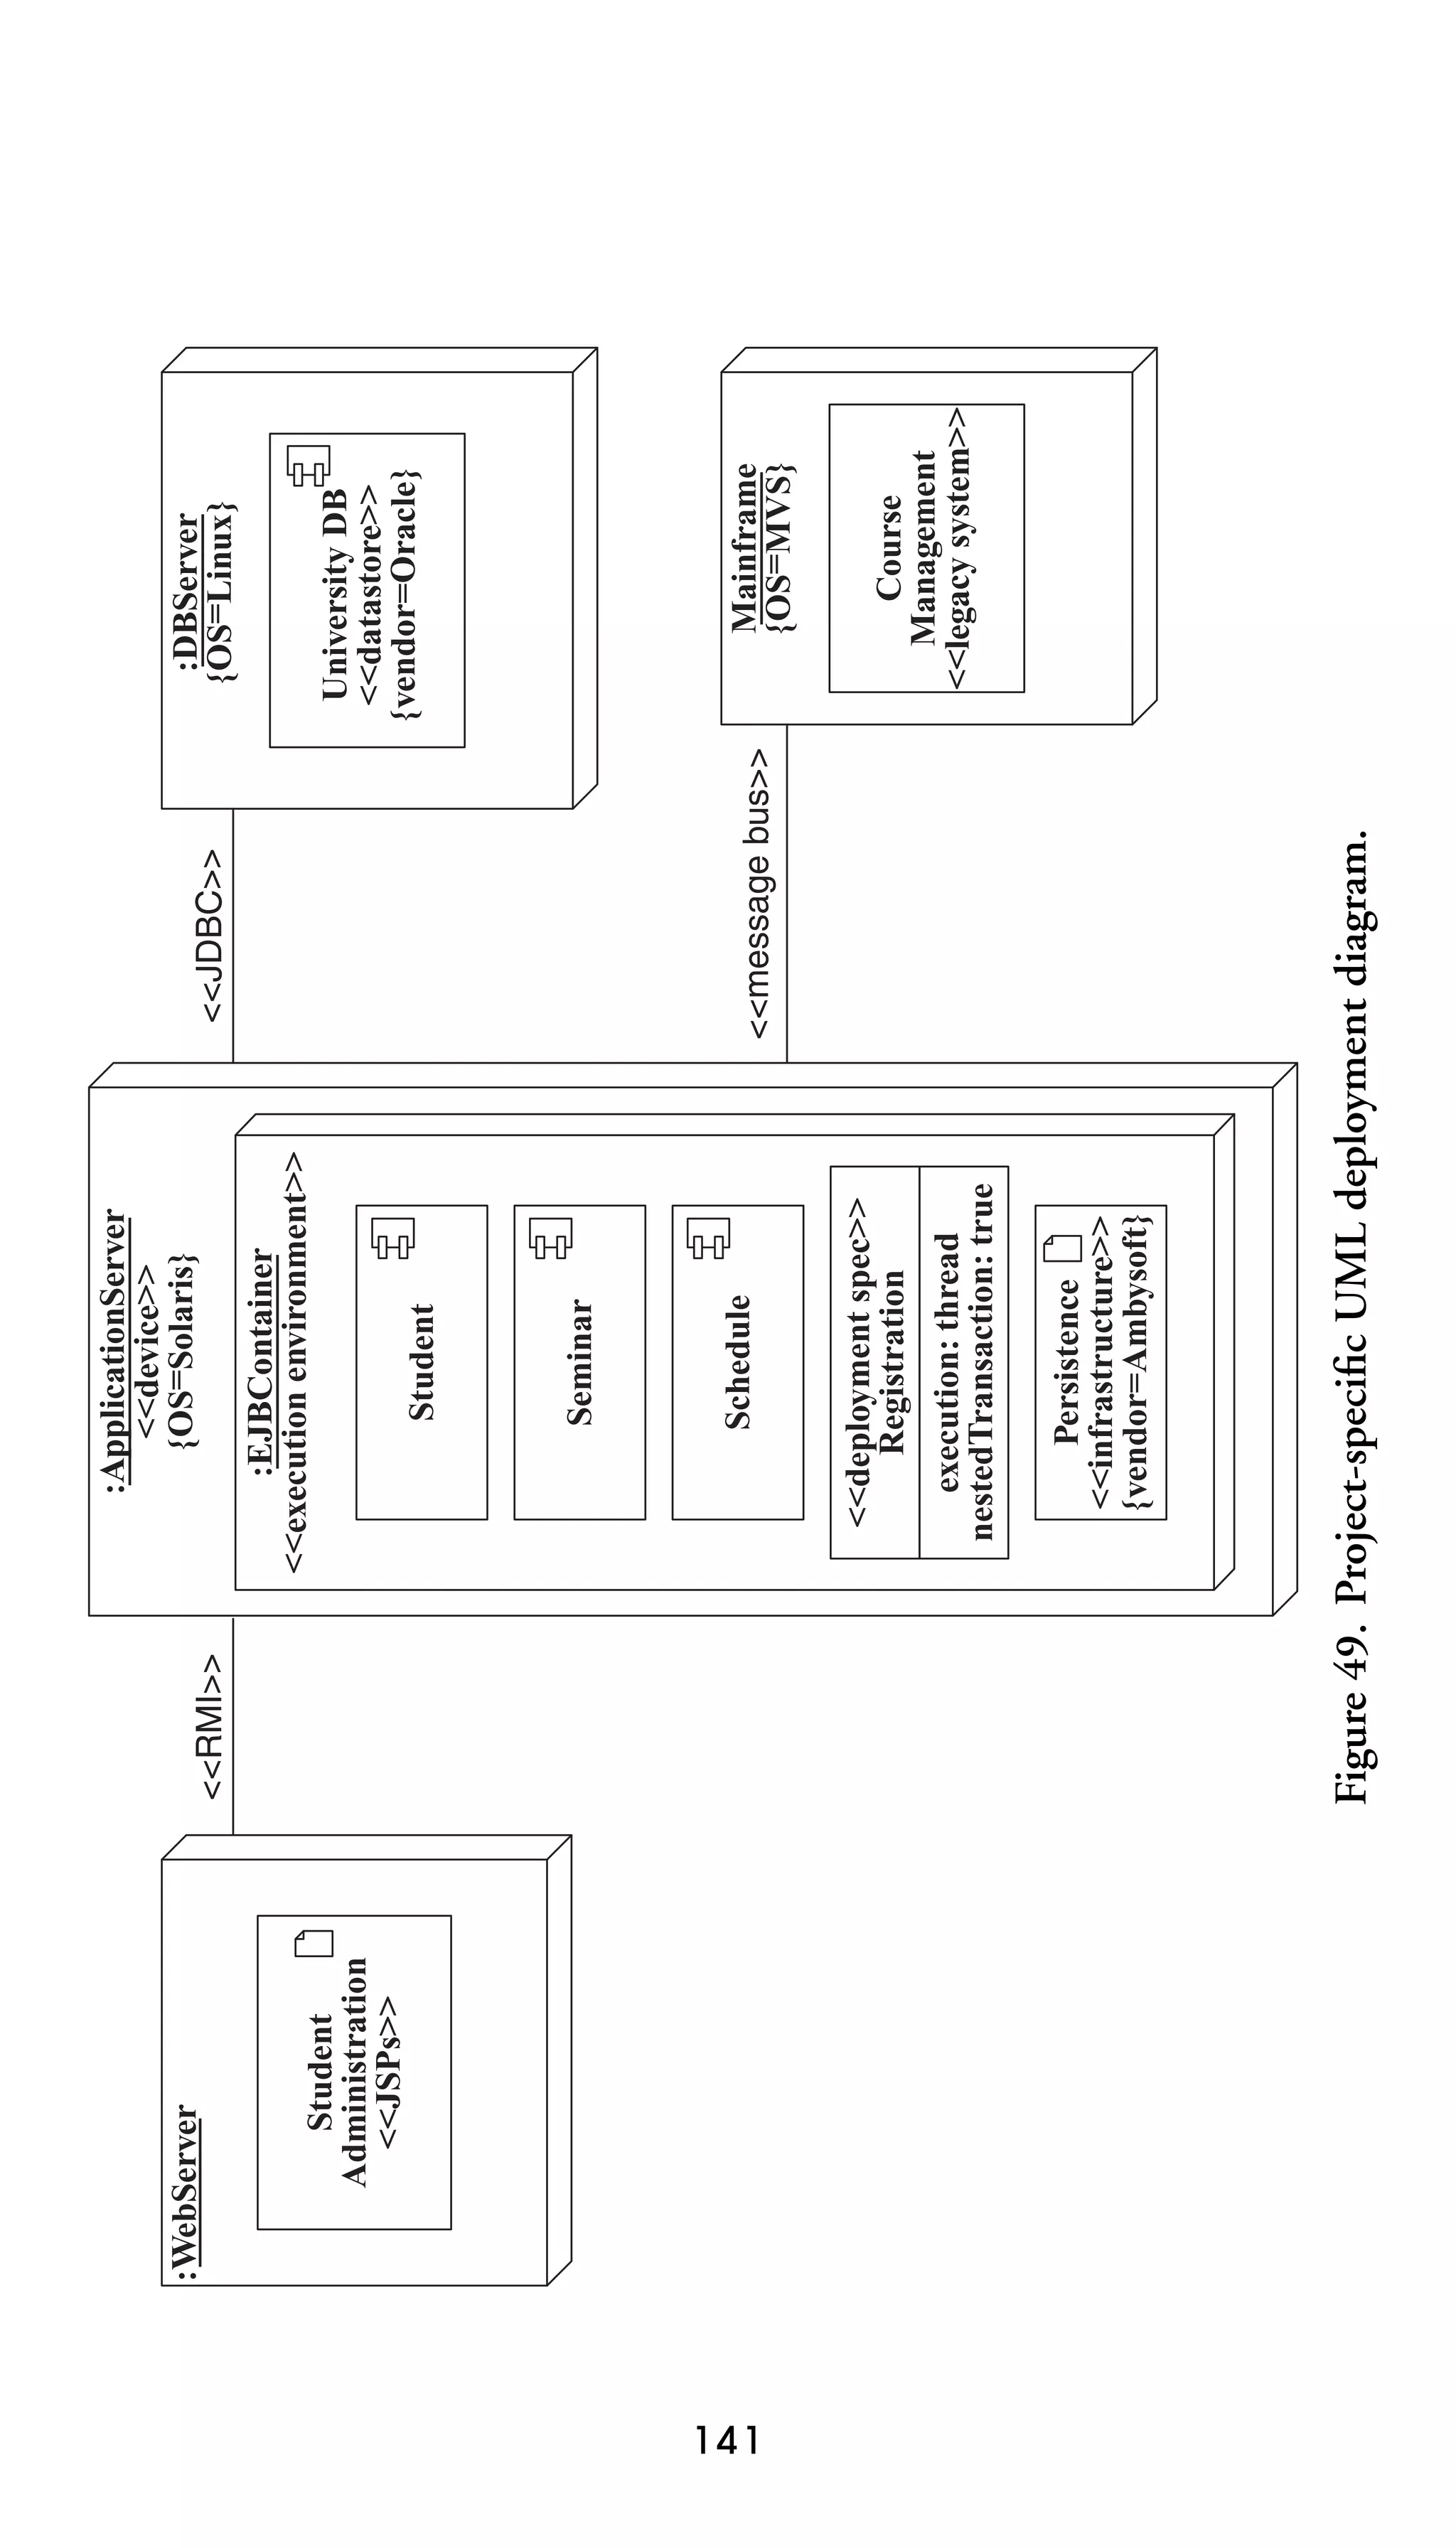
seminar.determineSeatAvailability()
seminar.determineEligibility(student)
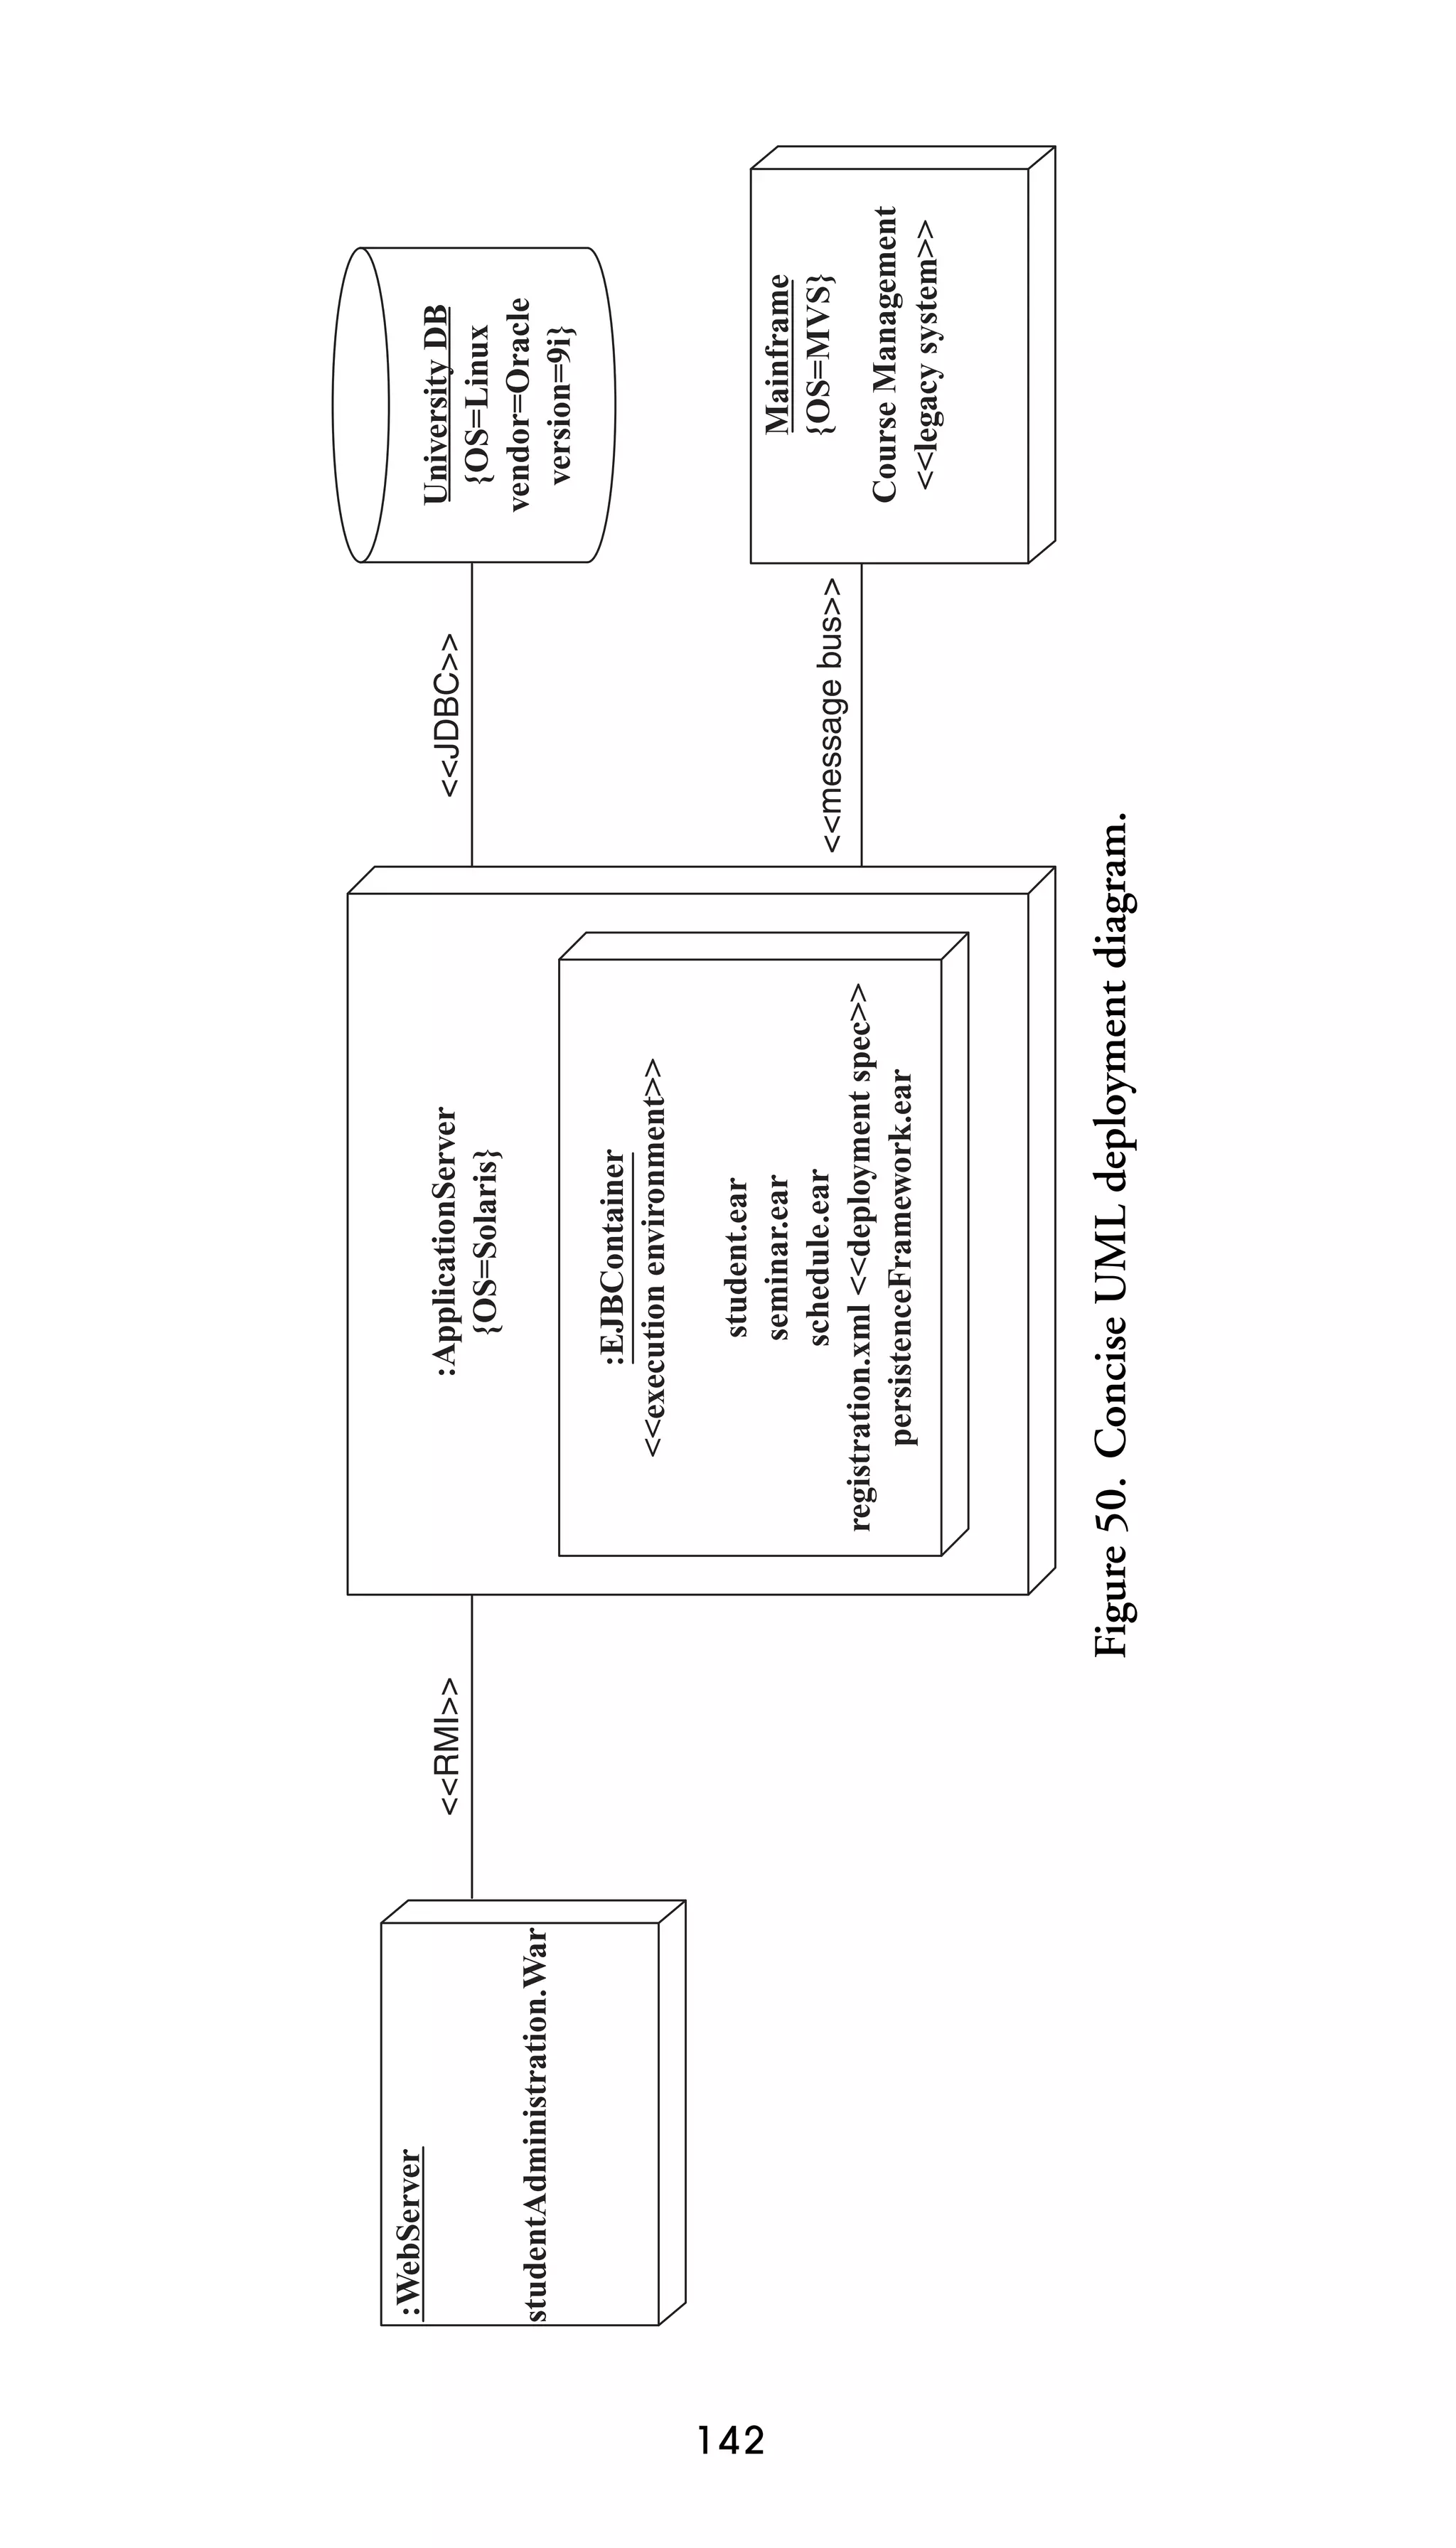
student.selectSeminar()
sd Enroll in Seminar lifelines student: Student, seminar: Seminar](https://image.slidesharecdn.com/2005-050521616786theelementsofuml2style-131128083647-phpapp02/75/the-elements-of-uml-2-style-168-2048.jpg)

![INDEX 181
numbers, labeling
connectors . . . . . . . . . 116
O
object diagrams . . . . . . 148–149,
152
object identifier (OID) . . . . . . 60
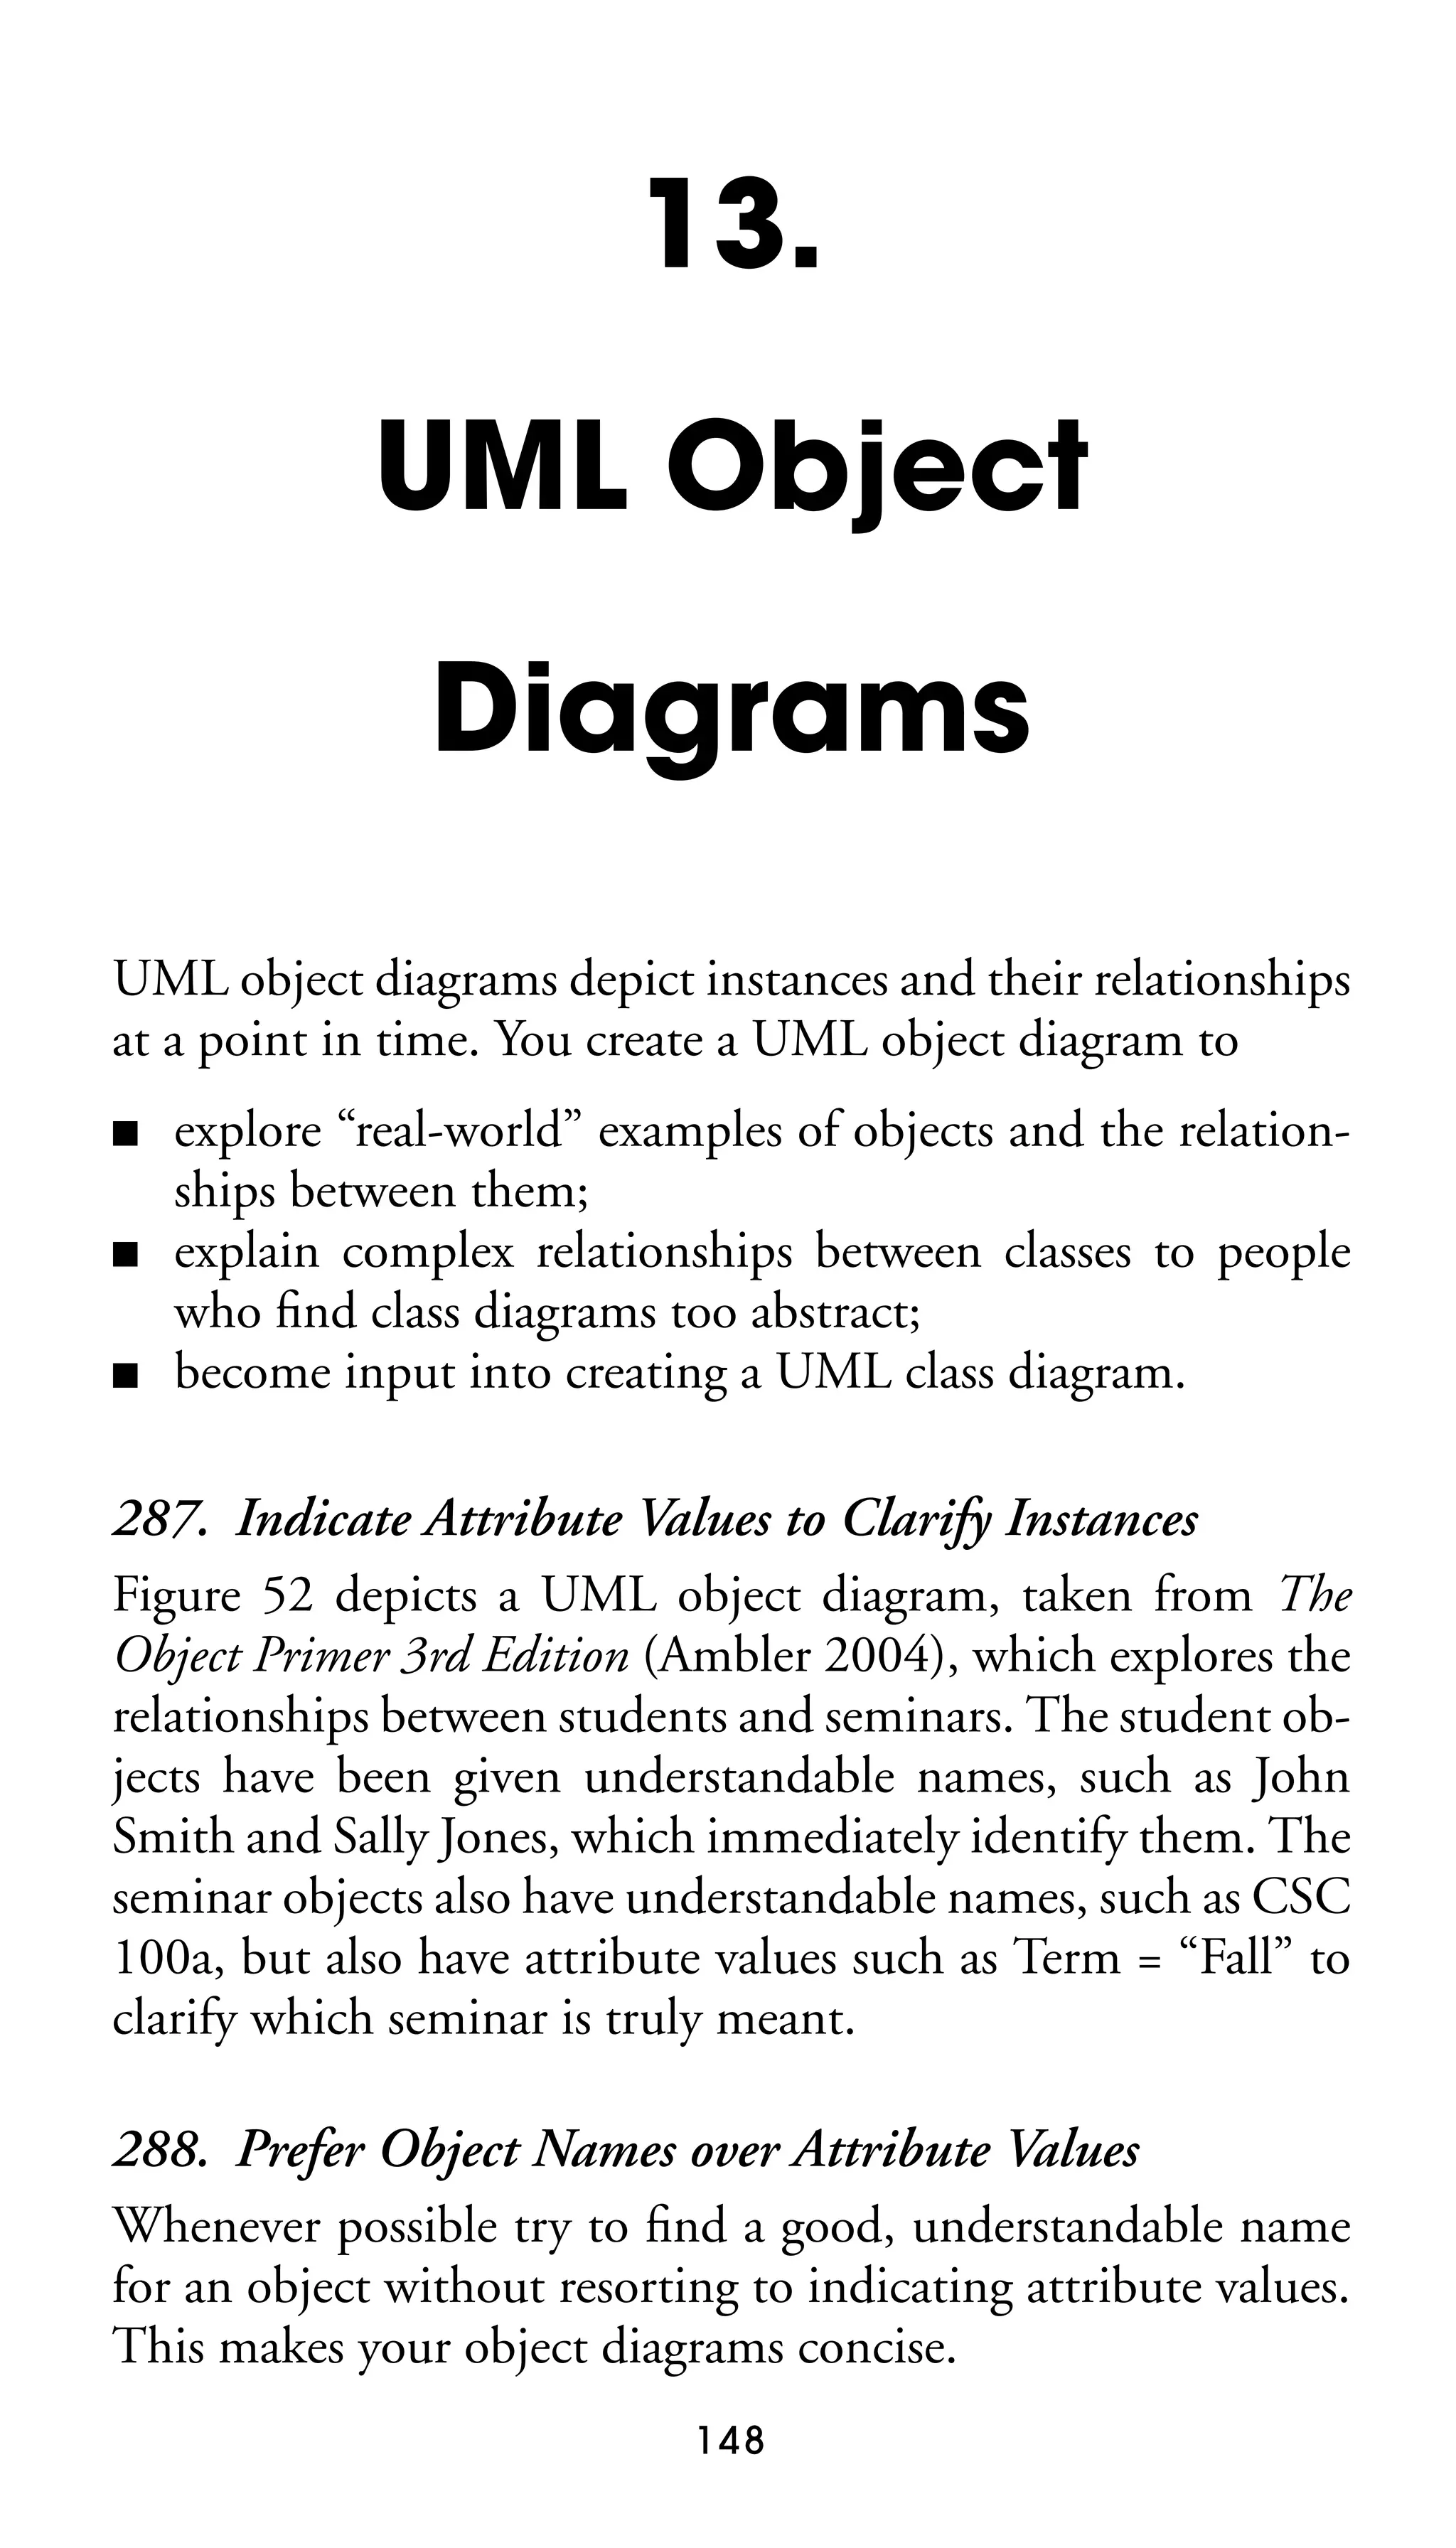
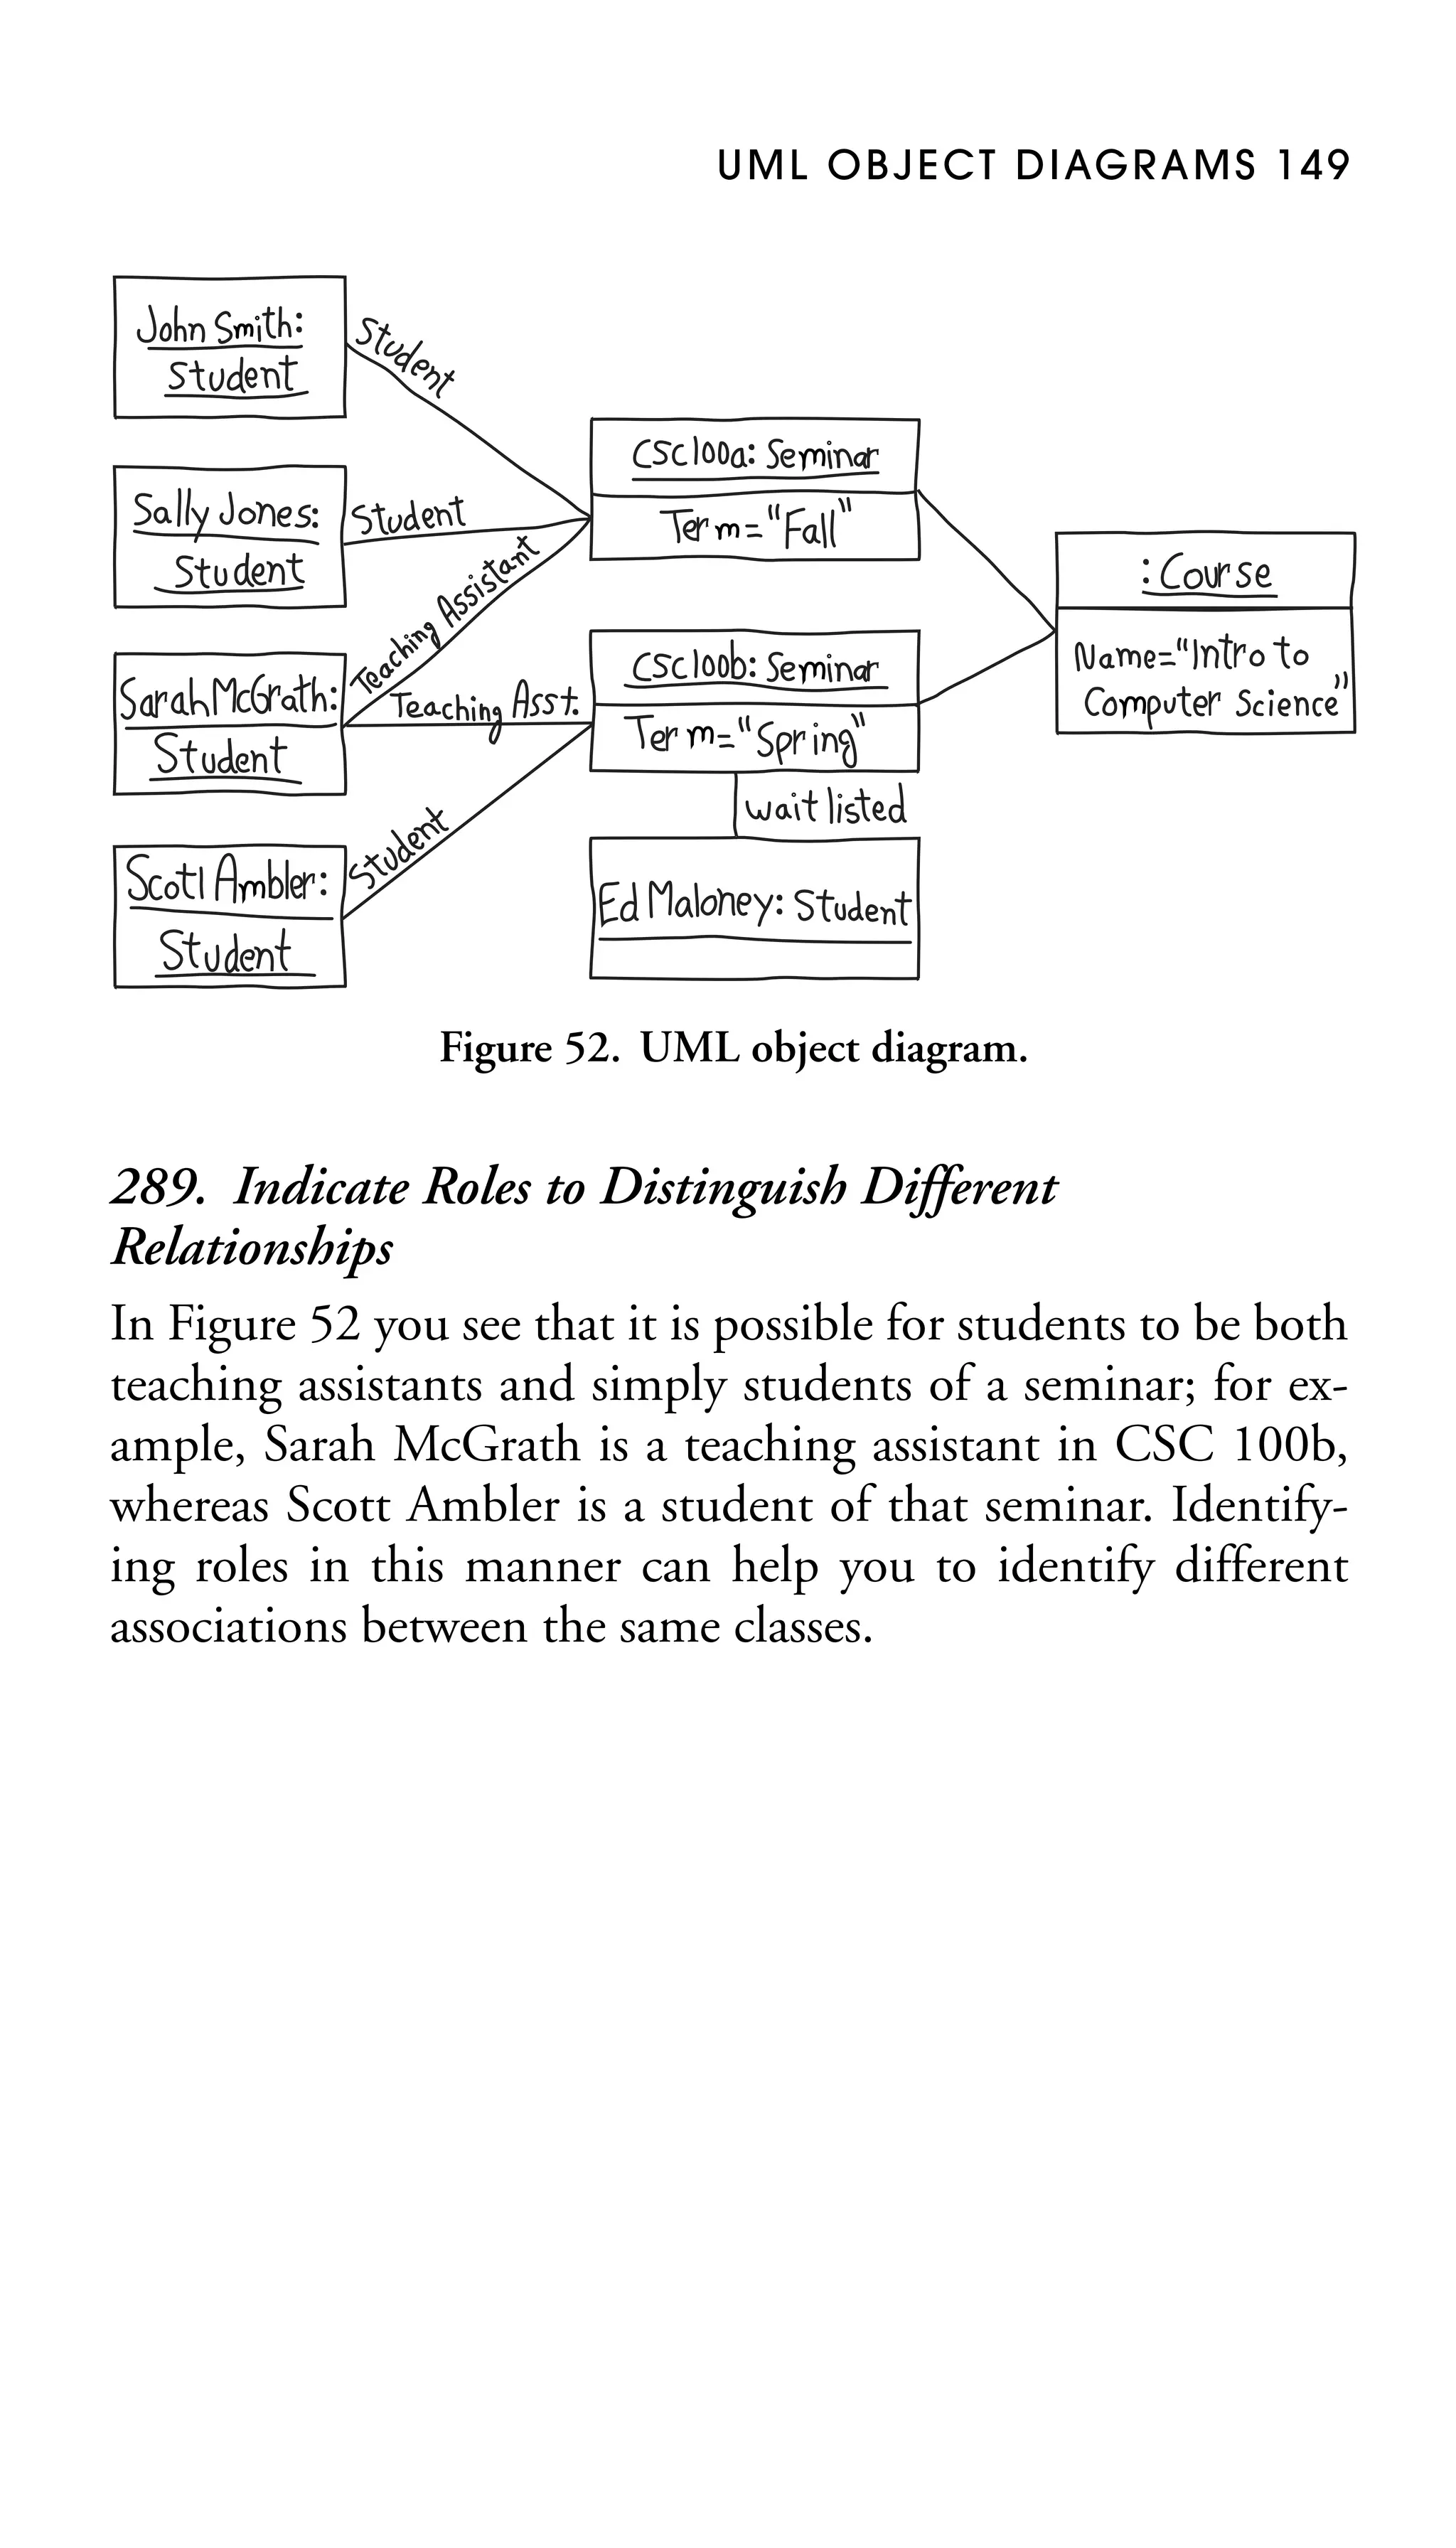
object-oriented design . . . . . . .80
objects
creating directly . . . . . . . . . 90
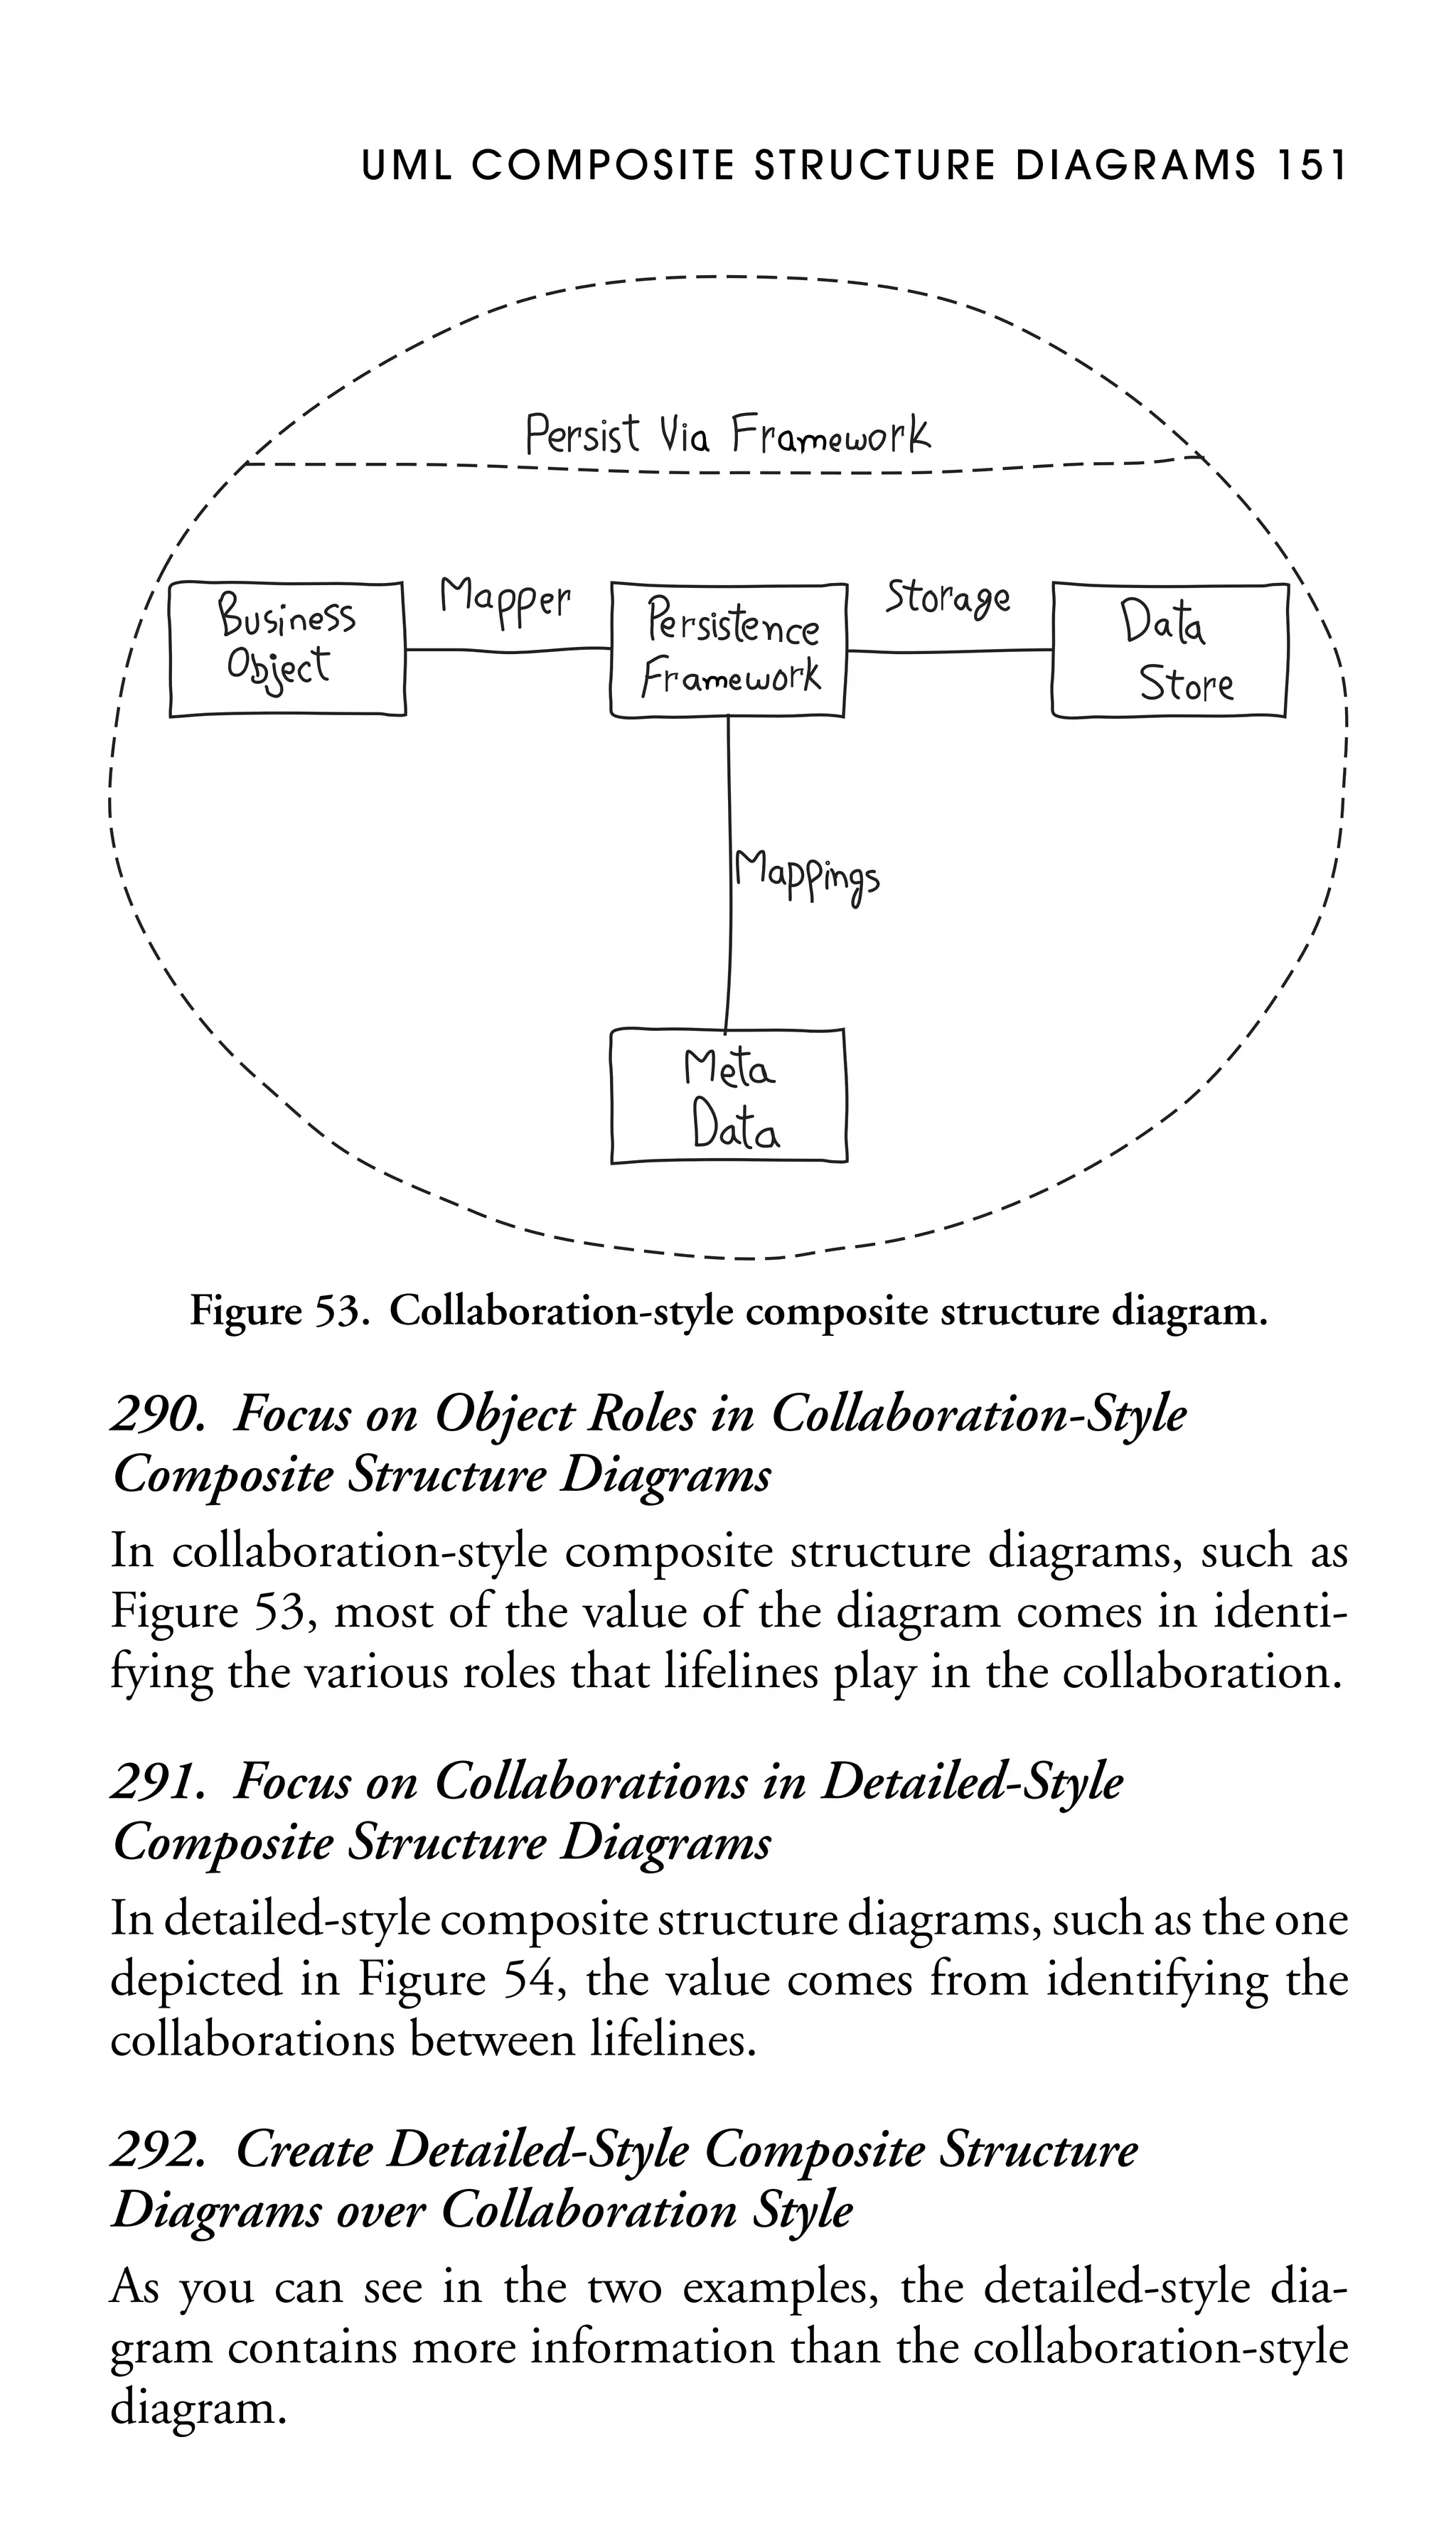
destruction of . . . . . . . . . . . 85
message flow between . . . . 94
naming . . . . . . . . . . . . 86, 148
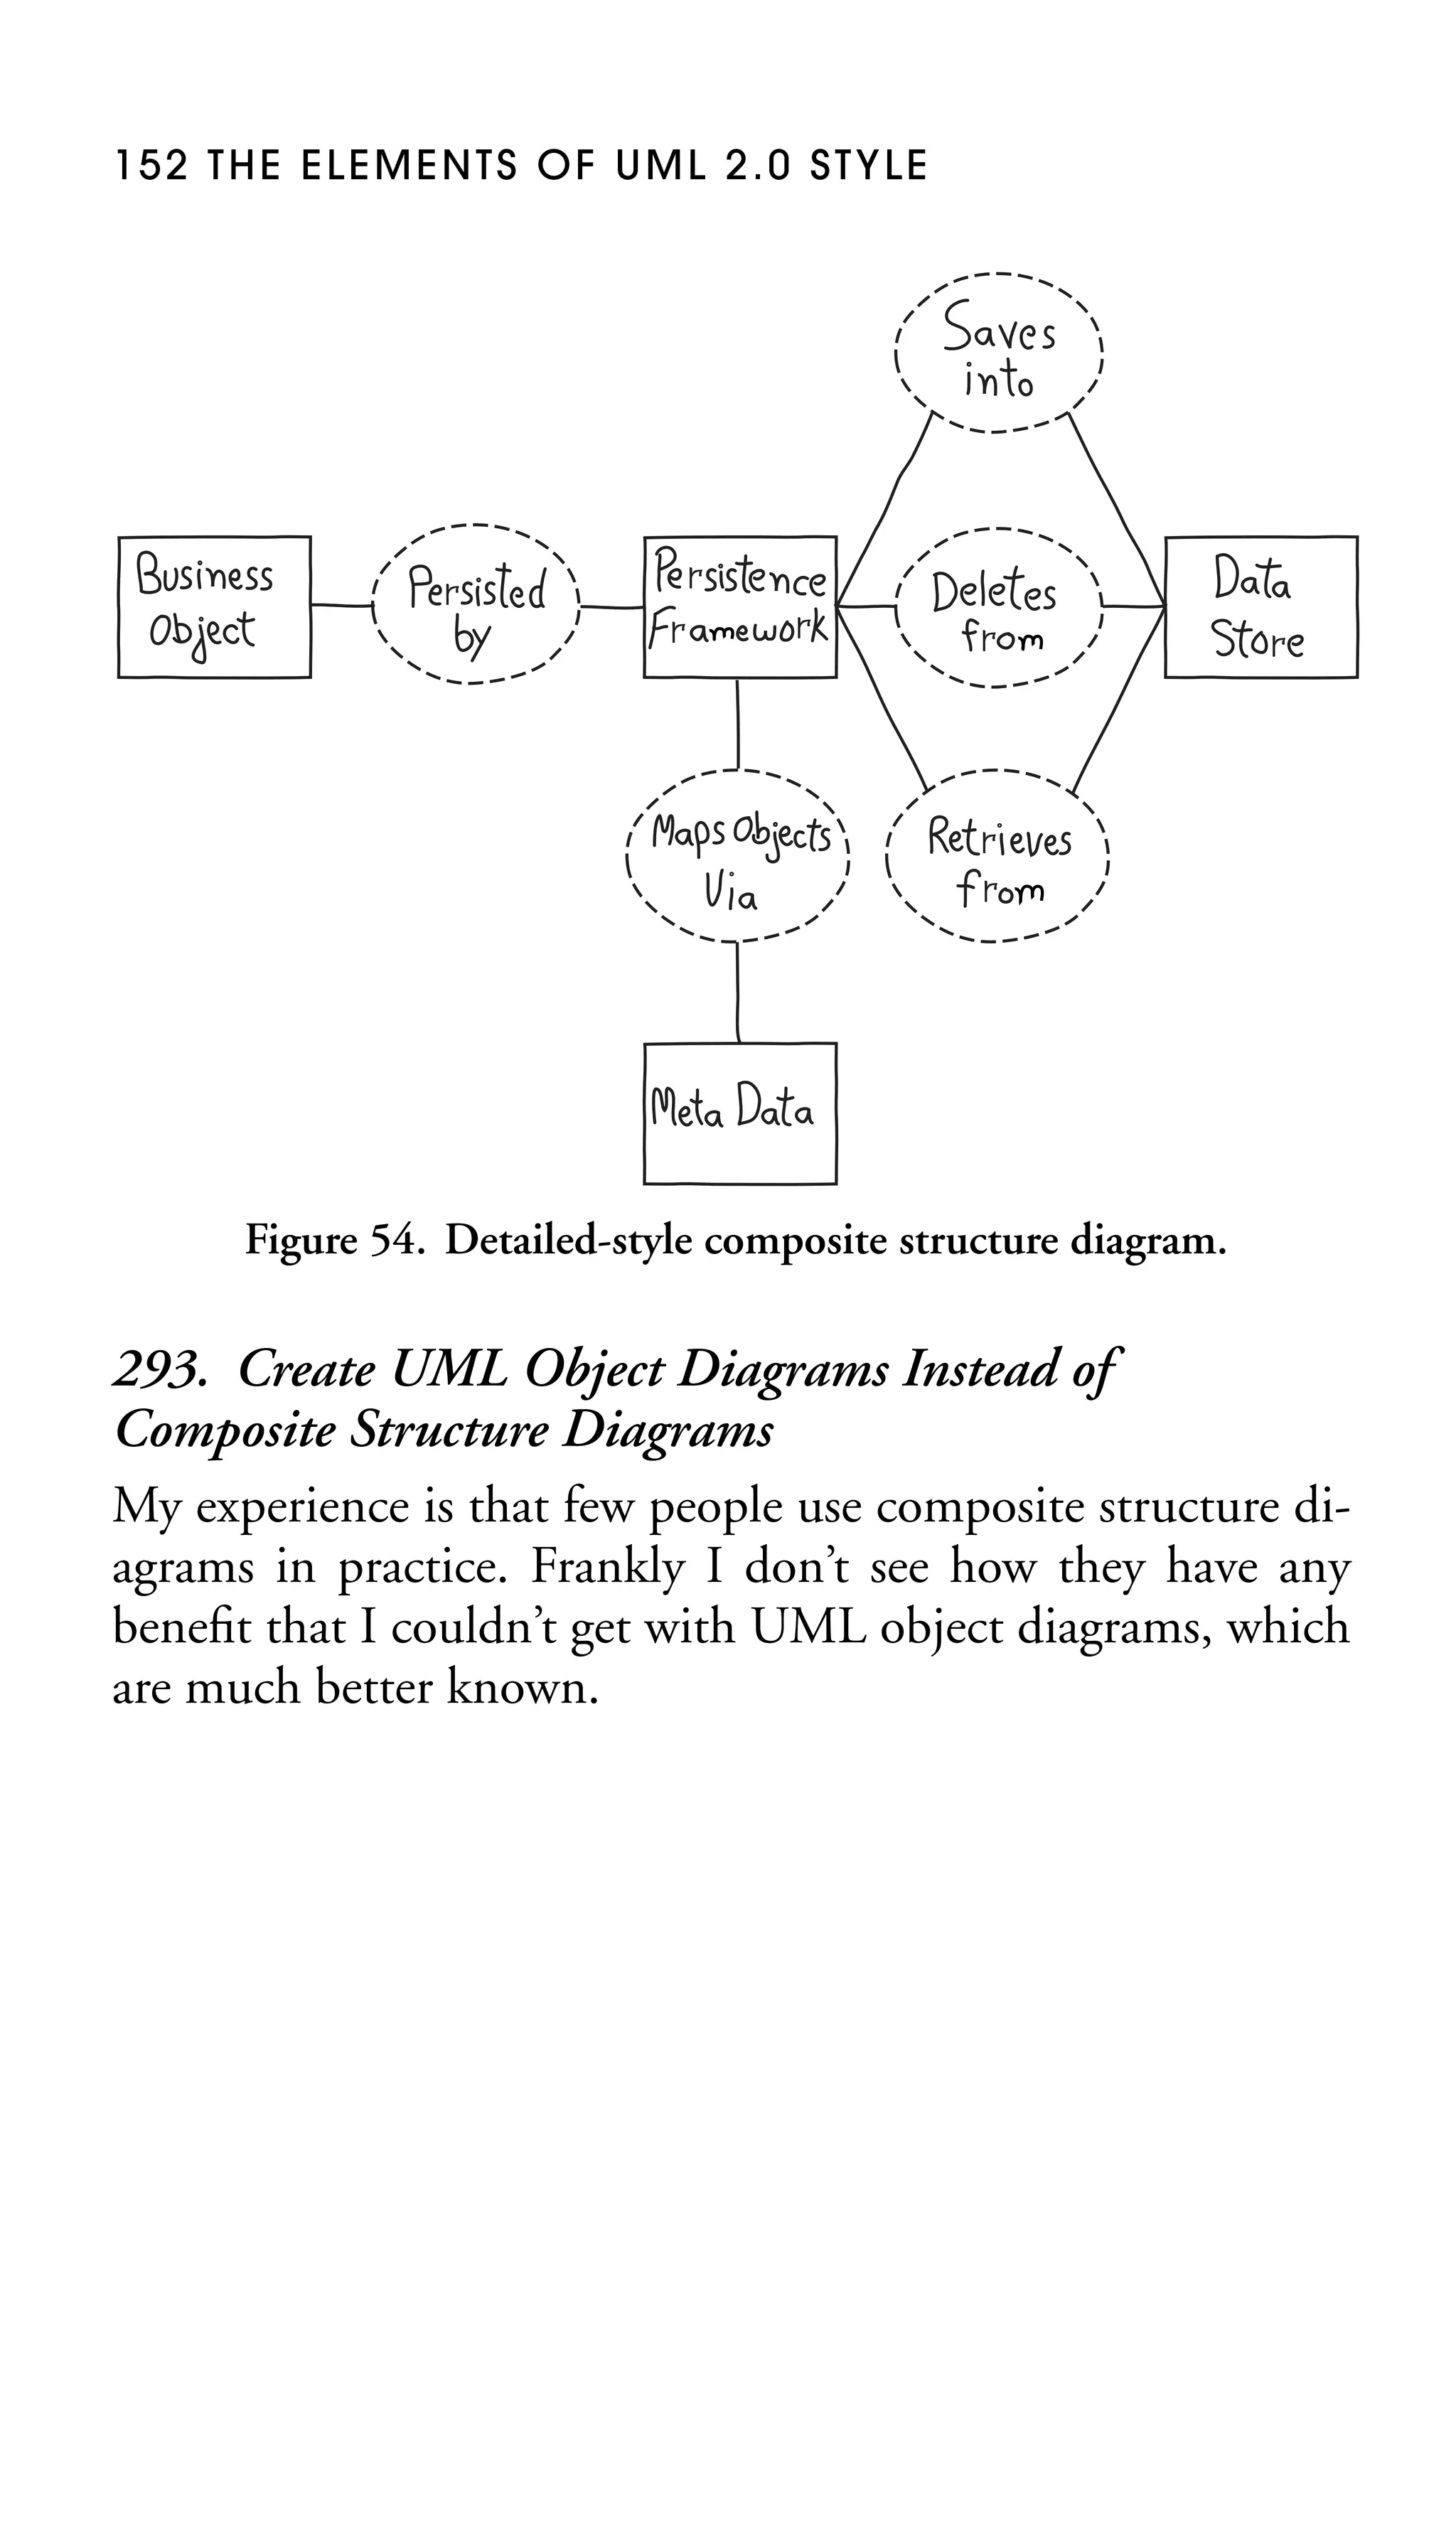
on sequence diagrams . . . 86
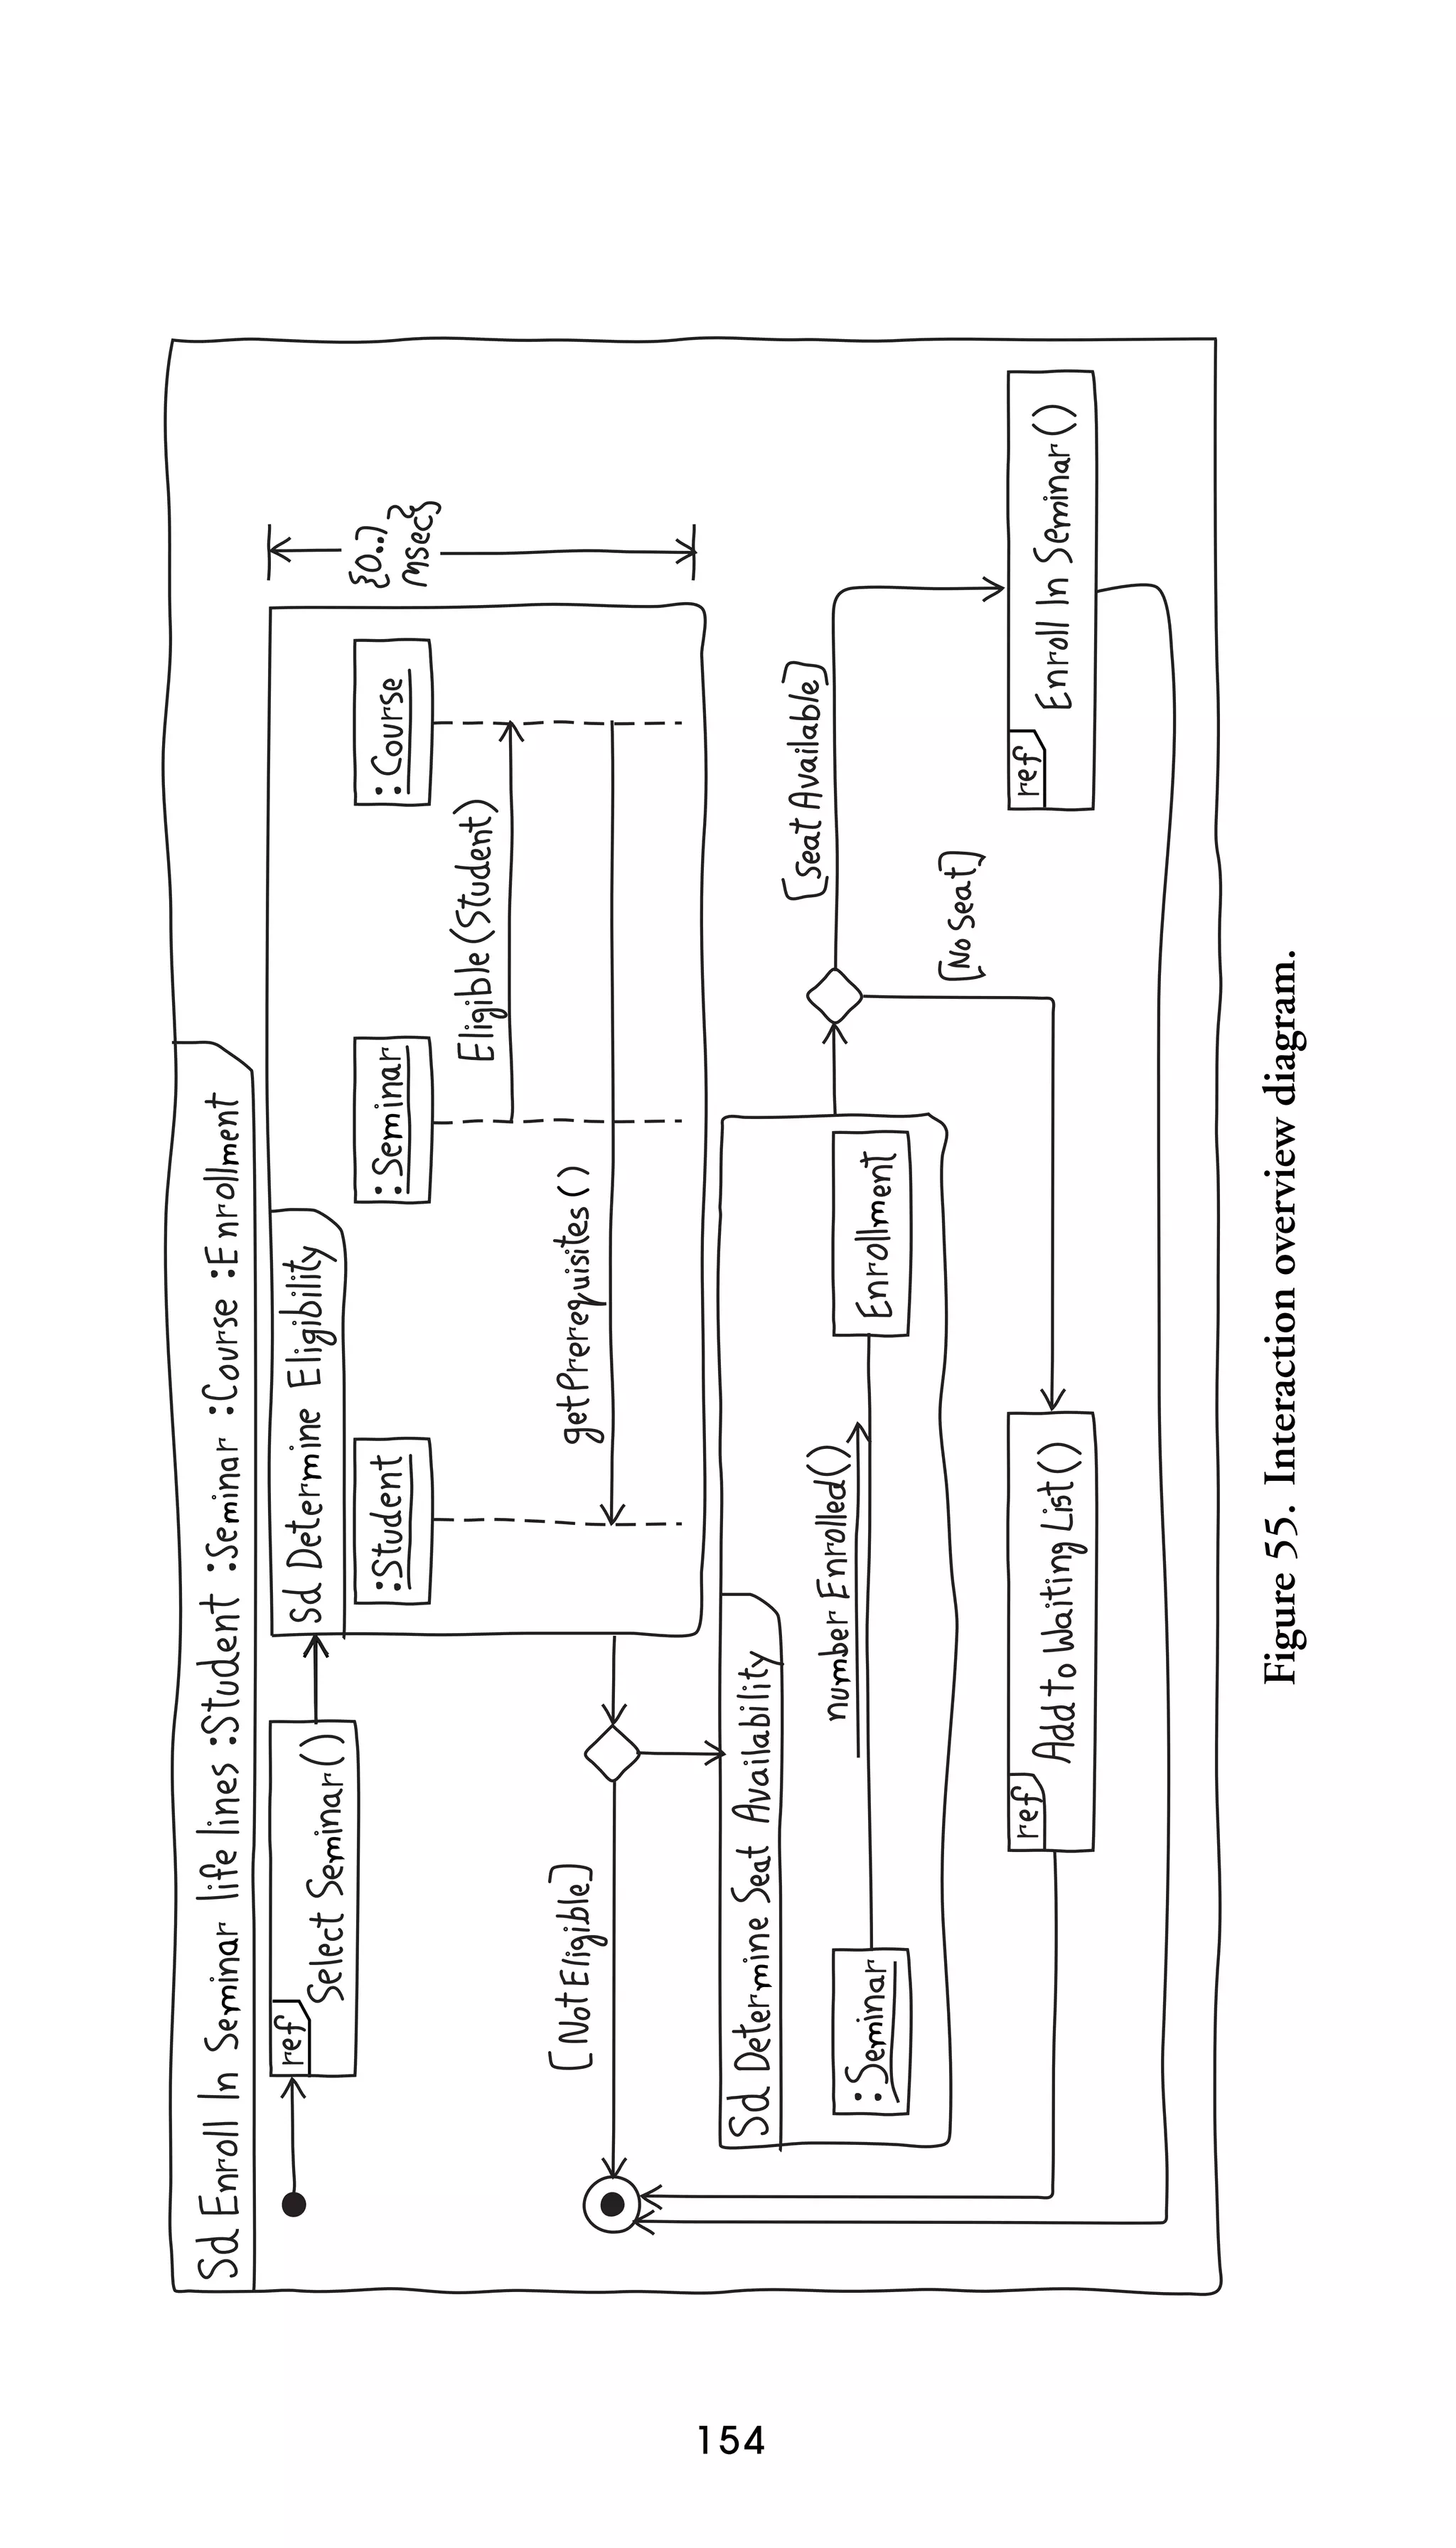
OCL (Object Constraint
Language) . . . . . . . . . . . 16
coding conventions for . . . 18
defining comparison
logic . . . . . . . . . . . . . . . 119
examples of . . . . . . . . . . . . . 17
indicating on a diagram . . 17
ODBC stereotype . . . . . . . . . 146
OID (object identifier) . . . . . . 60
operation names
within class boxes . . . . . . . 55
specifying in references . . . 24
operation signatures . . . . . 57, 90
operations . . . . . . . . . . . . . . . . . 51
applying stereotypes to . . . 58
capturing type information
for . . . . . . . . . . . . . . . . . 91
defined by classes . . . . . . . . 51
listing in decreasing
visibility. . . . . . . . . . . . .57
naming . . . . . . . . . . . . . 51, 57
protected . . . . . . . . . . . . . . . 57
simplifying . . . . . . . . . . . . 115
static . . . . . . . . . . . . . . . . . . 57
stepping through invocation
of . . . . . . . . . . . . . . . . . . 80
operations list . . . . . . . . . . . . . . 56
opt label . . . . . . . . . . . . . . . . . . 25
[Otherwise] guard . . . . . . . . . 118
output pins, depicting . . . . . 129
outputs, showing . . . . . . . . . 130
P
package (∼) visibility . . . . . . . 48
package dependencies . . . . . . . 79
package diagrams . . . . . . . 73–79
Package label . . . . . . . . . . . . . . 24
packages . . . . . . . . . . . . . . . . . . 73
on any UML diagram . . . . 78
avoiding cyclic dependencies
between . . . . . . . . . . . . . 78
inheritance between . . . . . 74
making cohesive . . . . . . . . . 78
naming . . . . . . . . . . . . . . . . 78
par label . . . . . . . . . . . . . . . . . . . 25
parallel bars . . . . . . . . . . . . . . 121
parallel flow . . . . . . . . . . 121–122
parameters
in communication diagram
messages . . . . . . . . . . . . 98
listing only types . . . . . . . . 57
naming . . . . . . . . . . . . . 57, 91
ordering . . . . . . . . . . . . . . . 58
parent actor, placing . . . . . . . . 44
part, placing . . . . . . . . . . . . . . . 72](https://image.slidesharecdn.com/2005-050521616786theelementsofuml2style-131128083647-phpapp02/75/the-elements-of-uml-2-style-194-2048.jpg)