Download to read offline
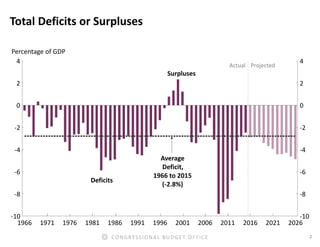
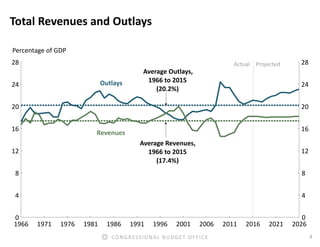
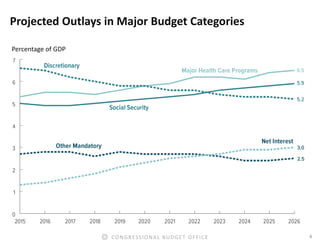
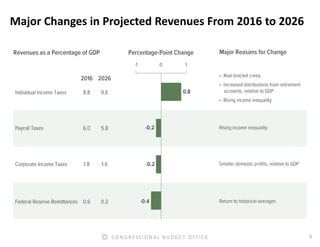
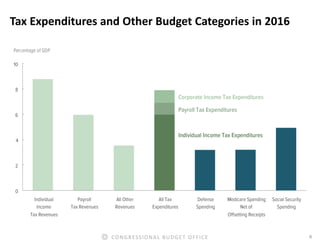
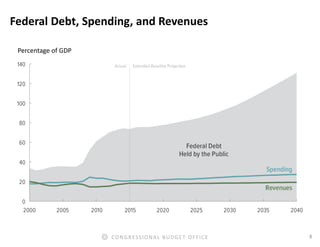
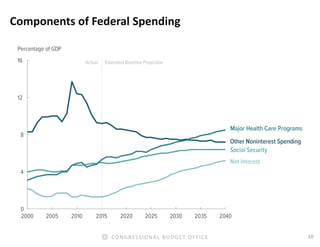
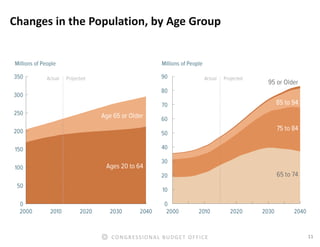
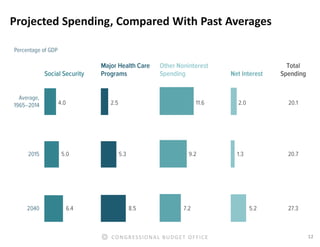
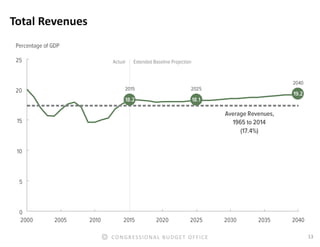
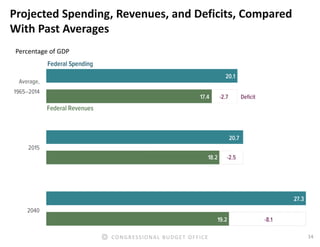
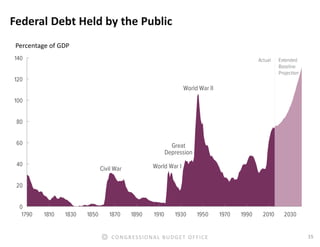
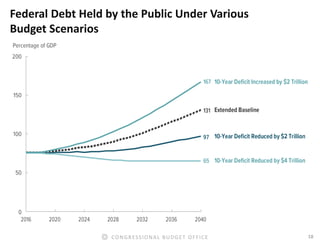

The Congressional Budget Office (CBO) presents its budget outlook through 2026, discussing federal revenues, noninterest spending, and historical trends in deficits relative to GDP. It highlights projections indicating an increase in federal debt, which could vary due to unforeseen economic and demographic changes. Additionally, significant policy adjustments in tax and spending would be necessary to ensure long-term sustainability of federal finances.


