Download as PDF, PPTX
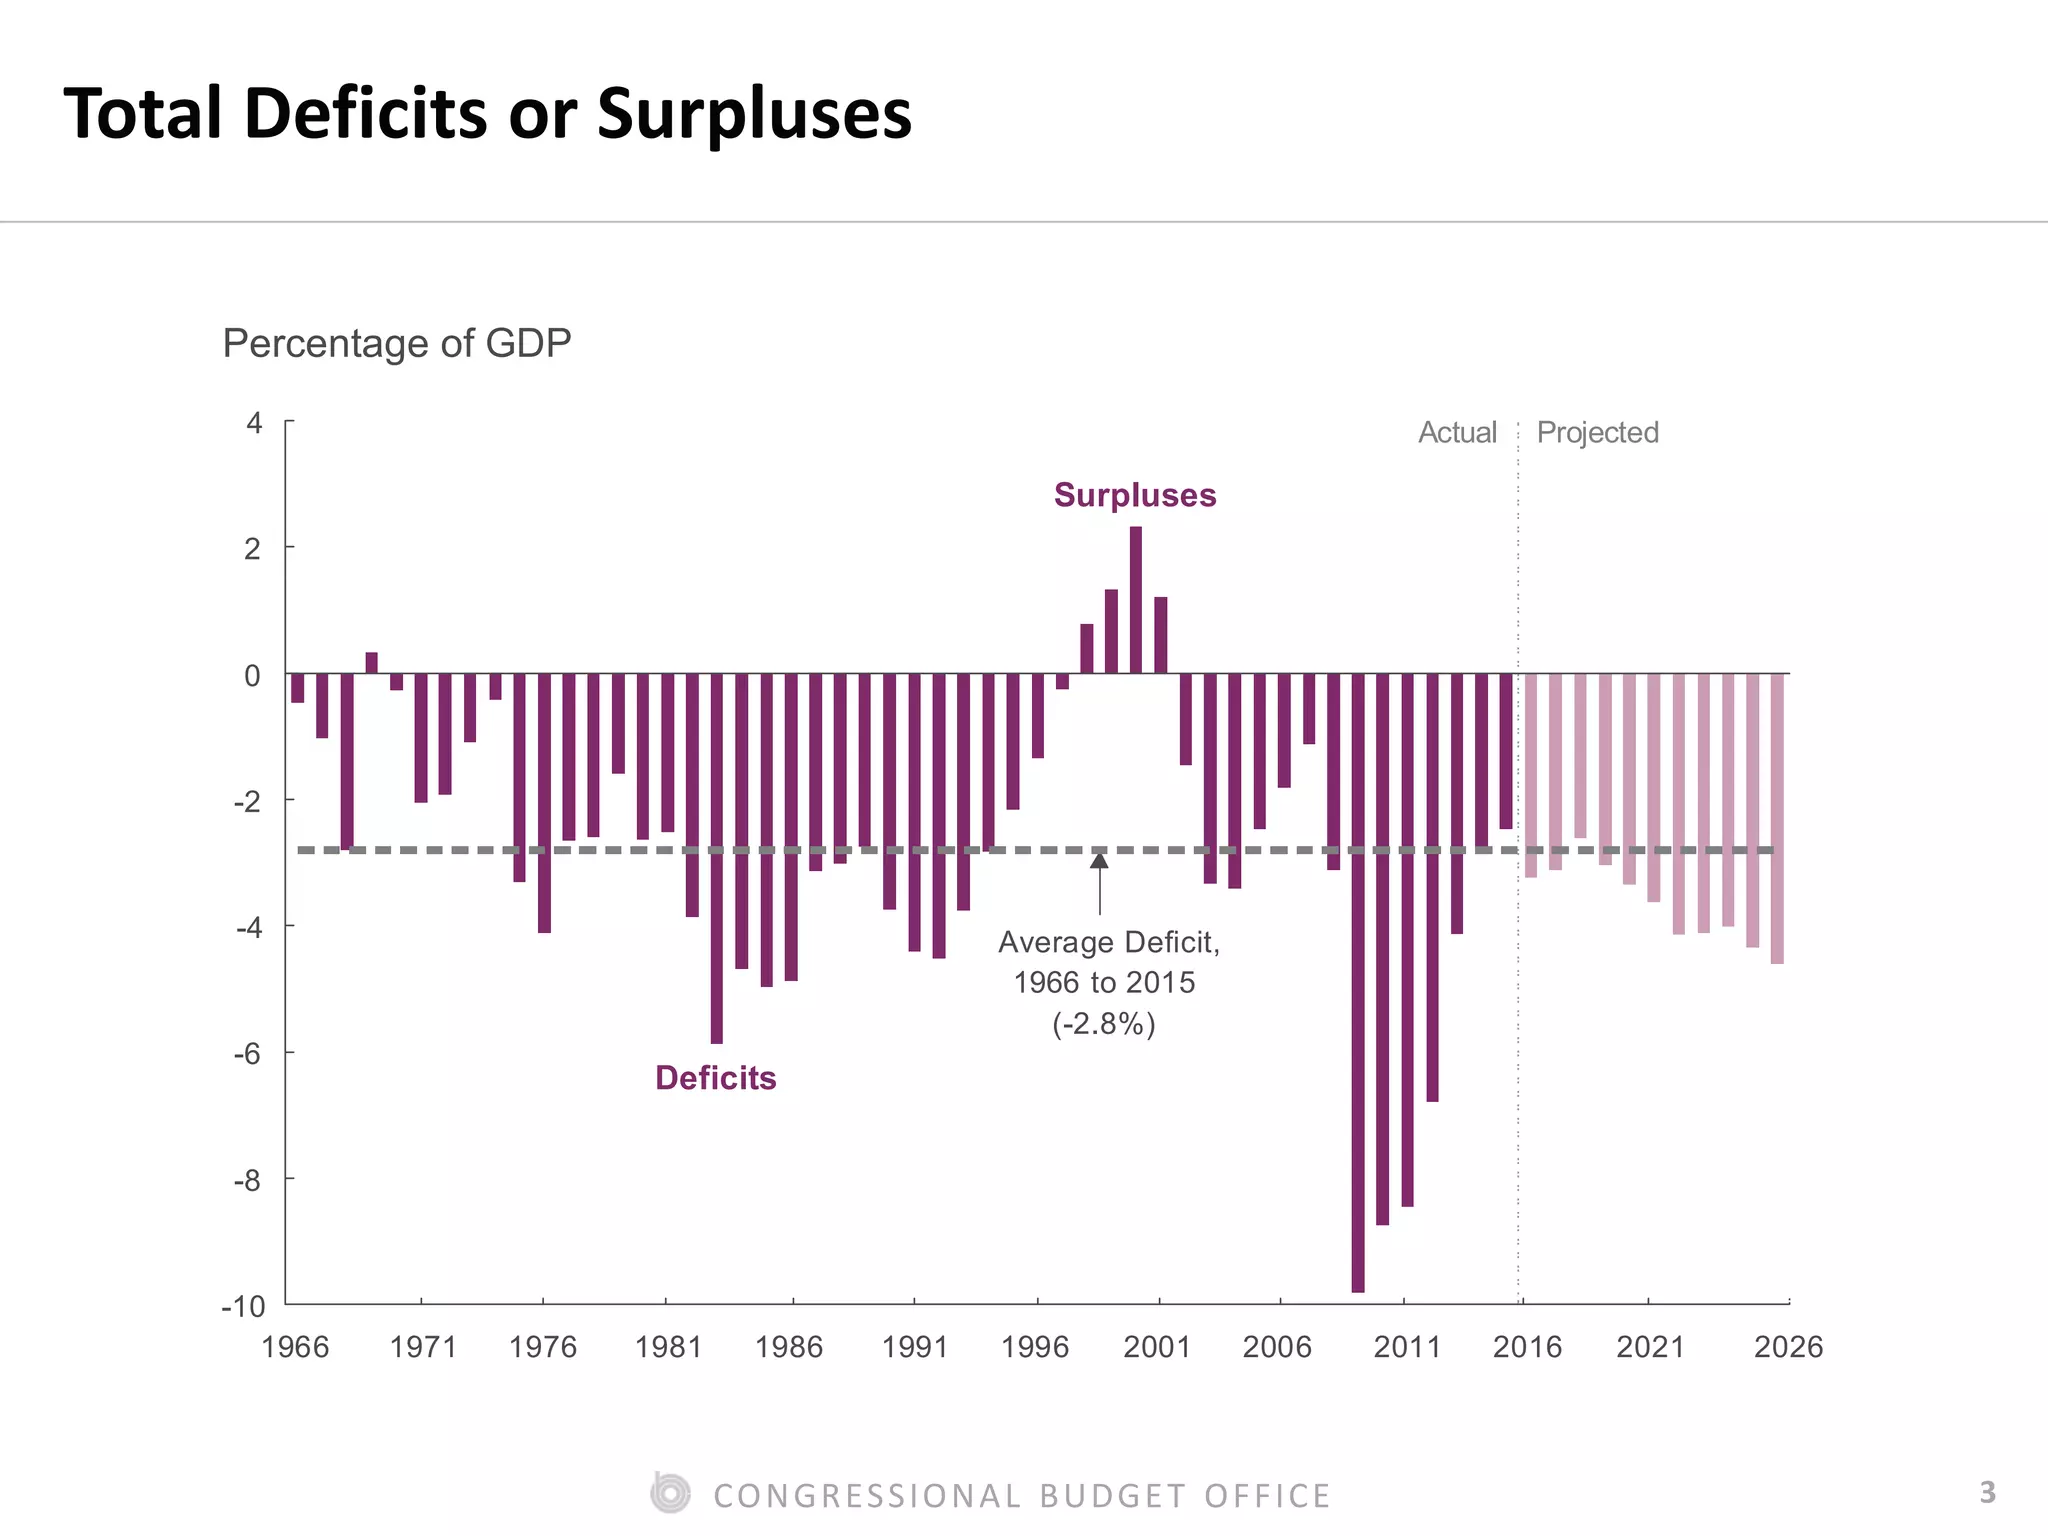
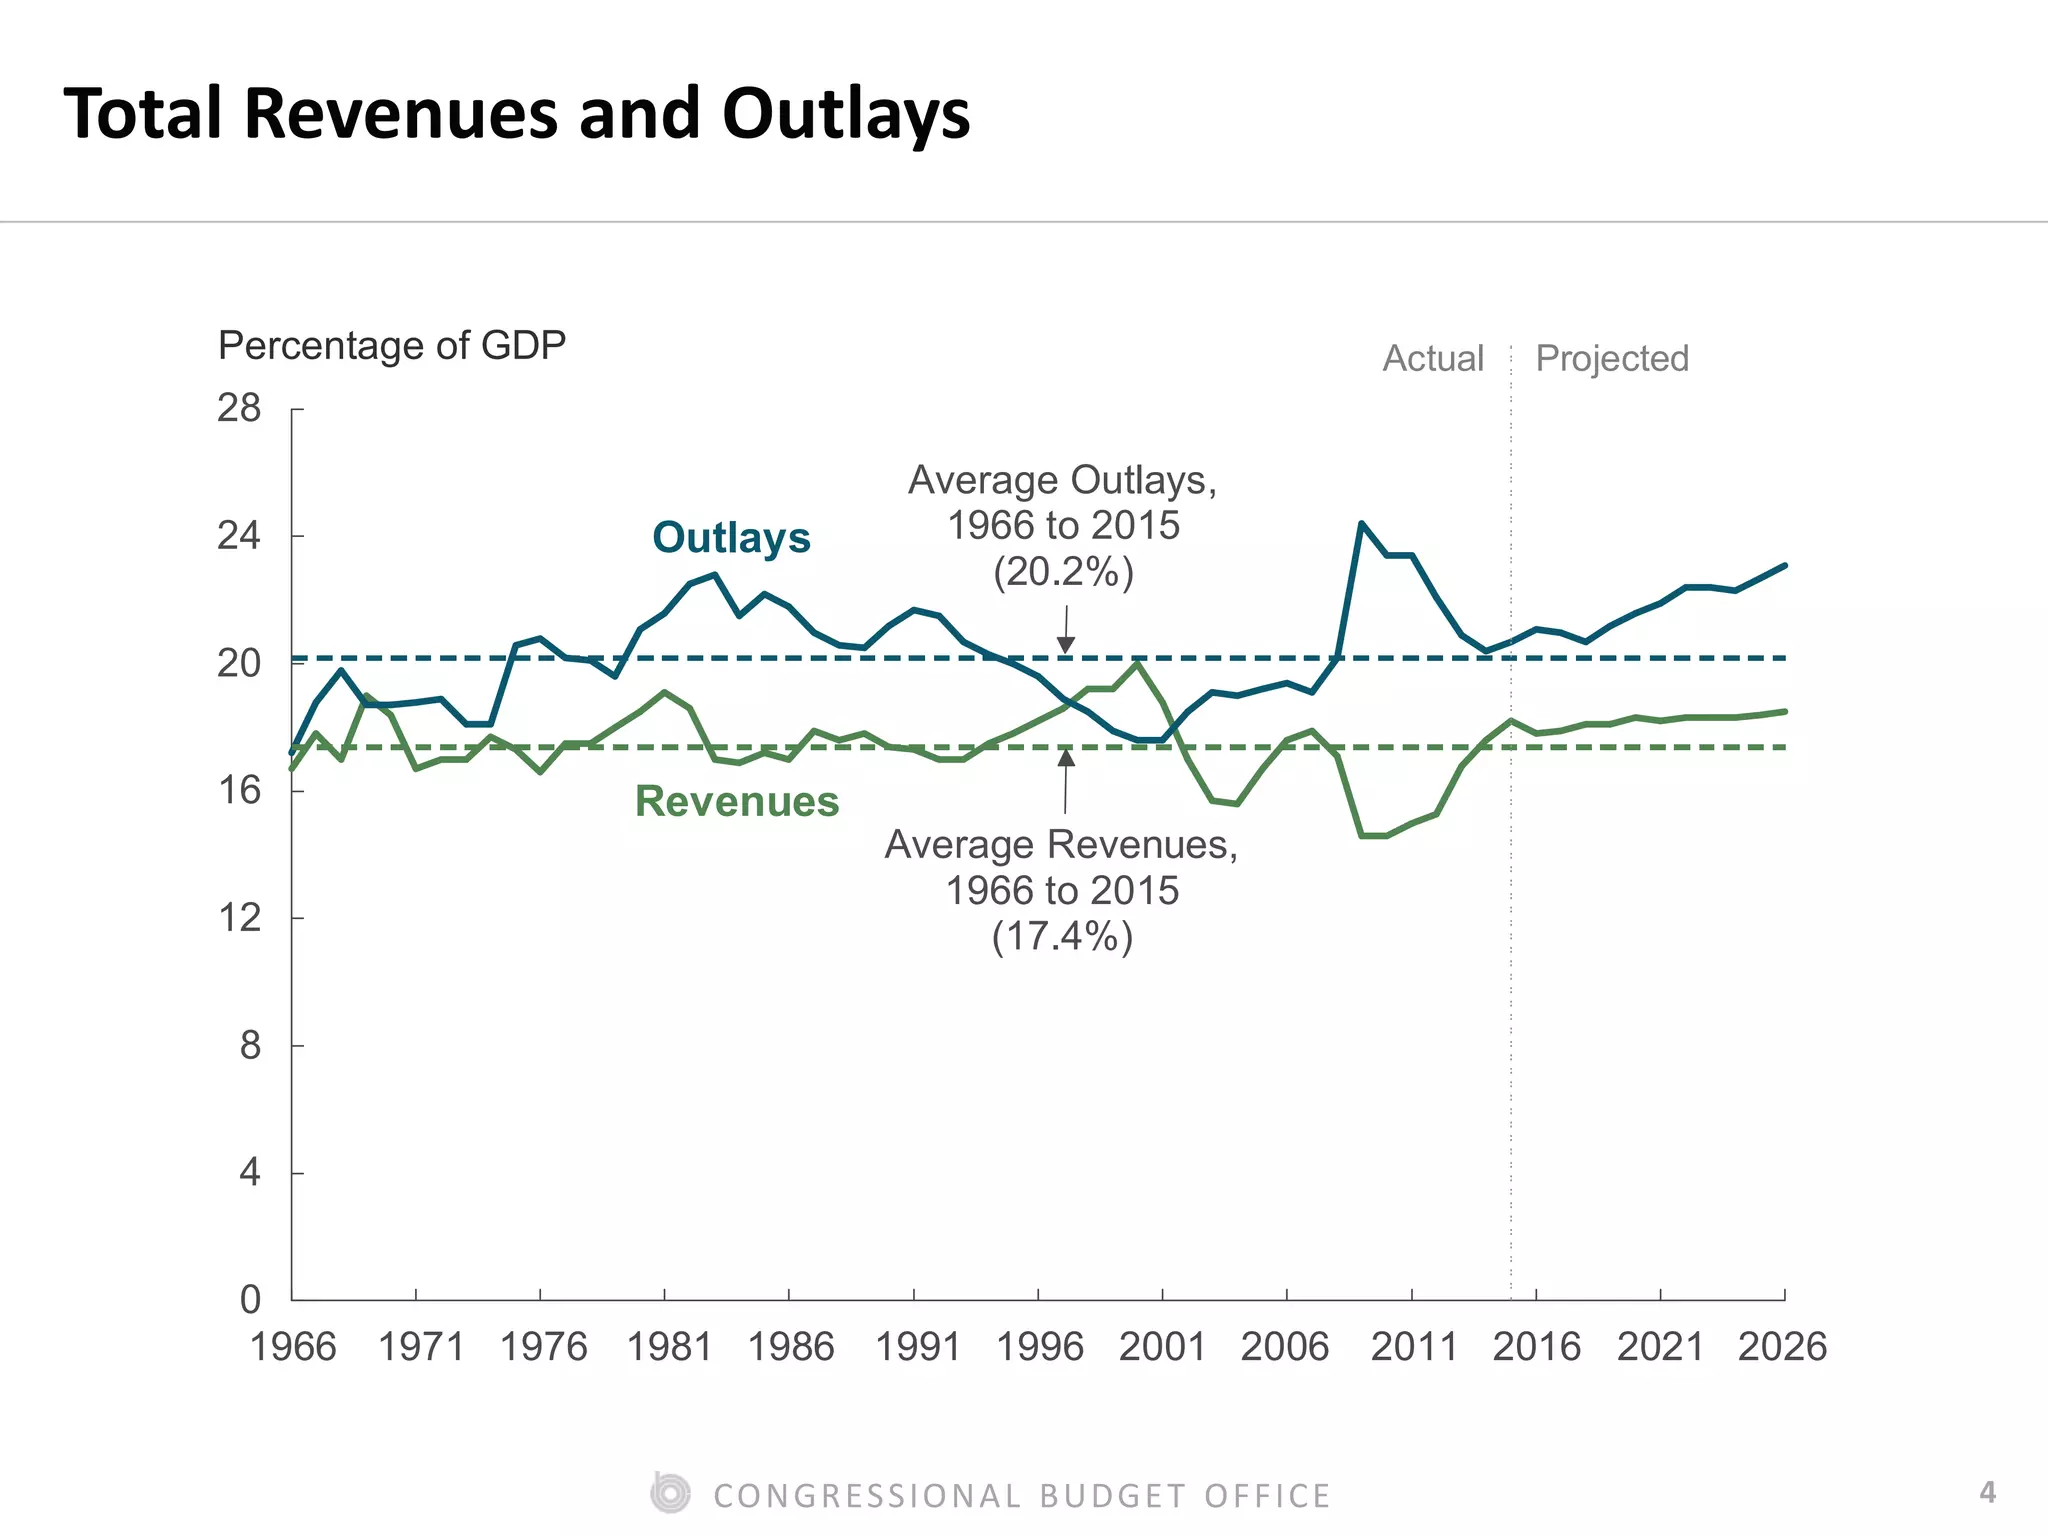
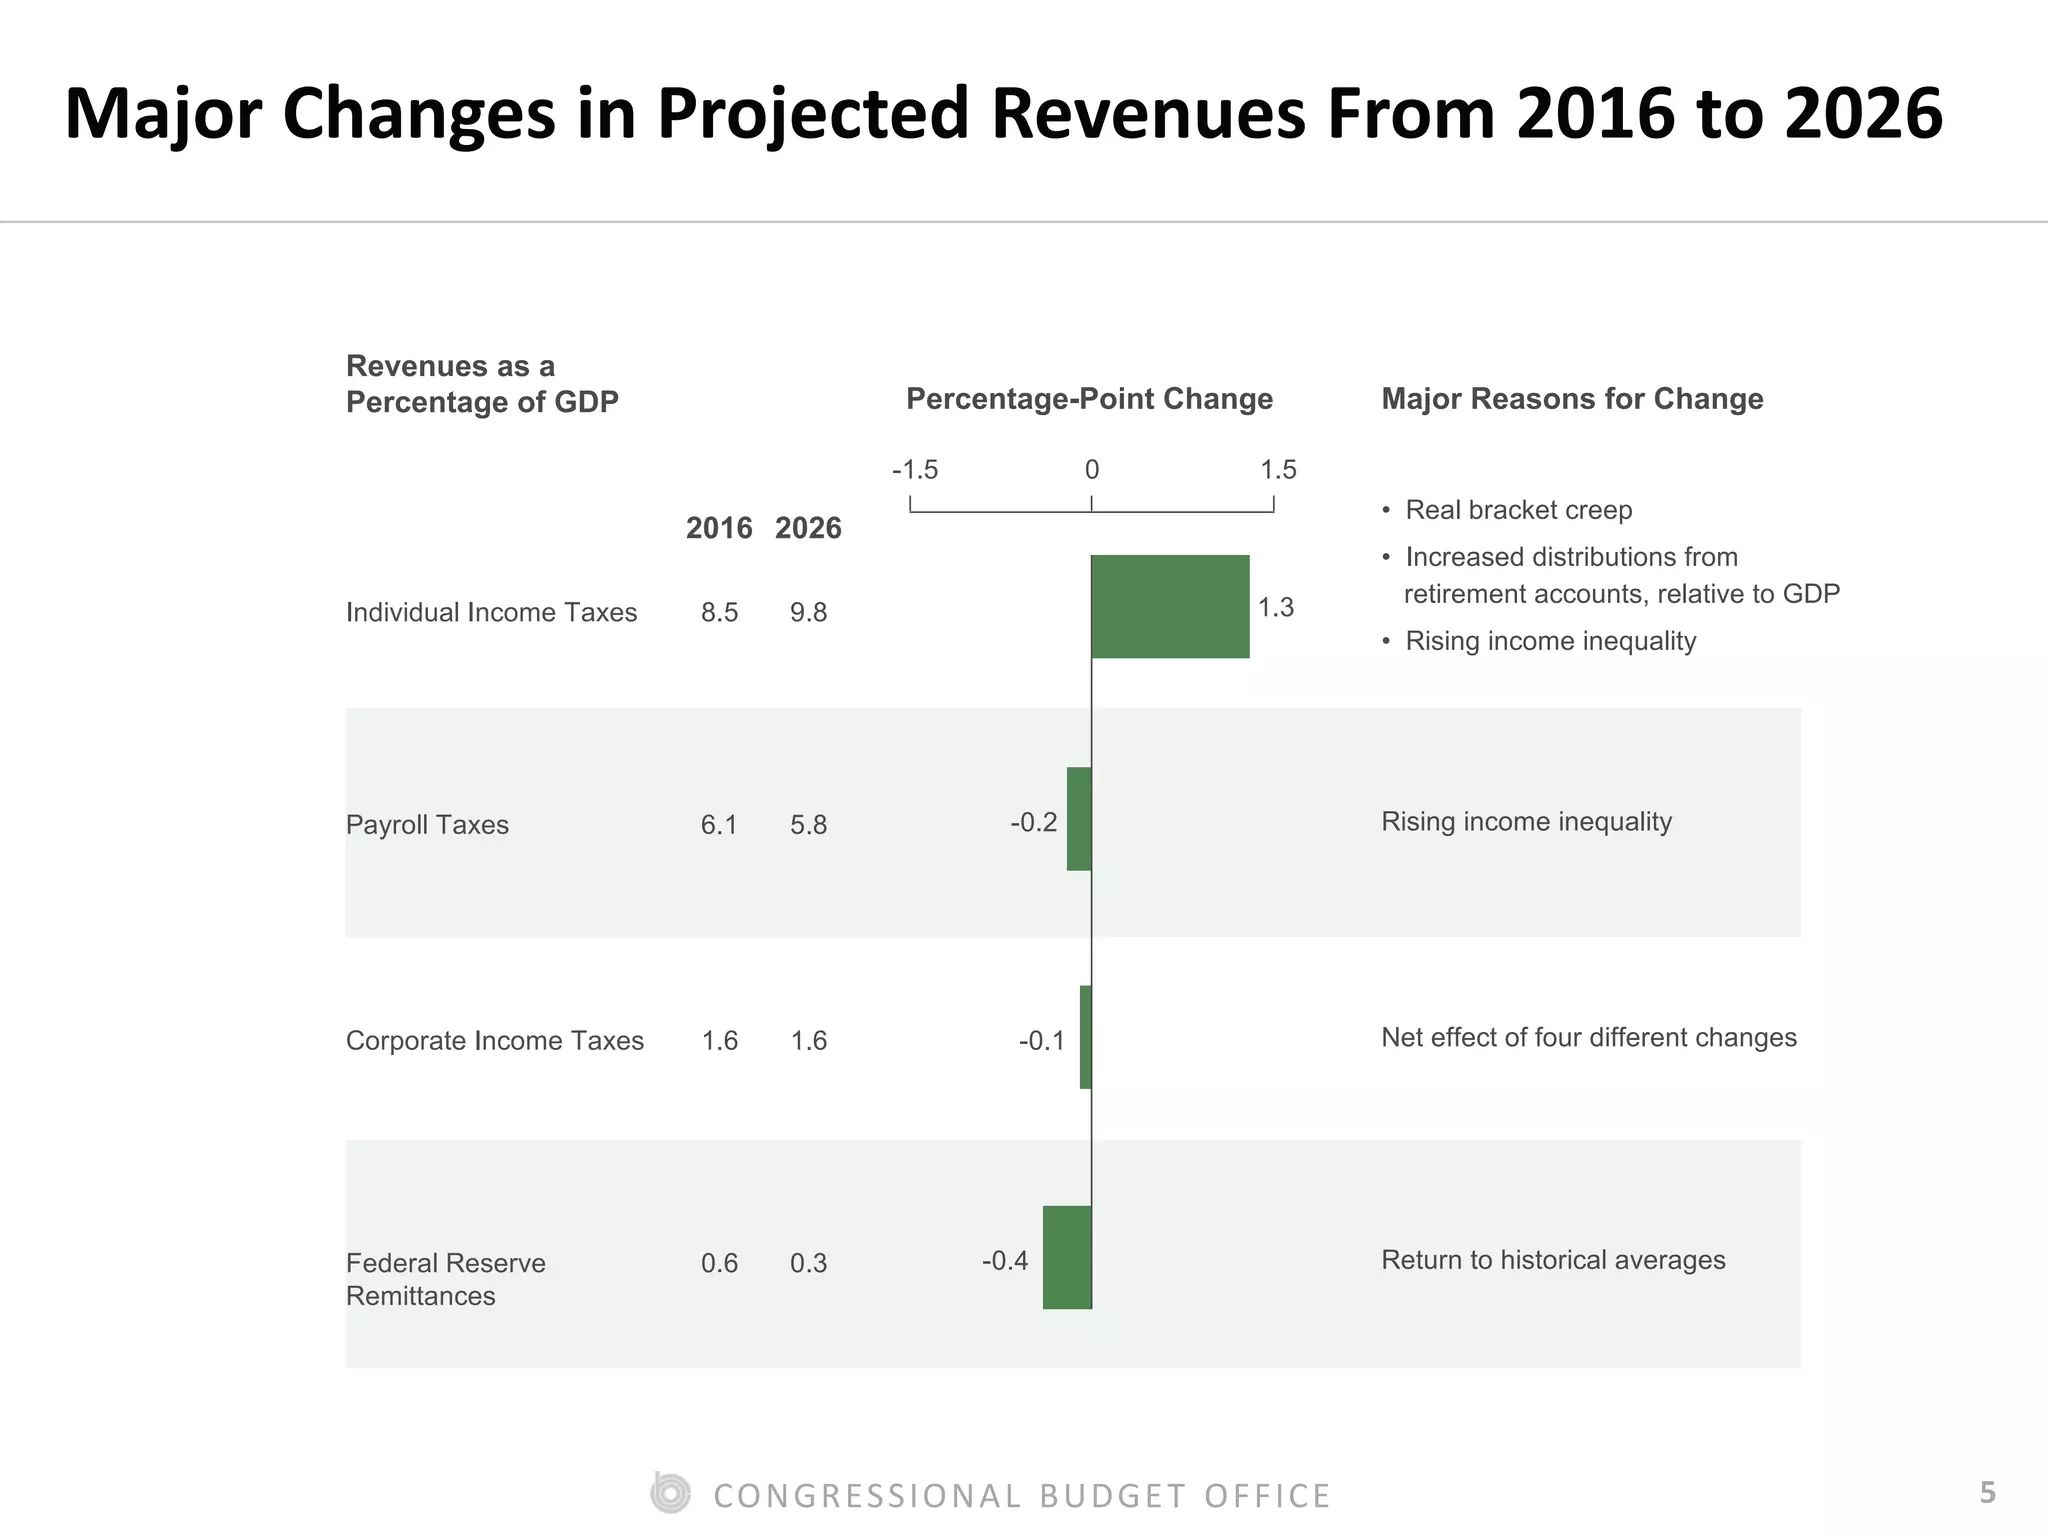
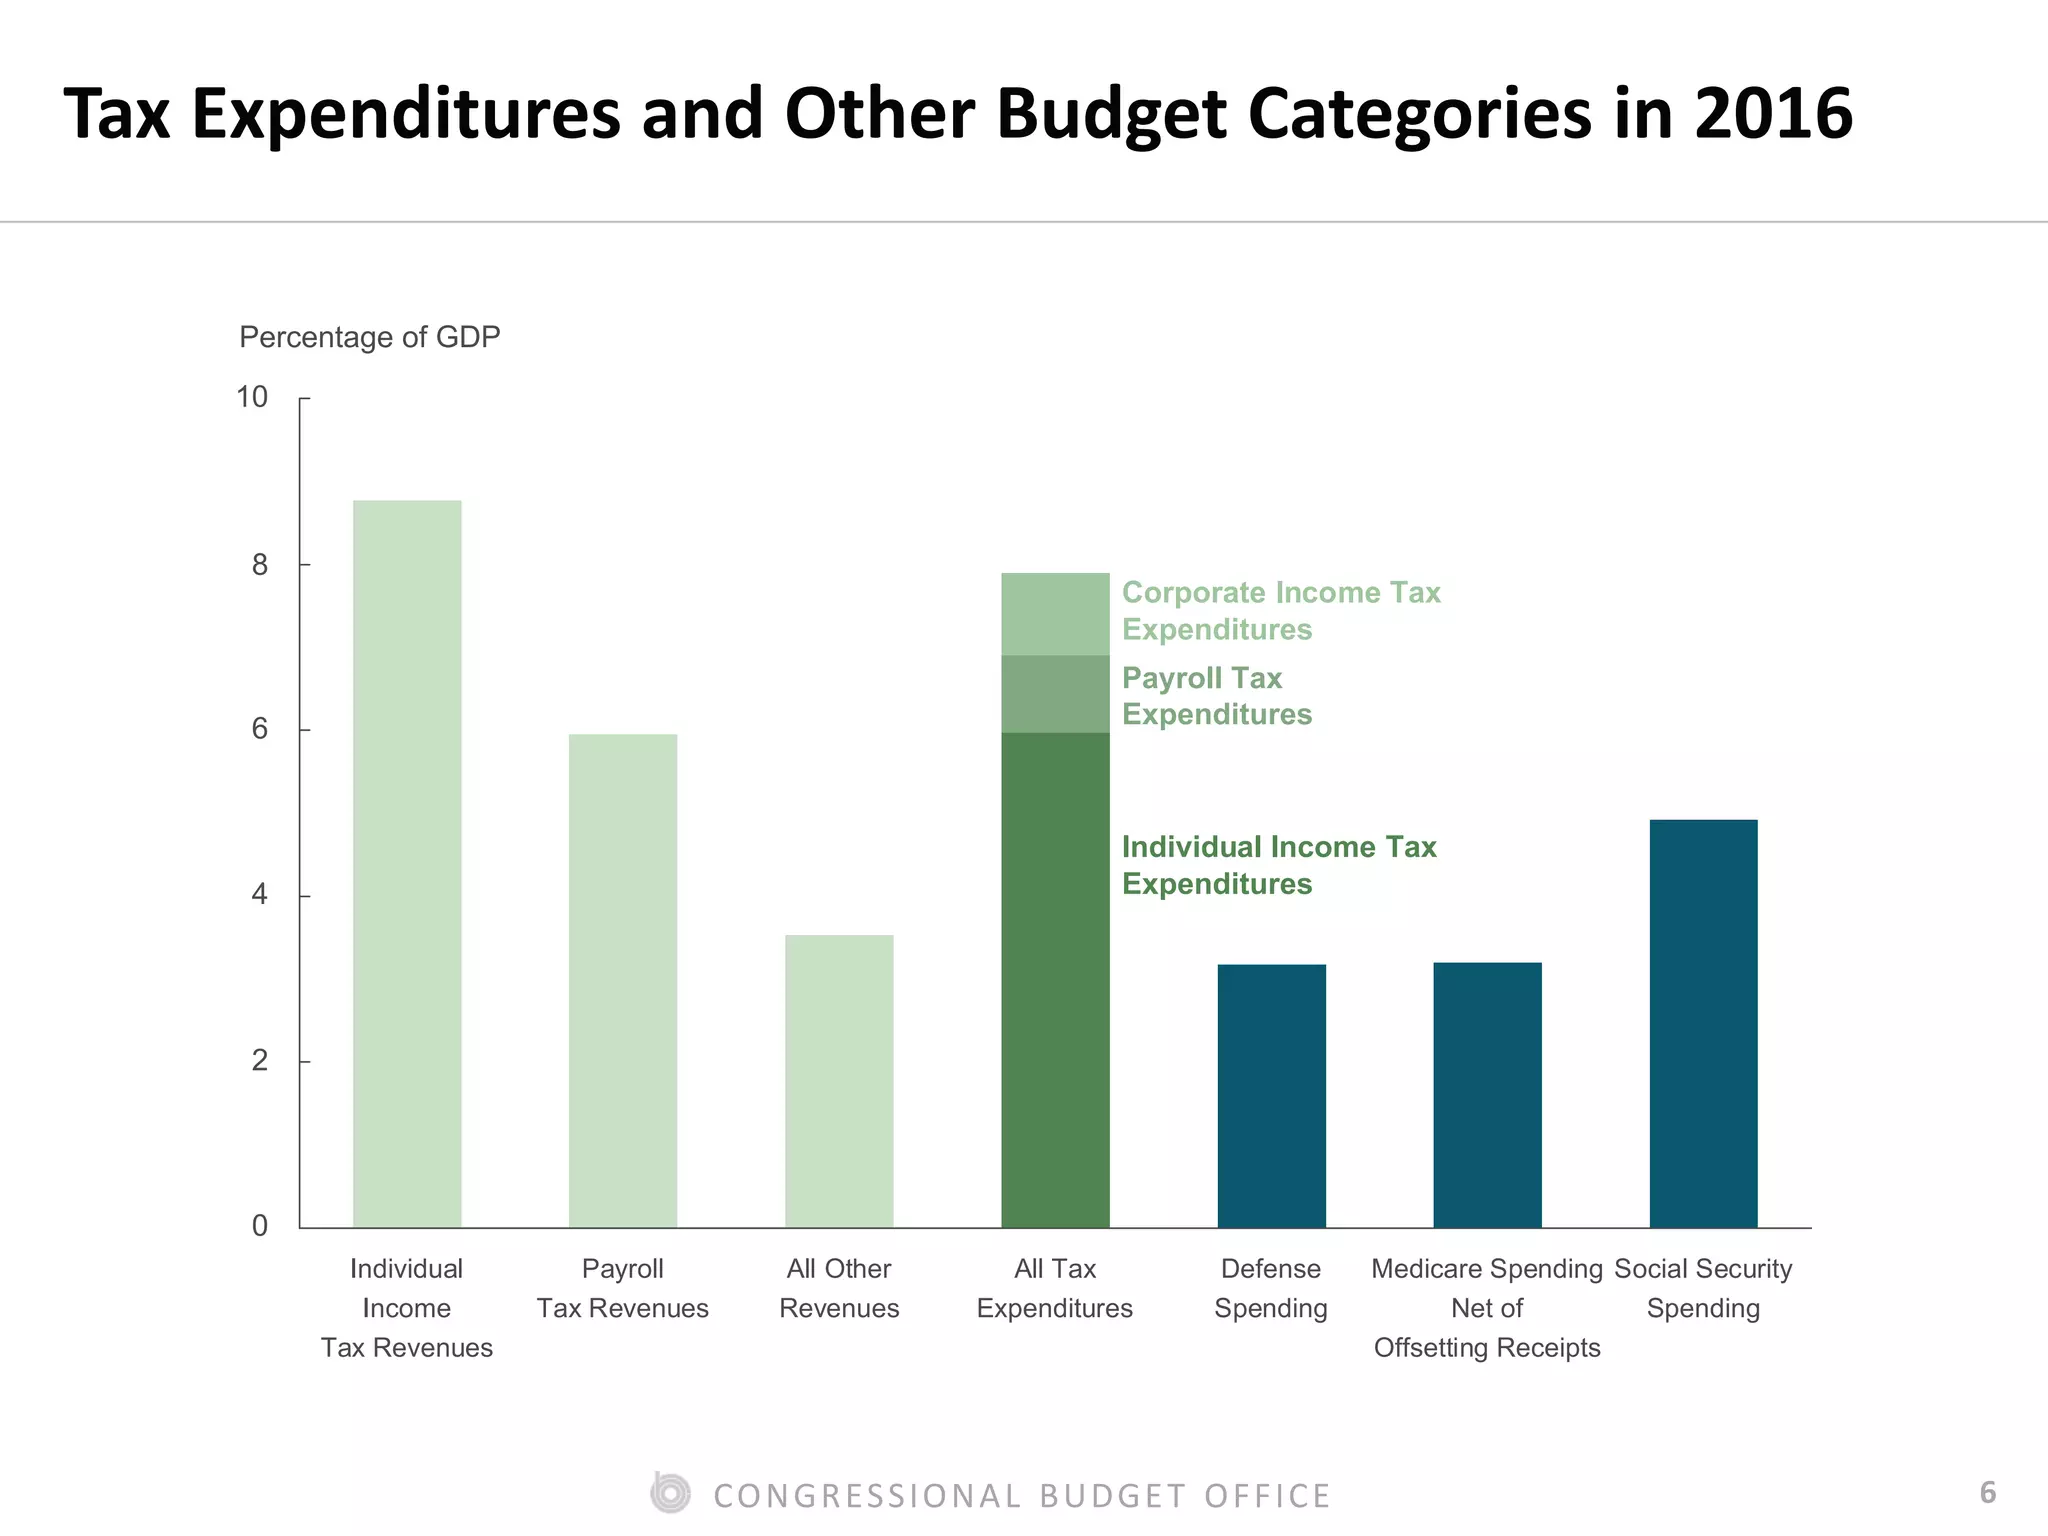
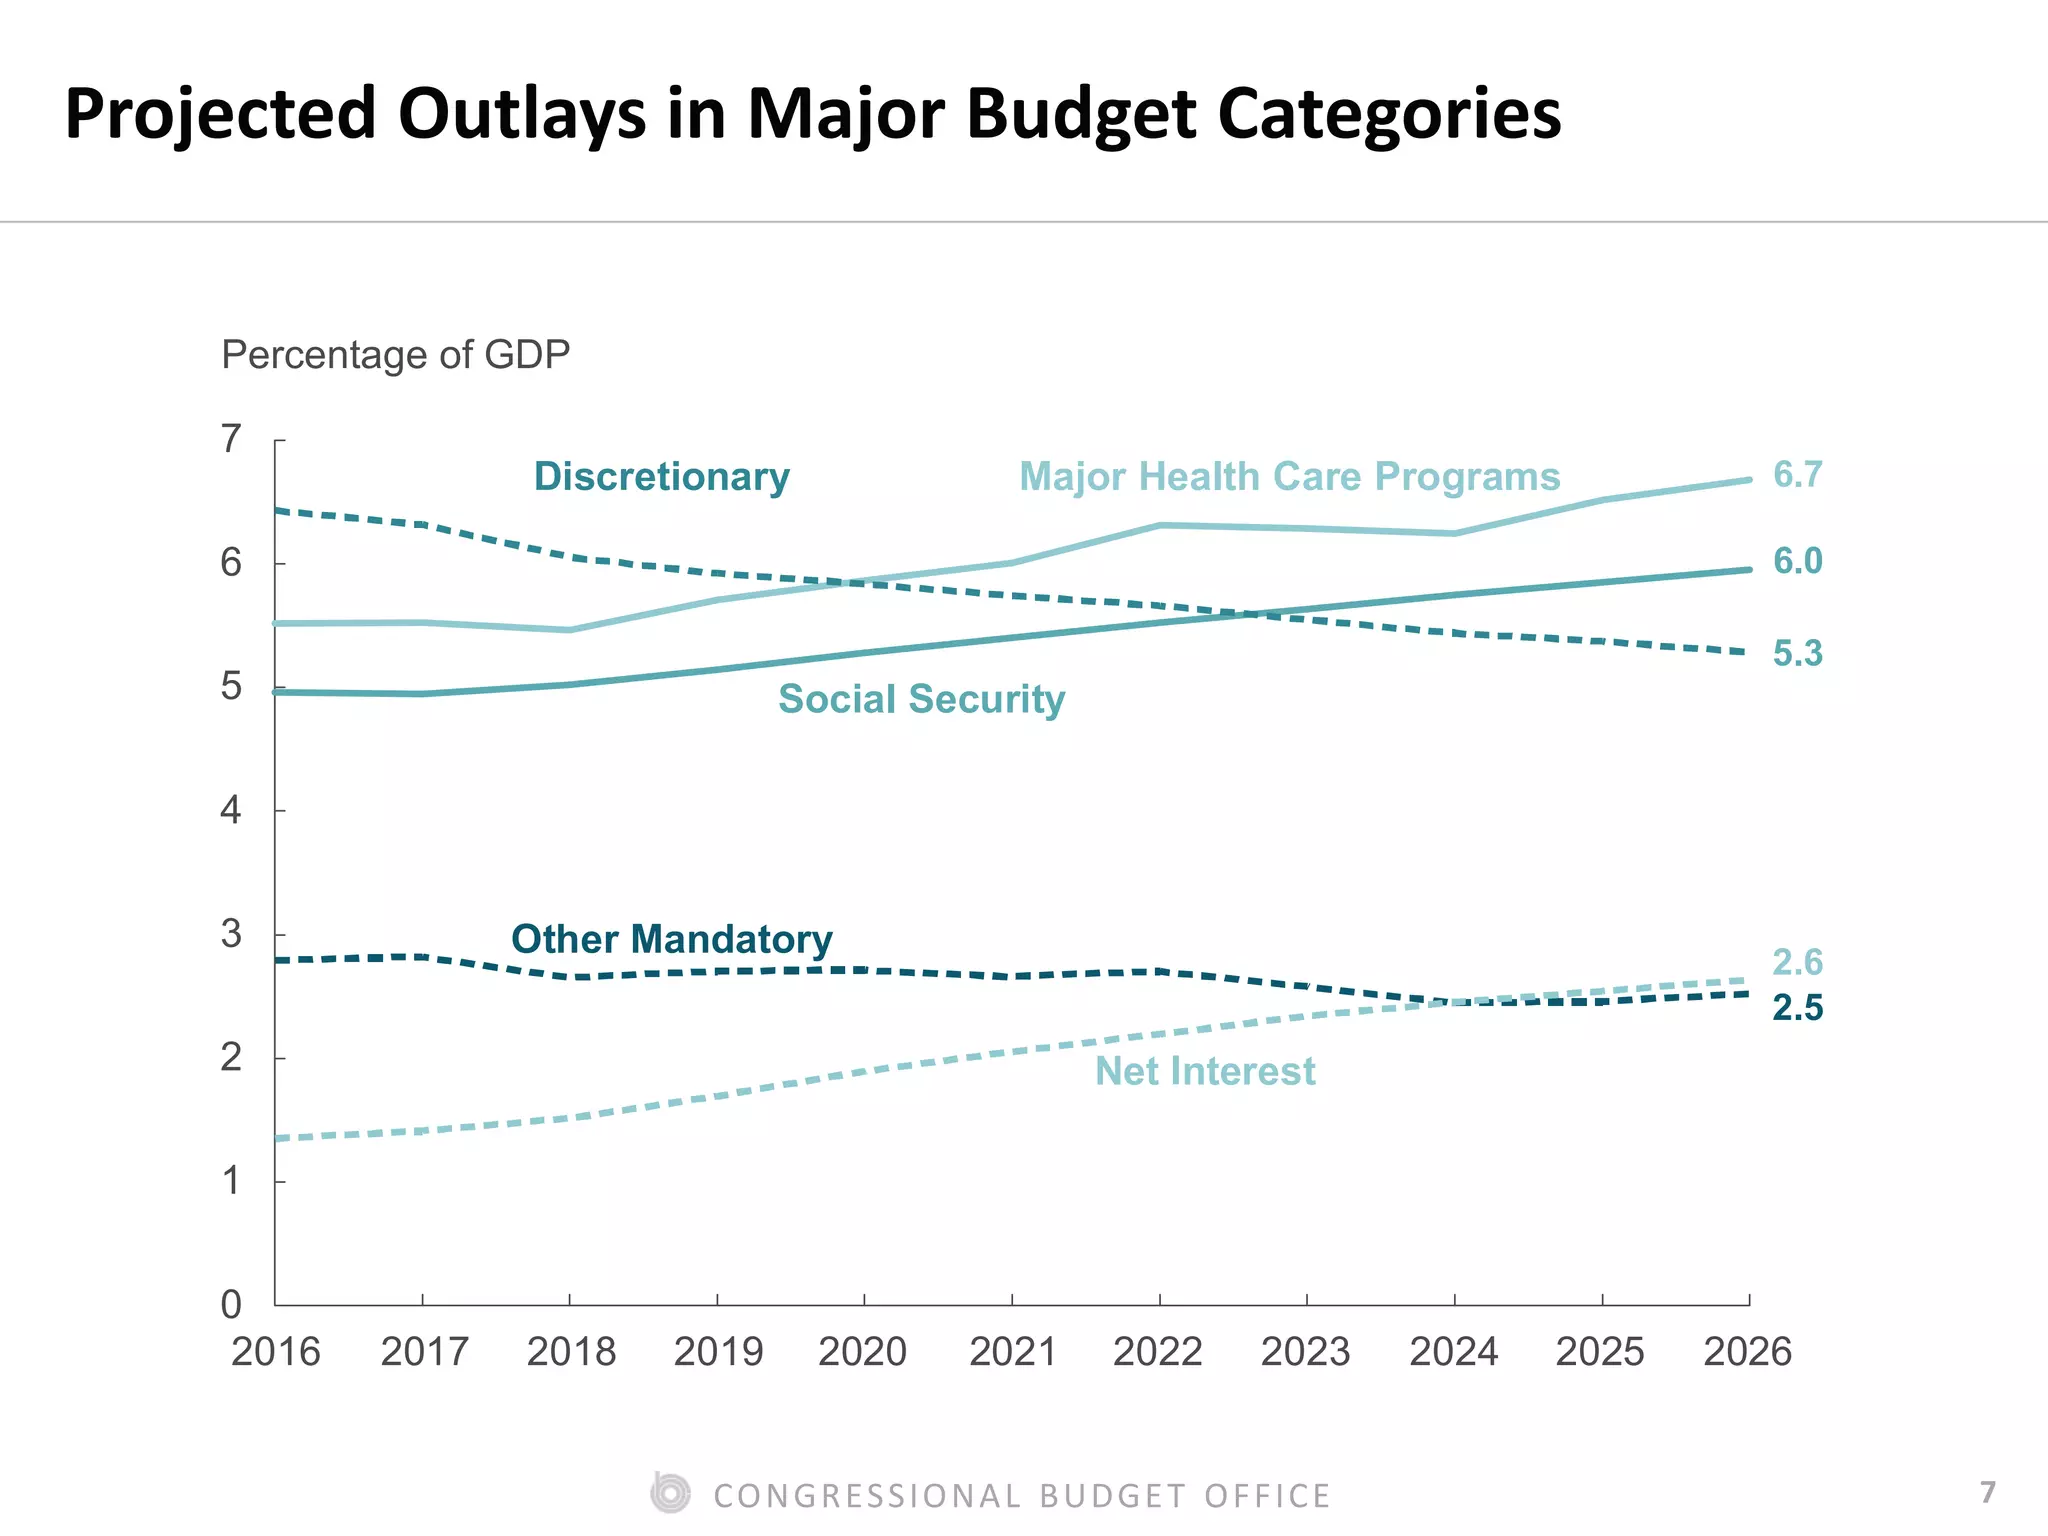


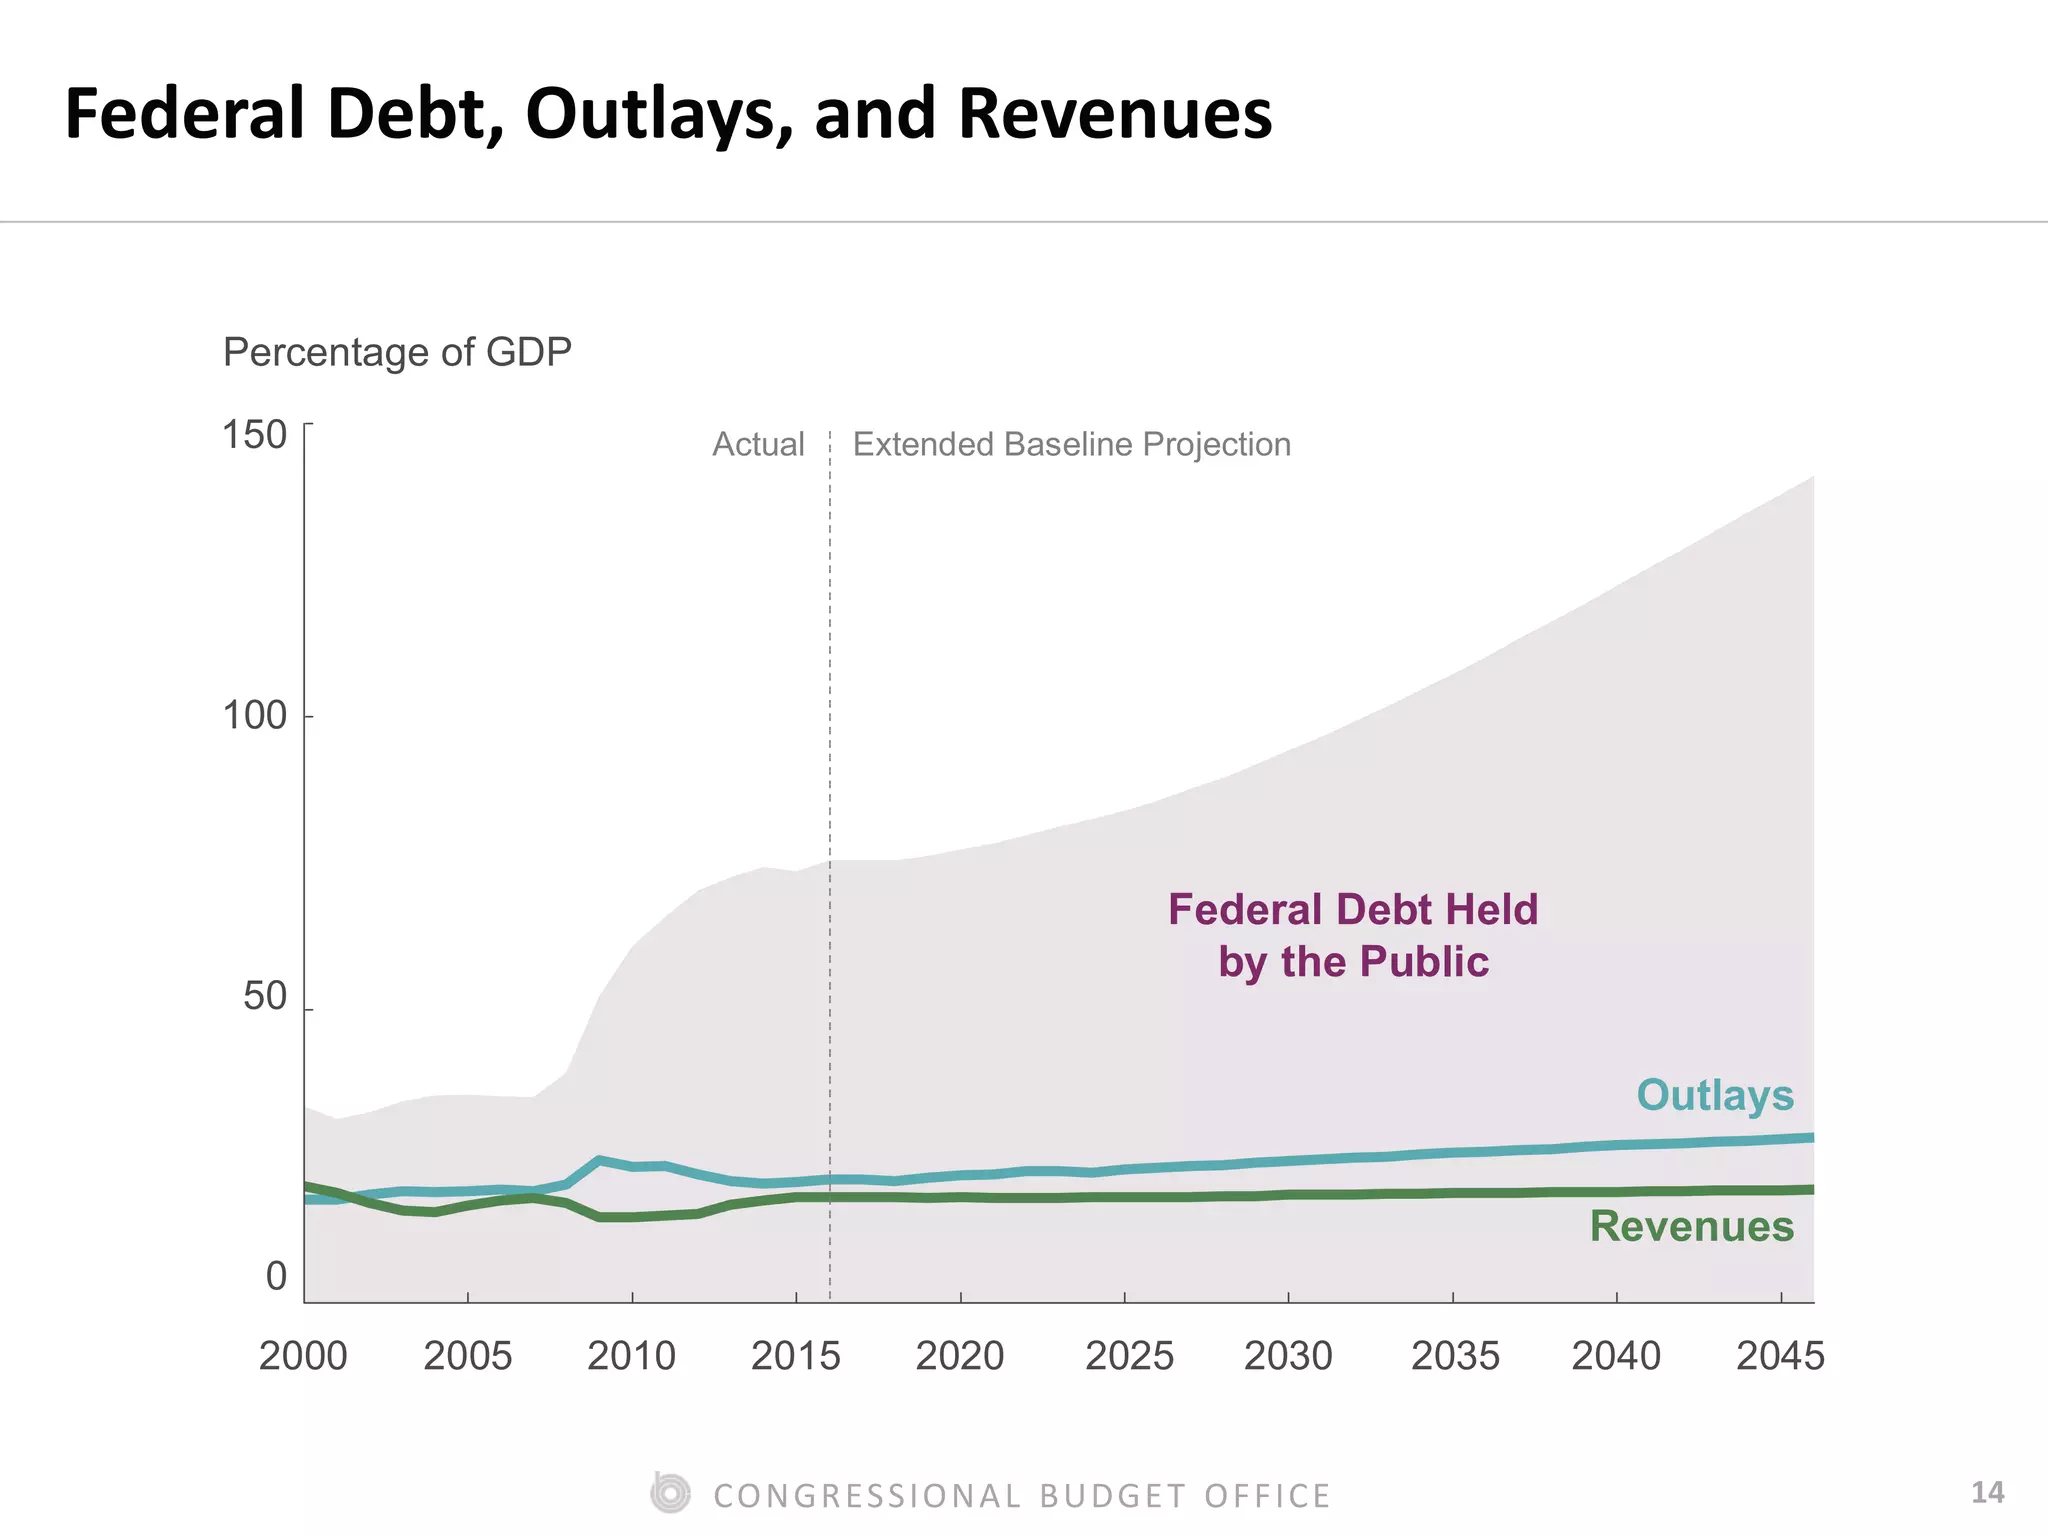


The Congressional Budget Office (CBO) presented an overview of its budget projections from 2016 to 2026, focusing on federal spending, revenues, and deficits. Key findings include an anticipated increase in federal spending on healthcare due to population aging and the impact of economic factors on tax revenues. The presentation highlights the challenges in managing federal debt and the policy changes needed to stabilize it over the long term.


