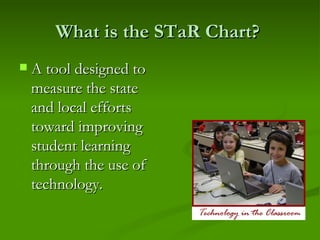
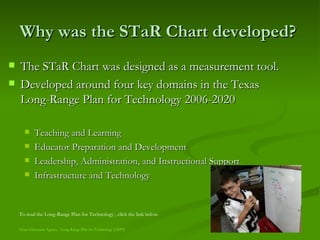
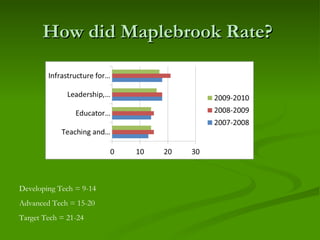
Texas STaR Chart Maplebrook Elementary
Agenda What is the STaR Chart?  Why was the STaR Chart developed?  Levels and Ultimate Goal  What do schools use the STaR Chart for?  How can it help me?
What is the STaR Chart?  A tool designed to measure the state and local efforts toward improving student learning through the use of technology.
Why was the STaR Chart developed?  The STaR Chart was designed as a measurement tool. Developed around four key domains in the Texas Long-Range Plan for Technology 2006-2020 Teaching and Learning Educator Preparation and Development Leadership, Administration, and Instructional Support Infrastructure and Technology To read the Long-Range Plan for Technology , click the link below :  Texas Education Agency - Long Range Plan for Technology (LRPT)
Levels and Ultimate Goal  Four Ratings can be earned:  Early Tech Developing Tech Advanced Tech Target Tech All schools are ultimately working to obtain the rating of being Target Tech in all four key domains
What do schools use the STaR Chart for?  To create and/or update the district’s technology plan.  To measure the use of technology by students and teachers.  By the campus and district to document progress toward meeting the NCLB, Title II, Part D To set goals and benchmarks. To determine funding priorities.  Apply for grants.
How Can It Help Me?  The STaR Chart rates the use of technology in four different way for four different areas.  Target Tech is the goal for each of the four domain areas.  As the chart is completed, I am able to see category that I fall in on the ranking system.  Set a goal to obtain a higher level if needed.
How Can It Help Me?  Schools across the nation that have implemented programs that make technology part of the everyday class experience have documented:  Better attendance More student interest Fewer behavior problems Higher test scores
How did Maplebrook Rate?  Developing Tech = 9-14 Advanced Tech = 15-20 Target Tech = 21-24
Summary STaR Chart can help you assess an analyze your technology use. The STaR Chart helps the campus to plan for technology. Maplebrook’s rating has dropped over the past year, therefore the CIP should reflect an effort to increase our rating.  Ultimate goal is to be at the Advanced Tech level in all for domains.

Texas STaR Chart - MBE

  • 1.
    Texas STaR ChartMaplebrook Elementary
  • 2.
    Agenda What isthe STaR Chart? Why was the STaR Chart developed? Levels and Ultimate Goal What do schools use the STaR Chart for? How can it help me?
  • 3.
    What is theSTaR Chart? A tool designed to measure the state and local efforts toward improving student learning through the use of technology.
  • 4.
    Why was theSTaR Chart developed? The STaR Chart was designed as a measurement tool. Developed around four key domains in the Texas Long-Range Plan for Technology 2006-2020 Teaching and Learning Educator Preparation and Development Leadership, Administration, and Instructional Support Infrastructure and Technology To read the Long-Range Plan for Technology , click the link below : Texas Education Agency - Long Range Plan for Technology (LRPT)
  • 5.
    Levels and UltimateGoal Four Ratings can be earned: Early Tech Developing Tech Advanced Tech Target Tech All schools are ultimately working to obtain the rating of being Target Tech in all four key domains
  • 6.
    What do schoolsuse the STaR Chart for? To create and/or update the district’s technology plan. To measure the use of technology by students and teachers. By the campus and district to document progress toward meeting the NCLB, Title II, Part D To set goals and benchmarks. To determine funding priorities. Apply for grants.
  • 7.
    How Can ItHelp Me? The STaR Chart rates the use of technology in four different way for four different areas. Target Tech is the goal for each of the four domain areas. As the chart is completed, I am able to see category that I fall in on the ranking system. Set a goal to obtain a higher level if needed.
  • 8.
    How Can ItHelp Me? Schools across the nation that have implemented programs that make technology part of the everyday class experience have documented: Better attendance More student interest Fewer behavior problems Higher test scores
  • 9.
    How did MaplebrookRate? Developing Tech = 9-14 Advanced Tech = 15-20 Target Tech = 21-24
  • 10.
    Summary STaR Chartcan help you assess an analyze your technology use. The STaR Chart helps the campus to plan for technology. Maplebrook’s rating has dropped over the past year, therefore the CIP should reflect an effort to increase our rating. Ultimate goal is to be at the Advanced Tech level in all for domains.