1
1Q21 CONSOLIDATED RESULTS MAY 12th 2021
1Q2021 Consolidated Results
May 12th 2021
2
1Q21 CONSOLIDATED RESULTS MAY 12th 2021
Agenda
1Q21 Results 6
Highlights 3
Annexes 15
3
1Q21 CONSOLIDATED RESULTS MAY 12th 2021
Highlights
4
1Q21 CONSOLIDATED RESULTS MAY 12th 2021
20.0
22.6
24.1
28.9
26.0
26.5 26.2
25.5
25.9
27.1
24.8
26.7
18
20
22
24
26
28
30
32
Apr May Jun Jul Aug Sep Oct Nov Dec Jan Feb Mar
Monthly energy demand
Previous Year
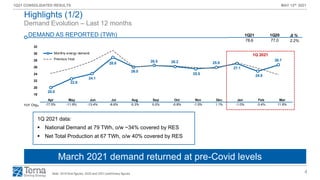
Demand Evolution – Last 12 months
DEMAND AS REPORTED (TWh)
Highlights (1/2)
Note: 2019 final figures, 2020 and 2021 preliminary figures
March 2021 demand returned at pre-Covid levels
1Q 2021 data:
▪ National Demand at 79 TWh, o/w ~34% covered by RES
▪ Net Total Production at 67 TWh, o/w 40% covered by RES
Apr May Jun Jul Aug Sep Oct Nov Dec Jan Feb Mar
YoY Chg% -17.5% -11.9% -13.4% -6.6% -0.3% 0.0% -0.8% -1.5% 1.1% -1.0% -3.4% 11.8%
Δ %
2.2%
1Q21 1Q20
78.6 77.0
1Q 2021
5
1Q21 CONSOLIDATED RESULTS MAY 12th 2021
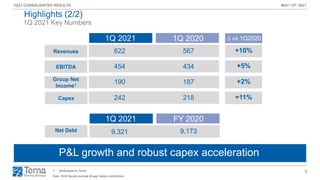
1Q 2021 Key Numbers
Highlights (2/2)
P&L growth and robust capex acceleration
Revenues +10%
EBITDA +5%
Group Net
Income1
+2%
Capex +11%
Net Debt 9,321
622
454
190
242
9,173
567
434
187
218
1Q 2021 ∆ vs 1Q2020
1. Attributable to Terna
1Q 2020
1Q 2021 FY 2020
Note: 2020 figures exclude Brugg Cables contribution
6
1Q21 CONSOLIDATED RESULTS MAY 12th 2021
1Q21 Results
7
1Q21 CONSOLIDATED RESULTS MAY 12th 2021
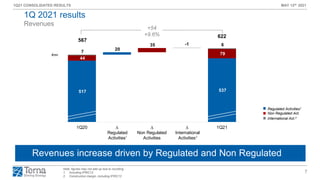
517 537
44
79
1
7
6
567
622
20
35 -1
1Q20 ∆
Regulated
Activities
∆
Non Regulated
Activities
∆
International
Activities
1Q21
Revenues
Note: figures may not add up due to rounding
1. Including IFRIC12
2. Construction margin, including IFRIC12
Insourcing attività di O&M Rete FS
Revenues increase driven by Regulated and Non Regulated
1Q 2021 results
1 2
€mn
Regulated Activities1
Non Regulated Act.
International Act.2
+54
+9.6%
8
1Q21 CONSOLIDATED RESULTS MAY 12th 2021
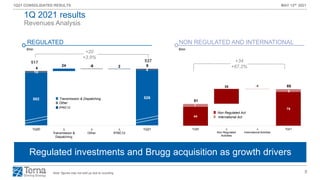
44
79
7
35 -1
6
51
85
1Q20 ∆
Non Regulated
Activities
∆
International Activites
1Q21
502 526
10
24 -6 2
4
4
6
517 537
1Q20 ∆
Transmission &
Dispatching
∆
Other
∆
IFRIC12
1Q21
Revenues Analysis
Regulated investments and Brugg acquisition as growth drivers
Note: figures may not add up due to rounding
€mn
REGULATED
€mn
NON REGULATED AND INTERNATIONAL
+20
+3.9%
+34
+67.2%
Transmission & Dispatching
Other
IFRIC12
Non Regulated Act.
International Act.
1Q 2021 results
9
1Q21 CONSOLIDATED RESULTS MAY 12th 2021
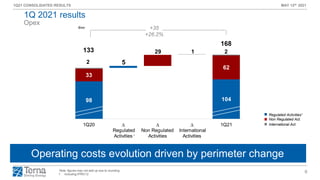
98 104
33
62
2
2
5
29 1
133
168
1Q20 ∆
Regulated
Activities
∆
Non Regulated
Activities
∆
International
Activities
1Q21
Opex
Note: figures may not add up due to rounding
1. Including IFRIC12
Insourcing attività di O&M Rete FS
Operating costs evolution driven by perimeter change
1
€mn
Regulated Activities1
Non Regulated Act.
International Act.
+35
+26.2%
1Q 2021 results
10
1Q21 CONSOLIDATED RESULTS MAY 12th 2021
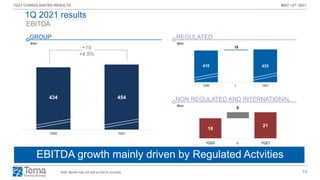
16
21
5
1Q20 ∆ 1Q21
418 433
15
1Q20 ∆ 1Q21
434 454
1Q20 1Q21
EBITDA
Insourcing attività di O&M Rete FS
EBITDA growth mainly driven by Regulated Actvities
Note: figures may not add up due to rounding
€mn
GROUP
€mn
REGULATED
€mn
NON REGULATED AND INTERNATIONAL
+19
+4.5%
1Q 2021 results
11
1Q21 CONSOLIDATED RESULTS MAY 12th 2021
454
291
190 187
163
22
78
EBITDA D&A EBIT Net
Financial
Expenses
Taxes Group
Net Income
Group
Net Income
FY20
From EBITDA to Net Income
Note: figures may not add up due to rounding
1. Attributable to Terna. Excluding Minorities
Well on track to reach all targets
1
€mn
+2% YoY
1Q 2021 results
1Q20
1
1Q21
12
1Q21 CONSOLIDATED RESULTS MAY 12th 2021
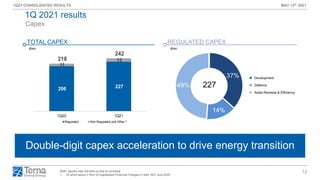
37%
14%
49%
Development
Defence
Asset Renewal & Efficiency
227
206 227
11
15
218
242
1Q20 1Q21
Regulated Non Regulated and Other
Capex
Insourcing attività di O&M Rete FS
Double-digit capex acceleration to drive energy transition
TOTAL CAPEX
€mn
1
REGULATED CAPEX
227
€mn
Development
Defence
Note: figures may not add up due to rounding
1. Of which about 2 €mn of Capitalized Financial Charges in both 2021 and 2020
Asset Renewal & Efficiency
1Q 2021 results
13
1Q21 CONSOLIDATED RESULTS MAY 12th 2021
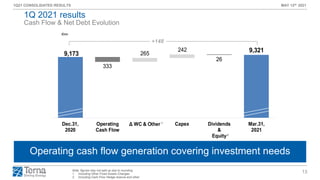
9,173
9,321
333
265
242
26
Dec.31,
2020
Operating
Cash Flow
Δ WC & Other Capex Dividends
&
Equity
Mar.31,
2021
Note: figures may not add up due to rounding
1. Including Other Fixed Assets Changes
2. Including Cash Flow Hedge reserve and other
Cash Flow & Net Debt Evolution
Operating cash flow generation covering investment needs
€mn
2
+148
1
1Q 2021 results
14
1Q21 CONSOLIDATED RESULTS MAY 12th 2021
64%
18%
18%
Terna SpA Bonds
EIB
Banks
11.6 €bn
2
Net Debt Evolution & Financial Structure
1. Percentages and key ratios calculated on Gross Debt nominal value
2. IAS value
Diversified and well-balanced financial structure
GROSS DEBT BREAKDOWN KEY RATIOS
1 1
Fixed/Floating Ratio
Calculated on Gross Debt
81% Fixed
Maturity
~5 years
11.6€bn
2
1Q 2021 results
15
1Q21 CONSOLIDATED RESULTS MAY 12th 2021
Annexes
16
1Q21 CONSOLIDATED RESULTS MAY 12th 2021
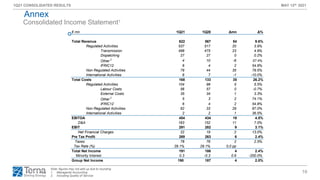
€ mn 1Q21 1Q20 Δmn Δ%
Total Revenue 622 567 54 9.6%
Regulated Activities 537 517 20 3.9%
Transmission 498 475 23 4.9%
Dispatching 27 27 0 0.2%
Other 2
4 10 -6 -56.8%
IFRIC12 6 4 2 54.8%
Non Regulated Activities 79 44 35 79.5%
International Activities 6 7 -1 -10.0%
Total Costs 168 133 35 26.2%
Regulated Activities 104 98 5 5.5%
Labour Costs 56 57 0 -0.7%
External Costs 35 34 1 3.3%
Other 2
5 3 2 74.1%
IFRIC12 6 4 2 54.8%
Non Regulated Activities 62 33 29 87.0%
International Activities 2 2 1 36.5%
EBITDA 454 434 19 4.5%
D&A 163 152 11 7.0%
EBIT 291 282 9 3.1%
Net Financial Charges 22 19 2 13.0%
Pre Tax Profit 269 263 6 2.4%
Taxes 78 76 2 2.5%
Tax Rate (%) 29.1% 29.1% 0,0 pp
Total Net Income 191 186 4 2.4%
Minority Interest 0.3 -0.3 0.6 -200.0%
Group Net Income 190 187 4 2.0%
Consolidated Income Statement1
Annex
Note: figures may not add up due to rounding
1. Managerial Accounting
2. Including Quality of Service
-57.4%
17
1Q21 CONSOLIDATED RESULTS MAY 12th 2021
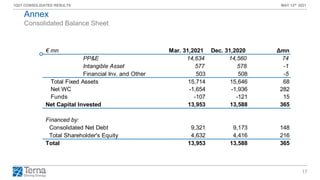
€ mn Mar. 31,2021 Dec. 31,2020 Δmn
PP&E 14,634 14,560 74
Intangible Asset 577 578 -1
Financial Inv. and Other 503 508 -5
Total Fixed Assets 15,714 15,646 68
Net WC -1,654 -1,936 282
Funds -107 -121 15
Net Capital Invested 13,953 13,588 365
Financed by:
Consolidated Net Debt 9,321 9,173 148
Total Shareholder's Equity 4,632 4,416 216
Total 13,953 13,588 365
Consolidated Balance Sheet
Annex
18
1Q21 CONSOLIDATED RESULTS MAY 12th 2021
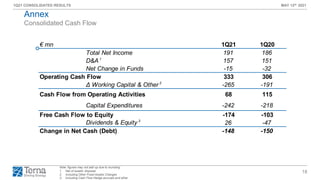
€ mn 1Q21 1Q20
Total Net Income 191 186
D&A 1
157 151
Net Change in Funds -15 -32
Operating Cash Flow 333 306
Δ Working Capital & Other 2
-265 -191
Cash Flow from Operating Activities 68 115
Capital Expenditures -242 -218
Free Cash Flow to Equity -174 -103
Dividends & Equity 3
26 -47
Change in Net Cash (Debt) -148 -150
Consolidated Cash Flow
Annex
Note: figures may not add up due to rounding
1. Net of assets’ disposal
2. Including Other Fixed Assets Changes
3. Including Cash Flow Hedge accruals and other
19
1Q21 CONSOLIDATED RESULTS MAY 12th 2021
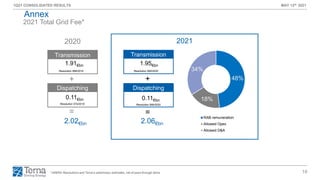
Transmission
Dispatching
+
2.06€bn
Transmission
Dispatching
+
2021
2020
=
=
0.11€bn
1.95€bn
Resolution 565/2020
Resolution 599/2020
2021 Total Grid Fee*
Annex
1.91€bn
Resolution 568/2019
0.11€bn
Resolution 574/2019
2.02€bn
48%
18%
34%
RAB remuneration
Allowed Opex
Allowed D&A
* ARERA Resolutions and Terna’s preliminary estimates, net of pass-through items
20
1Q21 CONSOLIDATED RESULTS MAY 12th 2021
THIS DOCUMENT HAS BEEN PREPARED BY TERNA S.P.A. (THE “COMPANY”) FOR THE SOLE PURPOSE DESCRIBED HEREIN. IN NO CASE MAY IT BE INTERPRETED AS AN
OFFER OR INVITATION TO SELL OR PURCHASE ANY SECURITY ISSUED BY THE COMPANY OR ITS SUBSIDIARIES.
THE CONTENT OF THIS DOCUMENT HAS A MERELY INFORMATIVE AND PROVISIONAL NATURE AND THE STATEMENTS CONTAINED HEREIN HAVE NOT BEEN
INDEPENDENTLY VERIFIED. NEITHER THE COMPANY NOR ANY OF ITS REPRESENTATIVES SHALL ACCEPT ANY LIABILITY WHATSOEVER (WHETHER IN NEGLIGENCE OR
OTHERWISE) ARISING IN ANY WAY FROM THE USE OF THIS DOCUMENT OR ITS CONTENTS OR OTHERWISE ARISING IN CONNECTION WITH THIS DOCUMENT OR ANY
MATERIAL DISCUSSED DURING THE PRESENTATION.
THIS DOCUMENT MAY NOT BE REPRODUCED OR REDISTRIBUTED, IN WHOLE OR IN PART, TO ANY OTHER PERSON. THE INFORMATION CONTAINED HEREIN AND OTHER
MATERIAL DISCUSSED AT THE CONFERENCE CALL MAY INCLUDE FORWARD-LOOKING STATEMENTS THAT ARE NOT HISTORICAL FACTS, INCLUDING STATEMENTS
ABOUT THE COMPANY’S BELIEFS AND EXPECTATIONS. THESE STATEMENTS ARE BASED ON CURRENT PLANS, ESTIMATES, PROJECTIONS AND PROJECTS, AND
CANNOT BE INTERPRETED AS A PROMISE OR GUARANTEE OF WHATSOEVER NATURE.
HOWEVER, FORWARD-LOOKING STATEMENTS INVOLVE INHERENT RISKS AND UNCERTAINTIES AND ARE CURRENT ONLY AT THE DATE THEY ARE MADE. WE CAUTION
YOU THAT A NUMBER OF FACTORS COULD CAUSE THE COMPANY’S ACTUAL RESULTS AND PROVISIONS TO DIFFER MATERIALLY FROM THOSE CONTAINED IN ANY
FORWARD-LOOKING STATEMENT. SUCH FACTORS INCLUDE BUT ARE NOT LIMITED TO: TRENDS IN COMPANY’S BUSINESS, ITS ABILITY TO IMPLEMENT COST-CUTTING
PLANS, CHANGES IN THE REGULATORY ENVIRONMENT, DIFFERENT INTERPRETATION OF THE LAW AND REGULATION, ITS ABILITY TO SUCCESSFULLY DIVERSIFY AND
THE EXPECTED LEVEL OF FUTURE CAPITAL EXPENDITURES. THEREFORE, YOU SHOULD NOT PLACE UNDUE RELIANCE ON SUCH FORWARD-LOOKING STATEMENTS.
TERNA DOES NOT UNDERTAKE ANY OBLIGATION TO UPDATE FORWARD-LOOKING STATEMENTS TO REFLECT ANY CHANGES IN TERNA’S EXPECTATIONS WITH
REGARD THERETO OR ANY CHANGES IN EVENTS.
EXECUTIVE IN CHARGE OF THE PREPARATION OF ACCOUNTING DOCUMENTS “AGOSTINO SCORNAJENCHI” DECLARES, PURSUANT TO PARAGRAPH 2 OF ARTICLE 154-
BIS OF THE CONSOLIDATED LAW ON FINANCE, THAT THE ACCOUNTING INFORMATION CONTAINED IN THIS PRESENTATION, FOR WHAT CONCERNS THE ACTUAL
FIGURES, CORRESPONDS TO THE DOCUMENT RESULTS, BOOKS AND ACCOUNTING RECORDS.
Disclaimer
21
1Q21 CONSOLIDATED RESULTS MAY 12th 2021
Notes
22
1Q21 CONSOLIDATED RESULTS MAY 12th 2021
Notes
23
1Q21 CONSOLIDATED RESULTS MAY 12th 2021
Notes
24
1Q21 CONSOLIDATED RESULTS MAY 12th 2021
investor.relations@terna.it I +39 06 8313 8282 I www.terna.it