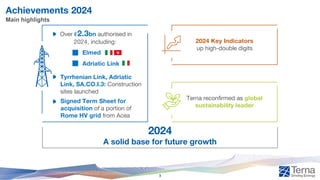
Main highlights
Achievements 2024
Over€2.3bn authorised in
2024, including:
Elmed
Adriatic Link
• Tyrrhenian Link, Adriatic
Link, SA.CO.I.3: Construction
sites launched
2024 Key Indicators
up high-double digits
Terna reconfirmed as global
sustainability leader
2024
A solid base for future growth
• Signed Term Sheet for
acquisition of a portion of
Rome HV grid from Acea
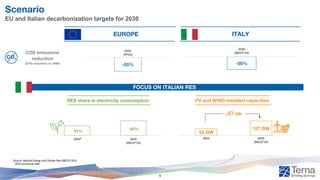
3
41%
63%
2024 2030
(NECP'24)
Scenario
-55%
2030
(FF55)
CO2 emissions
reduction
(GHGreduction vs 1990)
50 GW
107 GW
2024 2030
(NECP'24)
RES share in electricity consumption PV and WIND installed capacities
EUROPE ITALY
+57 GW
EU and Italian decarbonization targets for 2030
FOCUS ON ITALIAN RES
Source: National Energy and Climate Plan (NECP) 2024
* 2024 provisional data
-50%
2030
(NECP'24)
*
5
7.
Scenario
System towards EnergyTransition: Terna’s Role
RENEWABLES
INTEGRATION
STORAGE
MARKET
DESIGN
INFRASTRUCTURE
DEVELOPMENT
6
8.
Scenario
Robust acceleration inRES installed capacity
12 12 13
28
25 30 37
79
2022 2023 Actual
2024
2025 2026 2027 2028 2029 NECP
Policy
2030
Wind Solar
GW
National RES Capacity Evolution1 [GW]
FER 2 Decree
to enable the
development of
innovative RES
FER X Decree
to accelerate solar
and onshore wind
RES capacity evolution
New supportive measures
to achieve NECP Policy 2030
50
43
37
107
1. Source: National Energy and Climate Plan (NECP) 2024
+57
7
9.
Scenario
Supporting integration ofintermittent Renewables through new utility-scale Storage
Capacity
12.9 GWh
+10.1 GWh Vs
2022
Storage capacity needed by 20301 [GWh]
MACSE incentive mechanism will support growth of
utility-scale Storage by accompanying development of
Renewable capacity
Source: Scenarios Description Document (October 2024) developed jointly by Terna and Snam.
1. On top of the existing Hydro-pumping installed capacity.
Current Storage Landscape and NECP 2030 Targets
Electrochemical Storage systems in operation
by end 2024
14
8
50
Small Scale Capacity Market Utility Scale
72 GWh
Source: Terna’s 10-years National Development Plan 2025
8
10.
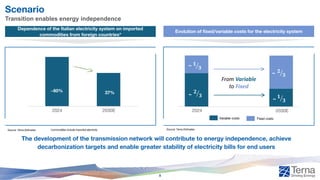
Scenario
Transition enables energyindependence
Evolution of fixed/variable costs for the electricity system
Dependence of the Italian electricity system on imported
commodities from foreign countries*
2024
~ 20
2030E
Variable costs Fixed costs
2024
~ 20
2030E
37%
~60%
Source: Terna Estimates Source: Terna Estimates
The development of the transmission network will contribute to energy independence, achieve
decarbonization targets and enable greater stability of electricity bills for end users
*commodities include imported electricity
ൗ
𝟐
𝟑
ൗ
𝟏
𝟑
From Variable
to Fixed
ൗ
𝟐
𝟑
ൗ
𝟏
𝟑
~
~
~
~
~
9
11.
Scenario
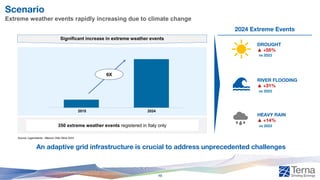
Extreme weather eventsrapidly increasing due to climate change
An adaptive grid infrastructure is crucial to address unprecedented challenges
RIVER FLOODING
▲ +31%
DROUGHT
▲ +55%
HEAVY RAIN
▲ +14%
2015 2024
350 extreme weather events registered in Italy only
6X
vs 2023
vs 2023
vs 2023
2024 Extreme Events
Significant increase in extreme weather events
Source: Legambiente - Bilancio Città Clima 2024
10
12.
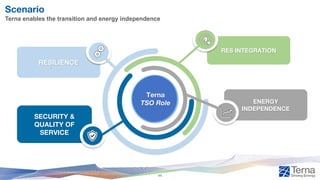
Scenario
Terna enables thetransition and energy independence
ENERGY
INDEPENDENCE
RES INTEGRATION
RESILIENCE
SECURITY &
QUALITY OF
SERVICE
Terna
TSO Role
11
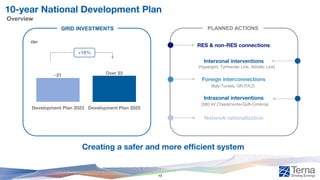
10-year National DevelopmentPlan
Overview
~21 Over 23
Development Plan 2023 Development Plan 2025
RES & non-RES connections
Intrazonal interventions
Foreign interconnections
Interzonal interventions
Network rationalization
€bn
+10%
GRID INVESTMENTS PLANNED ACTIONS
Creating a safer and more efficient system
(Italy-Tunisia, GR.ITA.2)
(Hypergrid, Tyrrhenian Link, Adriatic Link)
(380 kV Chiaramonte-Gulfi-Ciminna)
13
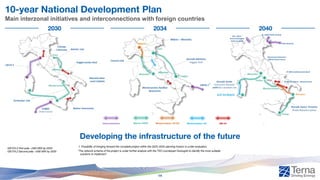
15.
10-year National DevelopmentPlan
Main interzonal initiatives and interconnections with foreign countries
2030 2034 2040
Interconnection Marine HVDC Modernization AC/DC Modernization AC 380 kV
GR.ITA.2 First pole: +500 MW by 2033
GR.ITA.2 Second pole: +500 MW by 2035 *The network scheme of the project is under further analysis with the TSO counterpart Swissgrid to identify the most suitable
solutions to implement
Developing the infrastructure of the future
1. Possibility of bringing forward the complete project within the 2025-2034 planning horizon is under evaluation.
1
*
14
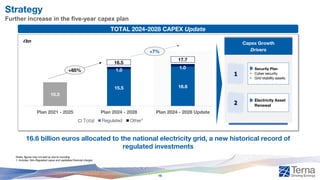
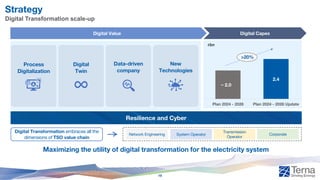
Strategy
Further increase inthe five-year capex plan
16.6 billion euros allocated to the national electricity grid, a new historical record of
regulated investments
TOTAL 2024-2028 CAPEX Update
Notes: figures may not add up due to rounding
1. Includes: Non-Regulated capex and capitalized financial charges
10.0
15.5 16.6
1.0
1.0
Plan 2021 - 2025 Plan 2024 - 2028 Plan 2024 - 2028 Update
Regulated Other
€bn
+65%
+7%
16.5
Capex Growth
Drivers
1
• Security Plan
• Cyber security
• Grid stability assets
• Electricity Asset
Renewal
2
Total 1
17.7
16
18.
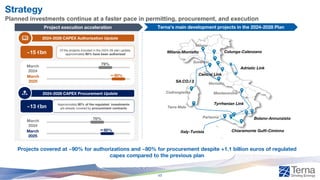
Strategy
Planned investments continueat a faster pace in permitting, procurement, and execution
2024-2028 CAPEX Procurement Update
2024-2028 CAPEX Authorization Update
Milano
Montalto
Milano-Montalto
Central Link
Tyrrhenian Link
SA.CO.I 3
Italy-Tunisia
Partanna
Terra Mala
Codrongianos
Bolano-Annunziata
Chiaramonte Gulfi-Ciminna
Colunga-Calenzano
Adriatic Link
Suvereto
Montecorvino
Terna’s main development projects in the 2024-2028 Plan
Project execution acceleration
March
2024
79%
March
2025
90%
~15 €bn Of the projects included in the 2024-28 plan update,
approximately 90% have been authorized
March
2024
70%
80%
~13 €bn Approximately 80% of the regulated investments
are already covered by procurement contracts
Projects covered at ~90% for authorizations and ~80% for procurement despite +1.1 billion euros of regulated
capex compared to the previous plan
March
2025
~
~
17
19.
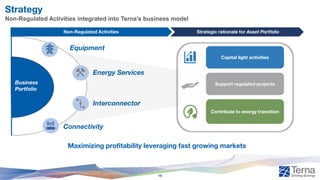
Strategy
Non-Regulated Activities integratedinto Terna’s business model
Maximizing profitability leveraging fast growing markets
Non-Regulated Activities Strategic rationale for Asset Portfolio
Support regulated projects
Contribute to energy transition
Capital light activities
Business
Portfolio
Equipment
Energy Services
Interconnector
Connectivity
18
Strategy
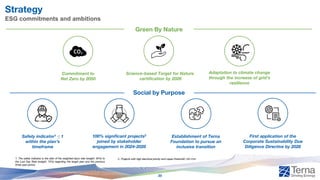
ESG commitments andambitions
Green By Nature
Social by Purpose
Commitment to
Net Zero by 2050
Science-based Target for Nature
certification by 2026
First application of the
Corporate Sustainability Due
Diligence Directive by 2026
Safety indicator1 ≤ 1
within the plan’s
timeframe
100% significant projects2
joined by stakeholder
engagement in 2024-2028
Establishment of Terna
Foundation to pursue an
inclusive transition
1. The safety indicator is the ratio of the weighted injury rate (weight: 30%) to
the Lost Day Rate (weight: 70%) regarding the target year and the previous
three-year period.
2. Projects with high electrical priority and capex threshold >50 €mn
Adaptation to climate change
through the increase of grid’s
resilience
20
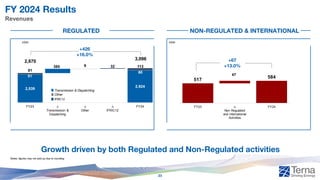
FY 2024 Results
FY2024 Key Numbers
Notes: 1. Attributable to Terna
Group Net Income1
Revenues
EBITDA
Capex
Net Debt
FY 2024 FY 2023 ∆ vs FY 2023
Guidance
€bn
Actual
€mn
Actual
€mn
3,680 3.61 3,187 +15%
2,566 2.50 2,169 +18%
1,062 885 +20%
~1.042
2,692 2.6 2,290 +18%
11,160 10,494
Double digit increase in all P&L lines. Guidance exceeded
2. Equivalent to old reported EPS guidance of 52 €/cents per share
22
24.
FY 2024 Results
Revenues
Notes:figures may not add up due to rounding
€mn €mn
+426
+16.0%
Transmission & Dispatching
Other
IFRIC12
2,539
2,924
51
385 9 32
60
81
113
2,670
3,096
FY23 ∆
Transmission &
Dispatching
∆
Other
∆
IFRIC12
FY24
517
67
584
FY23 ∆
Non Regulated
and International
Activities
FY24
+67
+13.0%
REGULATED NON-REGULATED & INTERNATIONAL
Growth driven by both Regulated and Non-Regulated activities
23
25.
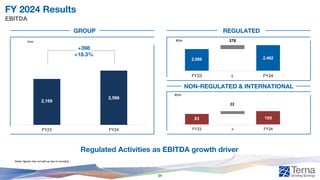
FY 2024 Results
EBITDA
RegulatedActivities as EBITDA growth driver
Notes: figures may not add up due to rounding
€mn
€mn
2,086 2,462
376
FY23 ∆ FY24
83 105
22
FY23 ∆ FY24
€mn
+398
+18.3%
2,169
2,566
FY23 FY24
GROUP REGULATED
NON-REGULATED & INTERNATIONAL
24
26.
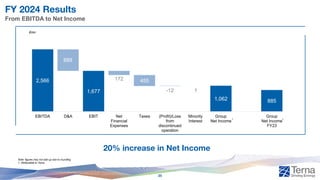
FY 2024 Results
FromEBITDA to Net Income
20% increase in Net Income
€mn
Note: figures may not add up due to rounding
1. Attributable to Terna
2,566
1,677
1,062 885
889
172 455
-12 1
EBITDA D&A EBIT Net
Financial
Expenses
Taxes (Profit)/Loss
from
discontinued
operation
Minority
Interest
Group
Net Income
Group
Net Income
FY23
1 1
25
27.
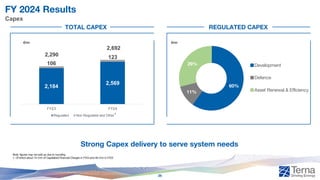
FY 2024 Results
Capex
StrongCapex delivery to serve system needs
Note: figures may not add up due to rounding
1. Of which about 74 €mn of Capitalized Financial Charges in FY24 and 48 €mn in FY23
€mn €mn
1
2,184
2,569
106
123
2,290
2,692
FY23 FY24
Regulated Non Regulated and Other
TOTAL CAPEX REGULATED CAPEX
60%
11%
29% Development
Defence
Asset Renewal & Efficiency
26
28.
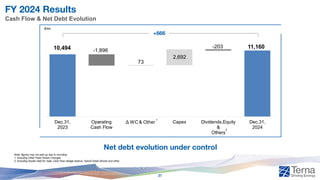
FY 2024 Results
CashFlow & Net Debt Evolution
Net debt evolution under control
Note: figures may not add up due to rounding
1. Including Other Fixed Assets Changes
2. Including Assets Held for Sale, Cash Flow Hedge reserve, Hybrid Green Bonds and other
2
1
10,494 11,160
-1,896
73
2,692
-203
Dec.31,
2023
Operating
Cash Flow
Δ WC & Other Capex Dividends,Equity
&
Others
Dec.31,
2024
€mn
+666
27
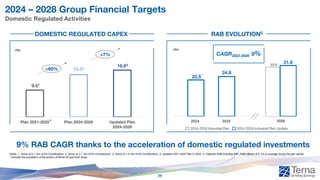
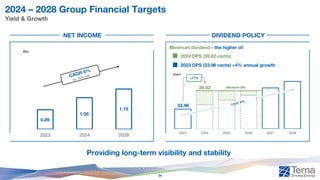
2024 2025 2028
2024– 2028 Group Financial Targets
Domestic Regulated Activities
€bn
CAGR2023-2028 9%
€bn
Notes: 1. Gross of 0.1 €bn of EU Contributions 2. Gross of 1.1 €bn of EU Contributions 3. Gross of 1.0 €bn of EU Contributions 4. Updated 2021-2025 Plan in 2022 5. Calendar RAB including WIP. RAB inflation at 2.7% on average during the plan period
* Includes the acquisition of the portion of Rome HV grid from Acea.
+60%
+7%
DOMESTIC REGULATED CAPEX RAB EVOLUTION5
Plan 2021-2025 Plan 2024-2028 Updated Plan
2024-2028
4 2025
*
9.61
15.52
16.63
22.5
24.8
31.8
30.6
2024-2028 Industrial Plan Update
2024-2028 Industrial Plan
2024
9% RAB CAGR thanks to the acceleration of domestic regulated investments
29
31.
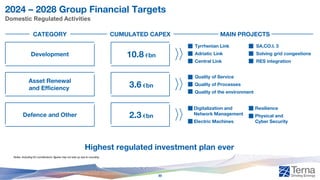
2024 – 2028Group Financial Targets
Domestic Regulated Activities
Notes: Including EU contributions; figures may not add up due to rounding
CATEGORY CUMULATED CAPEX MAIN PROJECTS
Development
Tyrrhenian Link
Adriatic Link
Central Link
SA.CO.I. 3
Solving grid congestions
RES integration
10.8 €bn
Asset Renewal
and Efficiency
Quality of Service
Quality of Processes
Quality of the environment
3.6 €bn
Defence and Other
Digitalization and
Network Management
Electric Machines
Resilience
Physical and
Cyber Security
2.3 €bn
Highest regulated investment plan ever
30
32.
2024 – 2028Group Financial Targets
Regulatory milestones
Towards ROSS model
2024 2025 2026 2027 2028
Start of ROSS Base
Renewal of the output-
based regulation related
the increase of inter-zonal
transmission capacity
for the period 2024-2027
WACC updated for the
period 2025-2027
Transmission 5.5%
Current regulatory period New regulatory period
Start of new WACC
period
Start of the new
regulatory period, with
updated general tariff
criteria and incentives
regulation
Renewal of the output-
based regulation related
to the reduction of
dispatching costs
for the period 2024-2030
Introduction of ROSS
Integrale regulation
31
33.
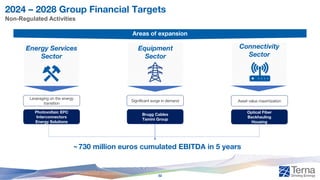
2024 – 2028Group Financial Targets
Non-Regulated Activities
730 million euros cumulated EBITDA in 5 years
Equipment
Sector
Connectivity
Sector
Energy Services
Sector
Areas of expansion
Photovoltaic EPC
Interconnectors
Energy Solutions
Leveraging on the energy
transition
Brugg Cables
Tamini Group
Significant surge in demand
Optical Fiber
Backhauling
Housing
Asset value maximization
~
32
34.
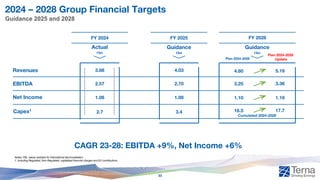
2024 – 2028Group Financial Targets
Guidance 2025 and 2028
Notes: P&L values restated for International deconsolidation
1. Including Regulated, Non-Regulated, capitalized financial charges and EU contributions
Revenues
EBITDA
Capex1
Net Income
FY 2024 FY 2025
Guidance
€bn
Actual
€bn
3.68 4.03
2.57 2.70
1.06 1.08
2.7 3.4
CAGR 23-28: EBITDA +9%, Net Income +6%
FY 2028
Guidance
€bn
4.60
3.25
1.10
16.5
5.19
3.36
17.7
1.19
Cumulated 2024-2028
Plan 2024-2028
Plan 2024-2028
Update
33
Closing Remarks
Strengthening Terna’srole in decarbonization and energy independence process,
contributing to higher stability of electricity bills
1
Focus on execution of our investment plan
2
Accelerating returns while maintaining financial stability
3
Ensuring a balanced mix of yield and growth
4
5 A Twin Transition for a Just Transition
37
Annexes
Consolidated Income Statement1
Notes:figures may not add up due to rounding;
1. Managerial Accounting
2. Including Quality of Service
€ mn FY24 FY23 Δmn Δ%
Total Revenue 3,680 3,187 494 15.5%
Regulated Activities 3,096 2,670 426 16.0%
Transmission 2,424 2,108 316 15.0%
Dispatching 500 431 69 16.0%
Other² 60 51 9 17.9%
IFRIC12 113 81 32 40.1%
Non Regulated and International Activities 584 517 67 13.0%
Total Costs 1,114 1,018 96 9.4%
Regulated Activities 635 584 51 8.6%
Labour Costs 295 285 10 3.5%
External Costs 193 187 6 3.2%
Other² 34 31 2 7.4%
IFRIC12 113 81 32 40.1%
Non Regulated Activities 476 430 46 10.8%
International Activities 3 4 -1 -27.5%
EBITDA 2,566 2,169 398 18.3%
D&A 889 806 83 10.3%
EBIT 1,677 1,362 315 23.1%
Net Financial Charges 172 118 54 45.7%
Pre Tax Profit 1,506 1,245 261 21.0%
Taxes 455 364 91 24.9%
Tax Rate (%) 30.2% 29.3% - 0.9 pp
Net Income 1,051 880 171 19.4%
Net Financial Charges
Profit/(Loss) From Discontinued Operations 12 3 9 -364.0%
Total Net Income 1,063 883 180 20.4%
Minority Interest 1 -3 3 -123.1%
Group Net Income 1,062 885 177 19.9%
40
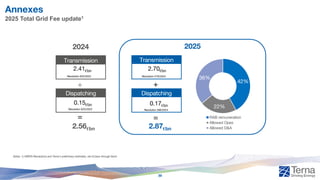
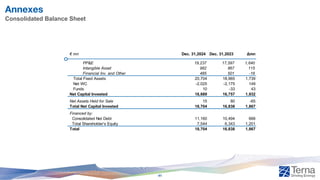
42.
Annexes
Consolidated Balance Sheet
€mn Dec. 31,2024 Dec. 31,2023 Δmn
PP&E 19,237 17,597 1,640
Intangible Asset 982 867 115
Financial Inv. and Other 485 501 -16
Total Fixed Assets 20,704 18,965 1,739
Net WC -2,025 -2,175 149
Funds 10 -33 43
Net Capital Invested 18,689 16,757 1,932
Net Assets Held for Sale 15 80 -65
Total Net Capital Invested 18,704 16,838 1,867
Financed by:
Consolidated Net Debt 11,160 10,494 666
Total Shareholder's Equity 7,544 6,343 1,201
Total 18,704 16,838 1,867
41
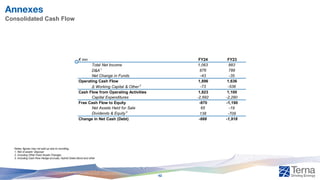
43.
Annexes
Consolidated Cash Flow
€mn FY24 FY23
Total Net Income 1,063 883
D&A1
876 788
Net Change in Funds -43 -35
Operating Cash Flow 1,896 1,636
Δ Working Capital & Other 2
-73 -536
Cash Flow from Operating Activities 1,823 1,100
Capital Expenditures -2,692 -2,290
Free Cash Flow to Equity -870 -1,190
Net Assets Held for Sale 65 -19
Dividends & Equity 3
138 -709
Change in Net Cash (Debt) -666 -1,918
Notes: figures may not add up due to rounding;
1. Net of assets’ disposal
2. Including Other Fixed Assets Changes
3. Including Cash Flow Hedge accruals, Hybrid Green Bond and other
42
44.
Disclaimer
THIS DOCUMENT HASBEEN PREPARED BY TERNA S.P.A. (THE “COMPANY”) FOR THE SOLE PURPOSE DESCRIBED HEREIN. IN NO CASE MAY IT BE INTERPRETED AS AN OFFER
OR INVITATION TO SELL OR PURCHASE ANY SECURITY ISSUED BY THE COMPANY OR ITS SUBSIDIARIES.
THE CONTENT OF THIS DOCUMENT HAS A MERELY INFORMATIVE AND PROVISIONAL NATURE AND THE STATEMENTS CONTAINED HEREIN HAVE NOT BEEN INDEPENDENTLY
VERIFIED. NEITHER THE COMPANY NOR ANY OF ITS REPRESENTATIVES SHALL ACCEPT ANY LIABILITY WHATSOEVER (WHETHER IN NEGLIGENCE OR OTHERWISE) ARISING IN
ANY WAY FROM THE USE OF THIS DOCUMENT OR ITS CONTENTS OR OTHERWISE ARISING IN CONNECTION WITH THIS DOCUMENT OR ANY MATERIAL DISCUSSED DURING THE
PRESENTATION.
THIS DOCUMENT MAY NOT BE REPRODUCED OR REDISTRIBUTED, IN WHOLE OR IN PART, TO ANY OTHER PERSON. THE INFORMATION CONTAINED HEREIN AND OTHER
MATERIAL DISCUSSED AT THE CONFERENCE CALL MAY INCLUDE FORWARD-LOOKING STATEMENTS THAT ARE NOT HISTORICAL FACTS, INCLUDING STATEMENTS ABOUT THE
COMPANY’S BELIEFS AND EXPECTATIONS. THESE STATEMENTS ARE BASED ON CURRENT PLANS, ESTIMATES, PROJECTIONS AND PROJECTS, AND CANNOT BE INTERPRETED
AS A PROMISE OR GUARANTEE OF WHATSOEVER NATURE.
HOWEVER, FORWARD-LOOKING STATEMENTS INVOLVE INHERENT RISKS AND UNCERTAINTIES AND ARE CURRENT ONLY AT THE DATE THEY ARE MADE. WE CAUTION YOU
THAT A NUMBER OF FACTORS COULD CAUSE THE COMPANY’S ACTUAL RESULTS AND PROVISIONS TO DIFFER MATERIALLY FROM THOSE CONTAINED IN ANY FORWARD-
LOOKING STATEMENT. SUCH FACTORS INCLUDE, BUT ARE NOT LIMITED TO: TRENDS IN COMPANY’S BUSINESS, ITS ABILITY TO IMPLEMENT COST-CUTTING PLANS, CHANGES
IN THE REGULATORY ENVIRONMENT, DIFFERENT INTERPRETATION OF THE LAW AND REGULATION, ITS ABILITY TO SUCCESSFULLY DIVERSIFY AND THE EXPECTED LEVEL OF
FUTURE CAPITAL EXPENDITURES. THEREFORE, YOU SHOULD NOT PLACE UNDUE RELIANCE ON SUCH FORWARD-LOOKING STATEMENTS. TERNA DOES NOT UNDERTAKE ANY
OBLIGATION TO UPDATE FORWARD-LOOKING STATEMENTS TO REFLECT ANY CHANGES IN TERNA’S EXPECTATIONS WITH REGARD THERETO OR ANY CHANGES IN EVENTS.
EXECUTIVE IN CHARGE OF THE PREPARATION OF ACCOUNTING DOCUMENTS “FRANCESCO BECCALI” DECLARES, PURSUANT TO PARAGRAPH 2 OF ARTICLE 154-BIS OF THE
CONSOLIDATED LAW ON FINANCE, THAT THE ACCOUNTING INFORMATION CONTAINED IN THIS PRESENTATION, FOR WHAT CONCERNS THE ACTUAL FIGURES, CORRESPONDS
TO THE DOCUMENT RESULTS, BOOKS AND ACCOUNTING RECORDS.
43

![Scenario
Robust acceleration in RES installed capacity
12 12 13
28
25 30 37
79
2022 2023 Actual
2024
2025 2026 2027 2028 2029 NECP
Policy
2030
Wind Solar
GW
National RES Capacity Evolution1 [GW]
FER 2 Decree
to enable the
development of
innovative RES
FER X Decree
to accelerate solar
and onshore wind
RES capacity evolution
New supportive measures
to achieve NECP Policy 2030
50
43
37
107
1. Source: National Energy and Climate Plan (NECP) 2024
+57
7](https://image.slidesharecdn.com/terna20242028industrialplanupdatepresentation-250325183219-ec57d0eb/85/Terna_2024_2028_Industrial_Plan_Update_Presentation-pdf-8-320.jpg)
![Scenario
Supporting integration of intermittent Renewables through new utility-scale Storage
Capacity
12.9 GWh
+10.1 GWh Vs
2022
Storage capacity needed by 20301 [GWh]
MACSE incentive mechanism will support growth of
utility-scale Storage by accompanying development of
Renewable capacity
Source: Scenarios Description Document (October 2024) developed jointly by Terna and Snam.
1. On top of the existing Hydro-pumping installed capacity.
Current Storage Landscape and NECP 2030 Targets
Electrochemical Storage systems in operation
by end 2024
14
8
50
Small Scale Capacity Market Utility Scale
72 GWh
Source: Terna’s 10-years National Development Plan 2025
8](https://image.slidesharecdn.com/terna20242028industrialplanupdatepresentation-250325183219-ec57d0eb/85/Terna_2024_2028_Industrial_Plan_Update_Presentation-pdf-9-320.jpg)