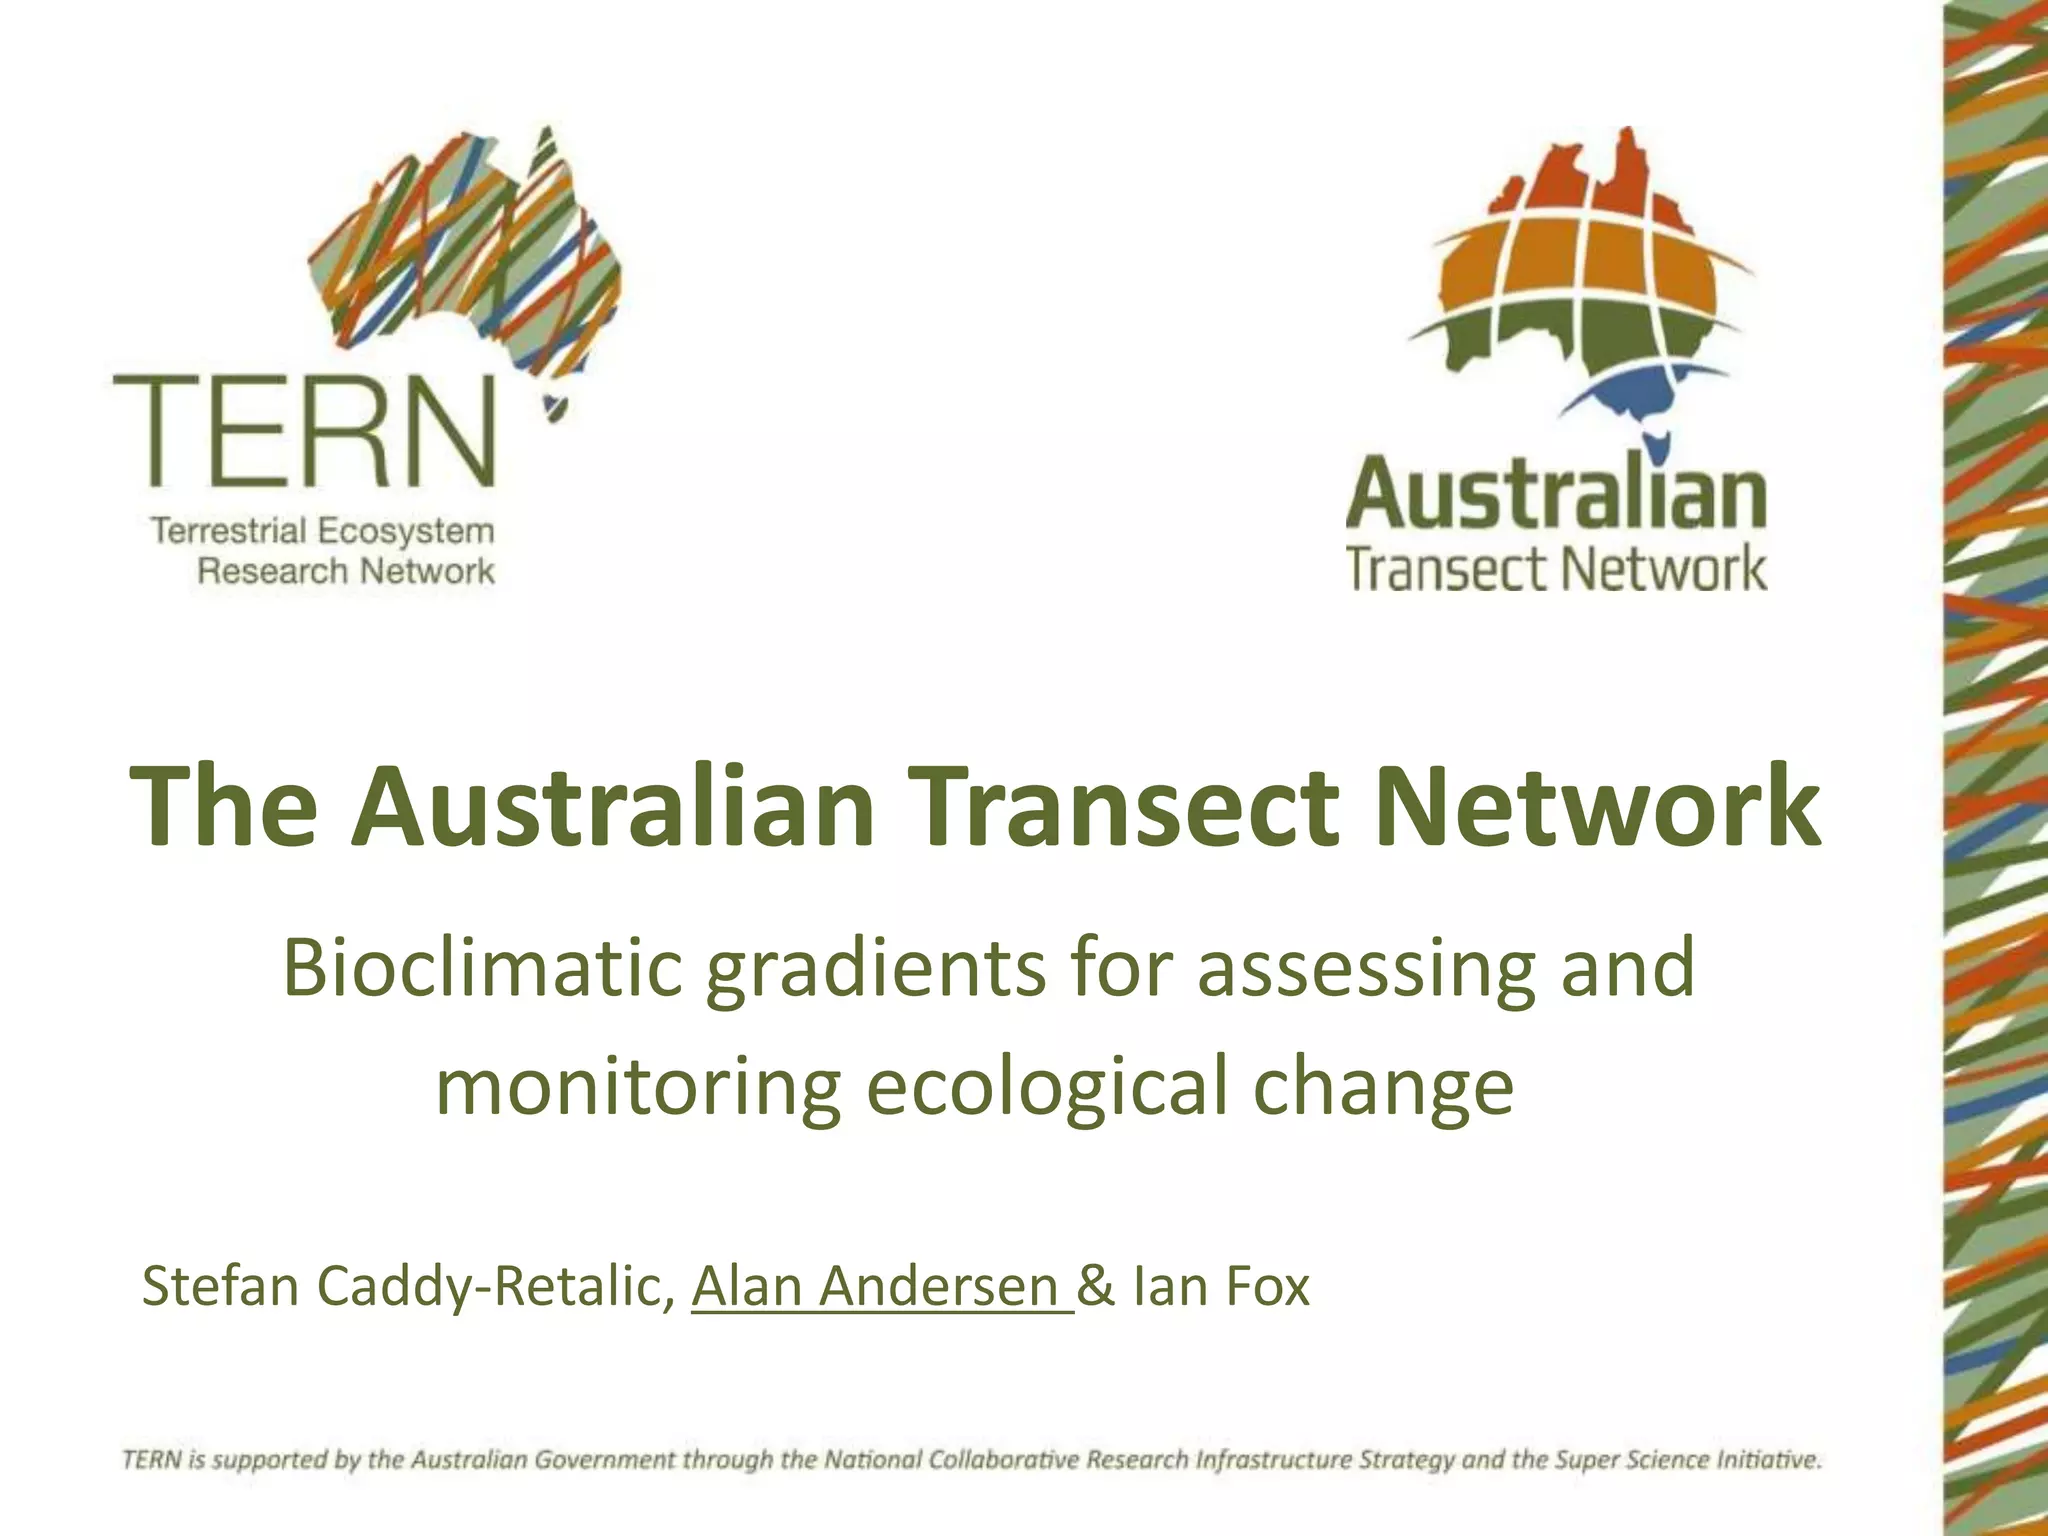
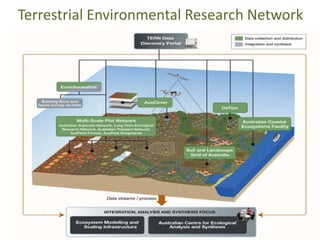
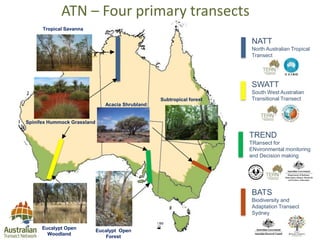
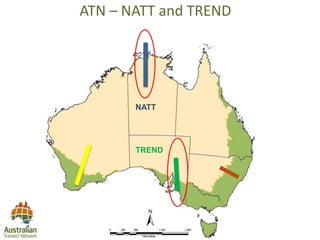
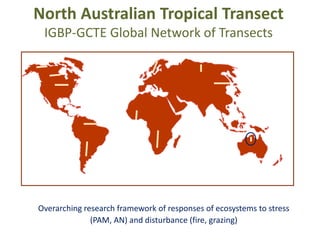
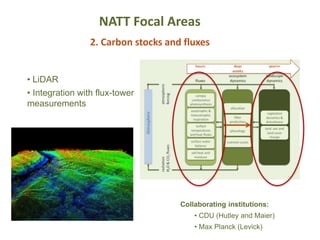
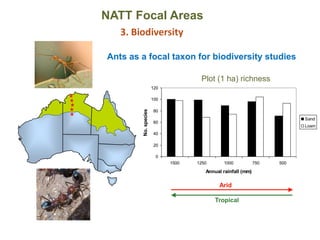
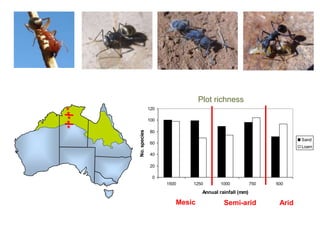
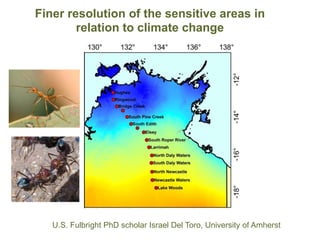
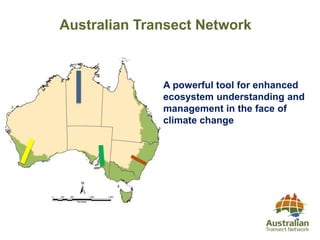
The Australian Transect Network
Bioclimatic gradients for assessing and
monitoring ecological change
Stefan Caddy-Retalic, Alan Andersen & Ian Fox
Terrestrial Environmental Research Network
ATN – Four primary transects
NATT
North Australian Tropical
Transect
SWATT
South West Australian
Transitional Transect
BATS
Biodiversity and
Adaptation Transect
Sydney
TREND
TRansect for
ENvironmental monitoring
and Decision making
ATN – Four primary transects
Spinifex Hummock Grassland
Tropical Savanna
NATT
North Australian Tropical
Transect
SWATT
South West Australian
Transitional Transect
BATS
Biodiversity and
Adaptation Transect
Sydney
Acacia Shrubland
TREND
TRansect for
ENvironmental monitoring
and Decision making
Eucalypt Open
Forest
Subtropical forest
Eucalypt Open
Woodland
Why bioclimatic transects?
• Scaling-up from local, plot-based studies
• Biogeographic framework for locating plots
Why bioclimatic transects?
• Scaling-up from local, plot-based studies
• Developing, calibrating and validating ecological models and
remote sensing products
Why bioclimatic transects?
• Scaling-up from local, plot-based studies
• Developing, calibrating and validating ecological models and
remote sensing products
• Identifying sensitive zones in relation to environmental stress
and disturbance
• Space as a proxy for time for climate-change research
Key Science Questions
1. How do species abundances, richness and composition, and
ecological function change along large-scale environmental
gradients?
Key Science Questions
1. How do species abundances, richness and composition, and
ecological function change along large-scale environmental
gradients?
2. Is there predictable variation in ecosystem resilience?
Key Science Questions
1. How do species abundances, richness and composition, and
ecological function change along large-scale environmental
gradients?
2. Is there predictable variation in ecosystem resilience?
3. How might ecosystems respond to climate change?
• Turnover in species, adaptive traits and genes
ATN – NATT and TREND
NATT
TREND
Overarching research framework of responses of ecosystems to stress
(PAM, AN) and disturbance (fire, grazing)
North Australian Tropical Transect
IGBP-GCTE Global Network of Transects
DARWIN
TENNANT CREEK
500 mm
750 mm
1000 mm
1250 mm
1500 mm
Photos: Adam Liedloff
North Australian Tropical Transect
NATT Focal Areas
DARWIN
TENNANT
CREEK
Growth of tagged trees
• Site every 100 km
• 12 eucalypts tagged per site
• Initial measurements 2000
• Re-measured 2012
1. Tree dynamics
Tree growth along NATT
0
0.05
0.1
0.15
0.2
0.25
0
0.1
0.2
0.3
0.4
0.5
0 500 1000 1500 2000
Heightincrement(m/yr)
DBHincrement(cm/yr)
Median annual rainfall (mm)
G. D. Cook, unpublished
Height (for tree with 25 cm dbh)
DBH
Monitoring tree dynamics using LiDAR
NATT Focal Areas
2. Carbon stocks and fluxes
0
0.2
0.4
0.6
0.8
1
1.2
0 500 1000 1500 2000
Sand
Loam
Tree cover and rainfall
NATT Focal Areas
2. Carbon stocks and fluxes
0
0.2
0.4
0.6
0.8
1
1.2
0 500 1000 1500 2000
Sand
Loam
0
2
4
6
8
0 1 2 3 4 5
log DBH (cm)
logBiomass(kg)
-1
0
1
2
3
4
5
0.0 0.5 1.0 1.5 2.0 2.5 3.0 3.5 4.0 4.5
log tree DBH (cm)
logrootbiomass(kg/m2)
Tree carbon stocks – above ground Tree carbon stocks – below ground
Tree cover and rainfall
Biomass as predicted by DBH
NATT Focal Areas
2. Carbon stocks and fluxes
• LiDAR for landscape-scale
assessments
NATT Focal Areas
2. Carbon stocks and fluxes
• LiDAR
• Integration with flux-tower
measurements
Collaborating institutions:
• CDU (Hutley and Maier)
• Max Planck (Levick)
0
20
40
60
80
100
120
1500 1250 1000 750 500
Annual rainfall (mm)
No.species
Sand
Loam
Plot (1 ha) richness
Tropical
Arid
Ants as a focal taxon for biodiversity studies
NATT Focal Areas
3. Biodiversity
Ant biogeographic discontinuities
0
20
40
60
80
100
120
1500 1250 1000 750 500
Annual rainfall (mm)
No.species Sand
Loam
Plot richness
Mesic Semi-arid Arid
Finer resolution of the sensitive areas in
relation to climate change
U.S. Fulbright PhD scholar Israel Del Toro, University of Amherst
NATT Focal Areas
4. Ecological processes - Fire
• 400,000 km2 burnt each
year
• Biodiversity declines
• GHG abatement
NATT Focal Areas
4. Ecological processes - Fire
y = -2E-07x2 + 0.0008x - 0.145
R² = 0.8489
-0.1
0
0.1
0.2
0.3
0.4
0.5
0.6
0.7
0.8
0 200 400 600 800 1000 1200 1400 1600 1800
Mean % area burnt
Mean annual rainfall
NATT Focal Areas
4. Ecological processes - Fire
y = 2E-07x2 - 3E-05x + 0.0106
R² = 0.787
0
0.1
0.2
0.3
0.4
0.5
0.6
0 500 1000 1500 2000
Early dry season
y = -4E-07x2 + 0.0008x - 0.1556
R² = 0.6897
-0.05
0
0.05
0.1
0.15
0.2
0.25
0.3
0.35
0.4
0 500 1000 1500 2000
Late dry season
Mean annual rainfall Mean annual rainfall
Transect for Environmental Monitoring and
Decision-making
Vegetation turn-over quantified
Guerin & Lowe EMAS 2012
Guerin et al. 2013
 35 Plots
 Soil characterisation
 Floral composition
 Vegetation structure
 Ant communities
 Metagenomics
 Photopoints
Temperature loggers
 δ13C & δ15N isotopes
Current and
predicted
future
species
distributions
Now
2050
Current and
predicted
future
species
distributions
Now
2050
Mapping
sensitivity to
climate change
Detecting ecosystem changes over time: implications for the future
Orchids flowering
20 days earlier
than 20 years ago
Flowering phenology
Detecting ecosystem changes over time: implications for the future
Orchids flowering
20 days earlier
than 20 years ago
Hop Bush leaves
narrowing over
the last century
Flowering phenology Functional traits
Using new genomics
techniques
Plants
•DNA barcoding
•Biogeography
•Population Genetics/Genomics
Soils
•Metabarcoding
McCallum et al AustEcol 2013
Gene turn-over in plants and soil
Genomics, metagenomics and transcriptomics
Integrating information on biodiversity distribution
and climate sensitivity for biodiversity resilience
• Weighted benefit maps for policy and land
management decision makers
Connecting the public to research is a TREND priority.
This should be a two-way dialogue.
Australian Transect Network
A powerful tool for enhanced
ecosystem understanding and
management in the face of
climate change

TERN Australian Transect Network ATBC 2014

  • 1.
    The Australian TransectNetwork Bioclimatic gradients for assessing and monitoring ecological change Stefan Caddy-Retalic, Alan Andersen & Ian Fox
  • 2.
  • 3.
    ATN – Fourprimary transects NATT North Australian Tropical Transect SWATT South West Australian Transitional Transect BATS Biodiversity and Adaptation Transect Sydney TREND TRansect for ENvironmental monitoring and Decision making
  • 4.
    ATN – Fourprimary transects Spinifex Hummock Grassland Tropical Savanna NATT North Australian Tropical Transect SWATT South West Australian Transitional Transect BATS Biodiversity and Adaptation Transect Sydney Acacia Shrubland TREND TRansect for ENvironmental monitoring and Decision making Eucalypt Open Forest Subtropical forest Eucalypt Open Woodland
  • 5.
    Why bioclimatic transects? •Scaling-up from local, plot-based studies • Biogeographic framework for locating plots
  • 6.
    Why bioclimatic transects? •Scaling-up from local, plot-based studies • Developing, calibrating and validating ecological models and remote sensing products
  • 7.
    Why bioclimatic transects? •Scaling-up from local, plot-based studies • Developing, calibrating and validating ecological models and remote sensing products • Identifying sensitive zones in relation to environmental stress and disturbance • Space as a proxy for time for climate-change research
  • 8.
    Key Science Questions 1.How do species abundances, richness and composition, and ecological function change along large-scale environmental gradients?
  • 9.
    Key Science Questions 1.How do species abundances, richness and composition, and ecological function change along large-scale environmental gradients? 2. Is there predictable variation in ecosystem resilience?
  • 10.
    Key Science Questions 1.How do species abundances, richness and composition, and ecological function change along large-scale environmental gradients? 2. Is there predictable variation in ecosystem resilience? 3. How might ecosystems respond to climate change? • Turnover in species, adaptive traits and genes
  • 11.
    ATN – NATTand TREND NATT TREND
  • 12.
    Overarching research frameworkof responses of ecosystems to stress (PAM, AN) and disturbance (fire, grazing) North Australian Tropical Transect IGBP-GCTE Global Network of Transects
  • 13.
    DARWIN TENNANT CREEK 500 mm 750mm 1000 mm 1250 mm 1500 mm Photos: Adam Liedloff North Australian Tropical Transect
  • 14.
    NATT Focal Areas DARWIN TENNANT CREEK Growthof tagged trees • Site every 100 km • 12 eucalypts tagged per site • Initial measurements 2000 • Re-measured 2012 1. Tree dynamics
  • 15.
    Tree growth alongNATT 0 0.05 0.1 0.15 0.2 0.25 0 0.1 0.2 0.3 0.4 0.5 0 500 1000 1500 2000 Heightincrement(m/yr) DBHincrement(cm/yr) Median annual rainfall (mm) G. D. Cook, unpublished Height (for tree with 25 cm dbh) DBH
  • 16.
  • 17.
    NATT Focal Areas 2.Carbon stocks and fluxes 0 0.2 0.4 0.6 0.8 1 1.2 0 500 1000 1500 2000 Sand Loam Tree cover and rainfall
  • 18.
    NATT Focal Areas 2.Carbon stocks and fluxes 0 0.2 0.4 0.6 0.8 1 1.2 0 500 1000 1500 2000 Sand Loam 0 2 4 6 8 0 1 2 3 4 5 log DBH (cm) logBiomass(kg) -1 0 1 2 3 4 5 0.0 0.5 1.0 1.5 2.0 2.5 3.0 3.5 4.0 4.5 log tree DBH (cm) logrootbiomass(kg/m2) Tree carbon stocks – above ground Tree carbon stocks – below ground Tree cover and rainfall Biomass as predicted by DBH
  • 19.
    NATT Focal Areas 2.Carbon stocks and fluxes • LiDAR for landscape-scale assessments
  • 20.
    NATT Focal Areas 2.Carbon stocks and fluxes • LiDAR • Integration with flux-tower measurements Collaborating institutions: • CDU (Hutley and Maier) • Max Planck (Levick)
  • 21.
    0 20 40 60 80 100 120 1500 1250 1000750 500 Annual rainfall (mm) No.species Sand Loam Plot (1 ha) richness Tropical Arid Ants as a focal taxon for biodiversity studies NATT Focal Areas 3. Biodiversity
  • 22.
    Ant biogeographic discontinuities 0 20 40 60 80 100 120 15001250 1000 750 500 Annual rainfall (mm) No.species Sand Loam Plot richness Mesic Semi-arid Arid
  • 23.
    Finer resolution ofthe sensitive areas in relation to climate change U.S. Fulbright PhD scholar Israel Del Toro, University of Amherst
  • 24.
    NATT Focal Areas 4.Ecological processes - Fire • 400,000 km2 burnt each year • Biodiversity declines • GHG abatement
  • 25.
    NATT Focal Areas 4.Ecological processes - Fire y = -2E-07x2 + 0.0008x - 0.145 R² = 0.8489 -0.1 0 0.1 0.2 0.3 0.4 0.5 0.6 0.7 0.8 0 200 400 600 800 1000 1200 1400 1600 1800 Mean % area burnt Mean annual rainfall
  • 26.
    NATT Focal Areas 4.Ecological processes - Fire y = 2E-07x2 - 3E-05x + 0.0106 R² = 0.787 0 0.1 0.2 0.3 0.4 0.5 0.6 0 500 1000 1500 2000 Early dry season y = -4E-07x2 + 0.0008x - 0.1556 R² = 0.6897 -0.05 0 0.05 0.1 0.15 0.2 0.25 0.3 0.35 0.4 0 500 1000 1500 2000 Late dry season Mean annual rainfall Mean annual rainfall
  • 28.
    Transect for EnvironmentalMonitoring and Decision-making Vegetation turn-over quantified Guerin & Lowe EMAS 2012 Guerin et al. 2013  35 Plots  Soil characterisation  Floral composition  Vegetation structure  Ant communities  Metagenomics  Photopoints Temperature loggers  δ13C & δ15N isotopes
  • 29.
  • 30.
  • 31.
    Detecting ecosystem changesover time: implications for the future Orchids flowering 20 days earlier than 20 years ago Flowering phenology
  • 32.
    Detecting ecosystem changesover time: implications for the future Orchids flowering 20 days earlier than 20 years ago Hop Bush leaves narrowing over the last century Flowering phenology Functional traits
  • 33.
    Using new genomics techniques Plants •DNAbarcoding •Biogeography •Population Genetics/Genomics Soils •Metabarcoding McCallum et al AustEcol 2013 Gene turn-over in plants and soil Genomics, metagenomics and transcriptomics
  • 34.
    Integrating information onbiodiversity distribution and climate sensitivity for biodiversity resilience • Weighted benefit maps for policy and land management decision makers
  • 35.
    Connecting the publicto research is a TREND priority. This should be a two-way dialogue.
  • 36.
    Australian Transect Network Apowerful tool for enhanced ecosystem understanding and management in the face of climate change