Download as PDF, PPTX
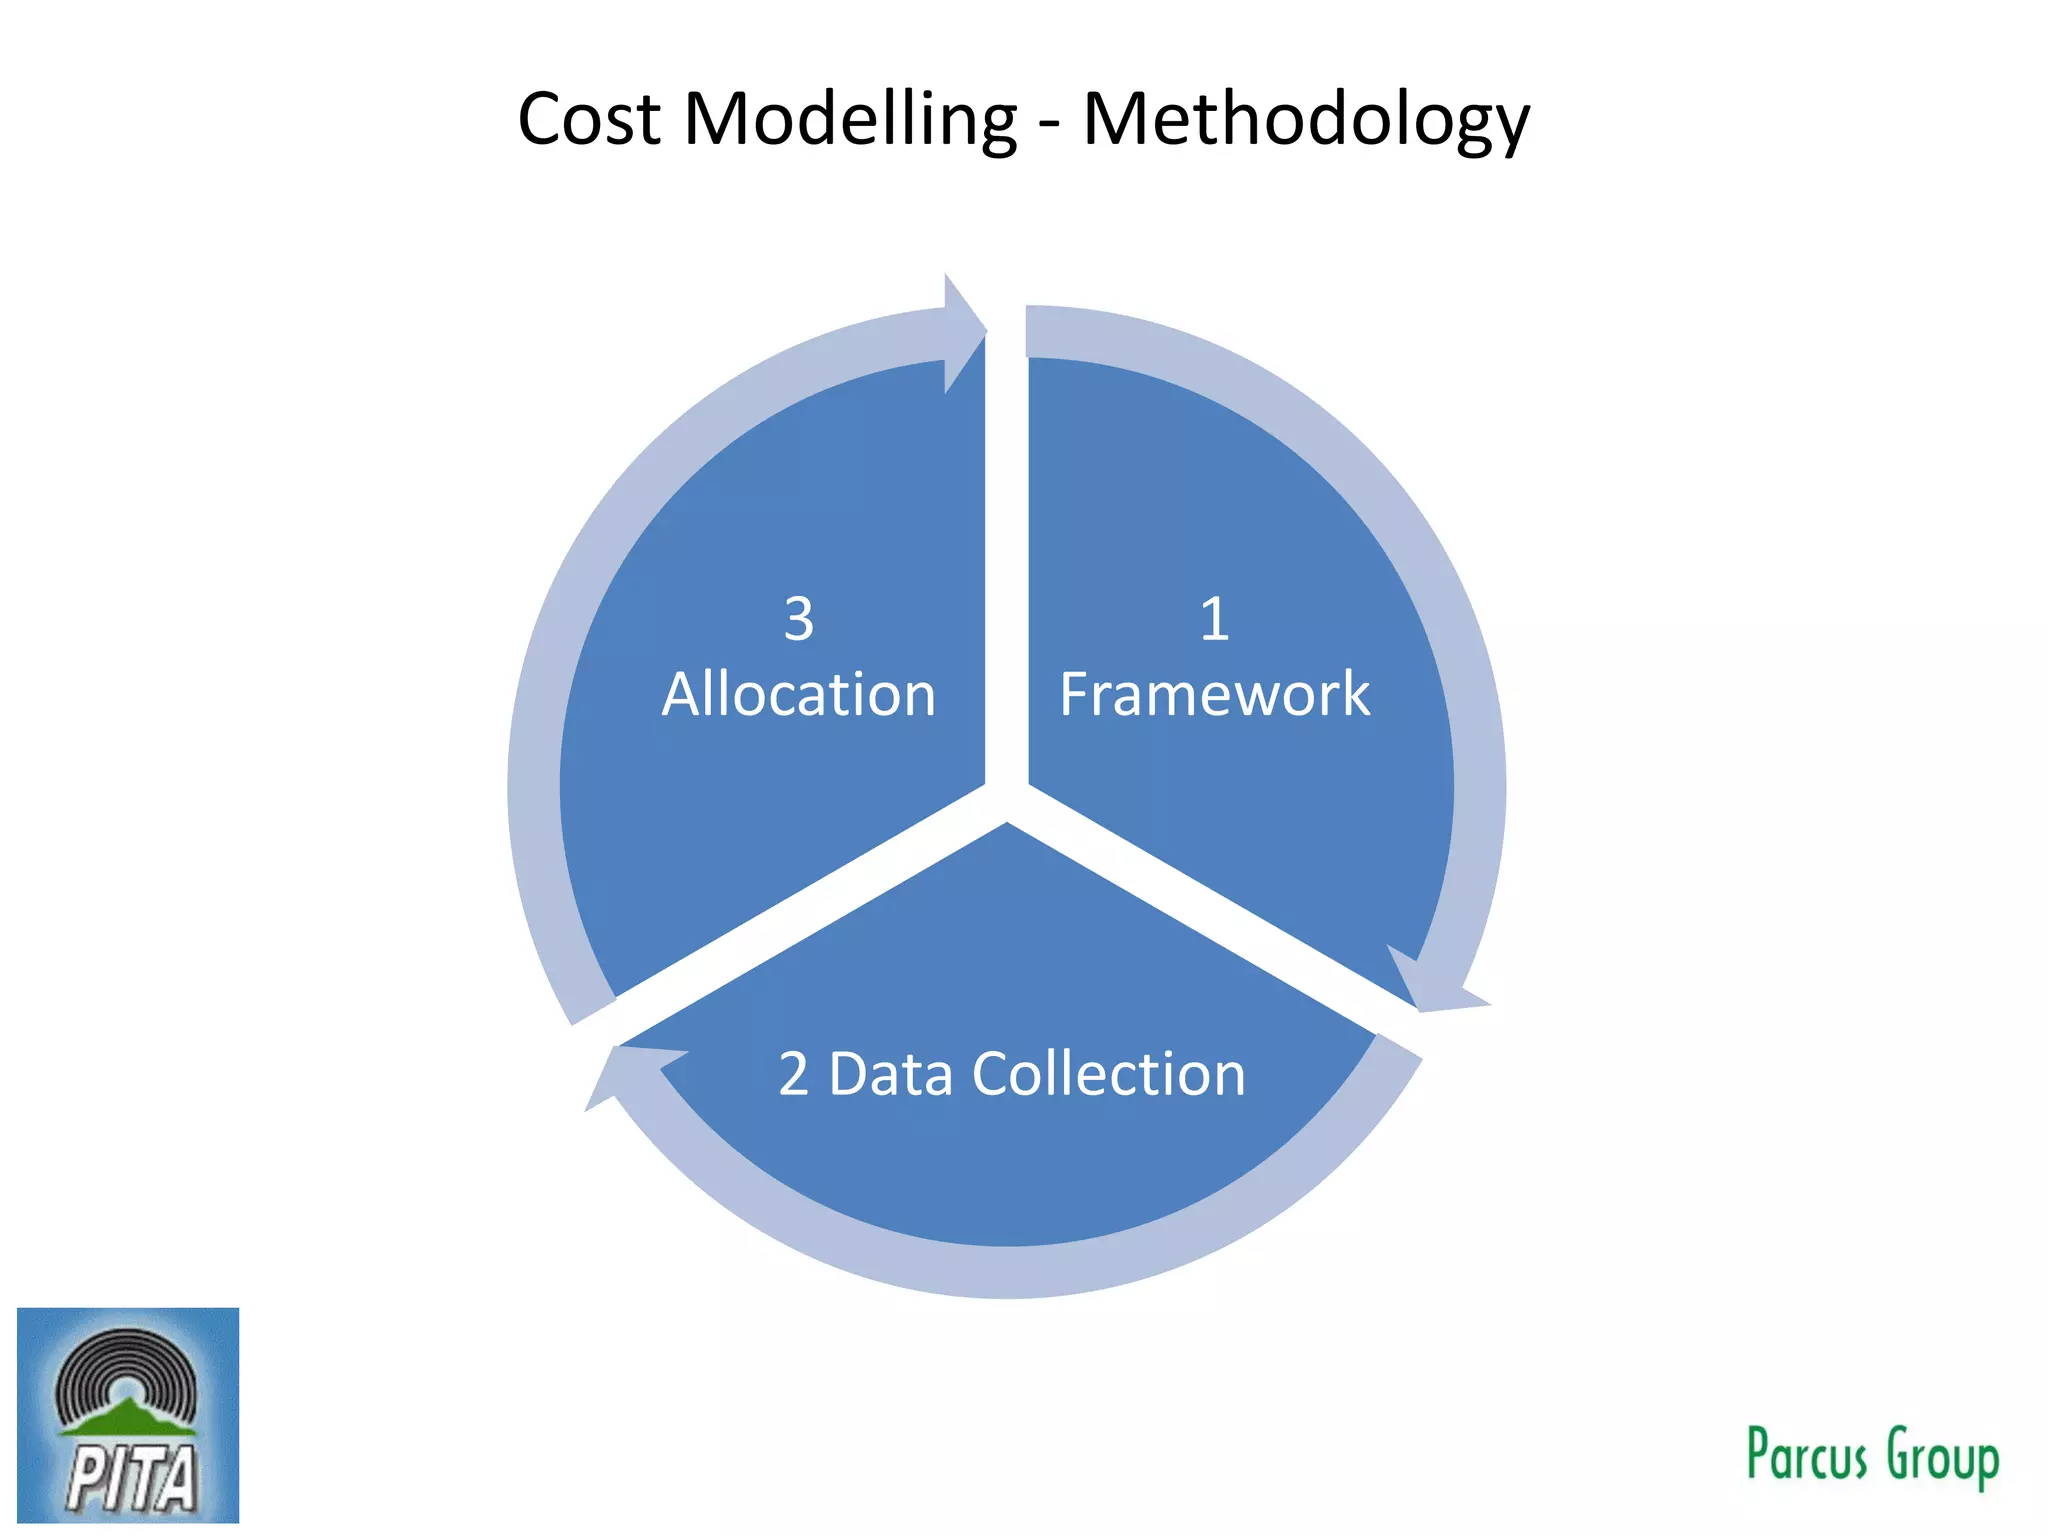
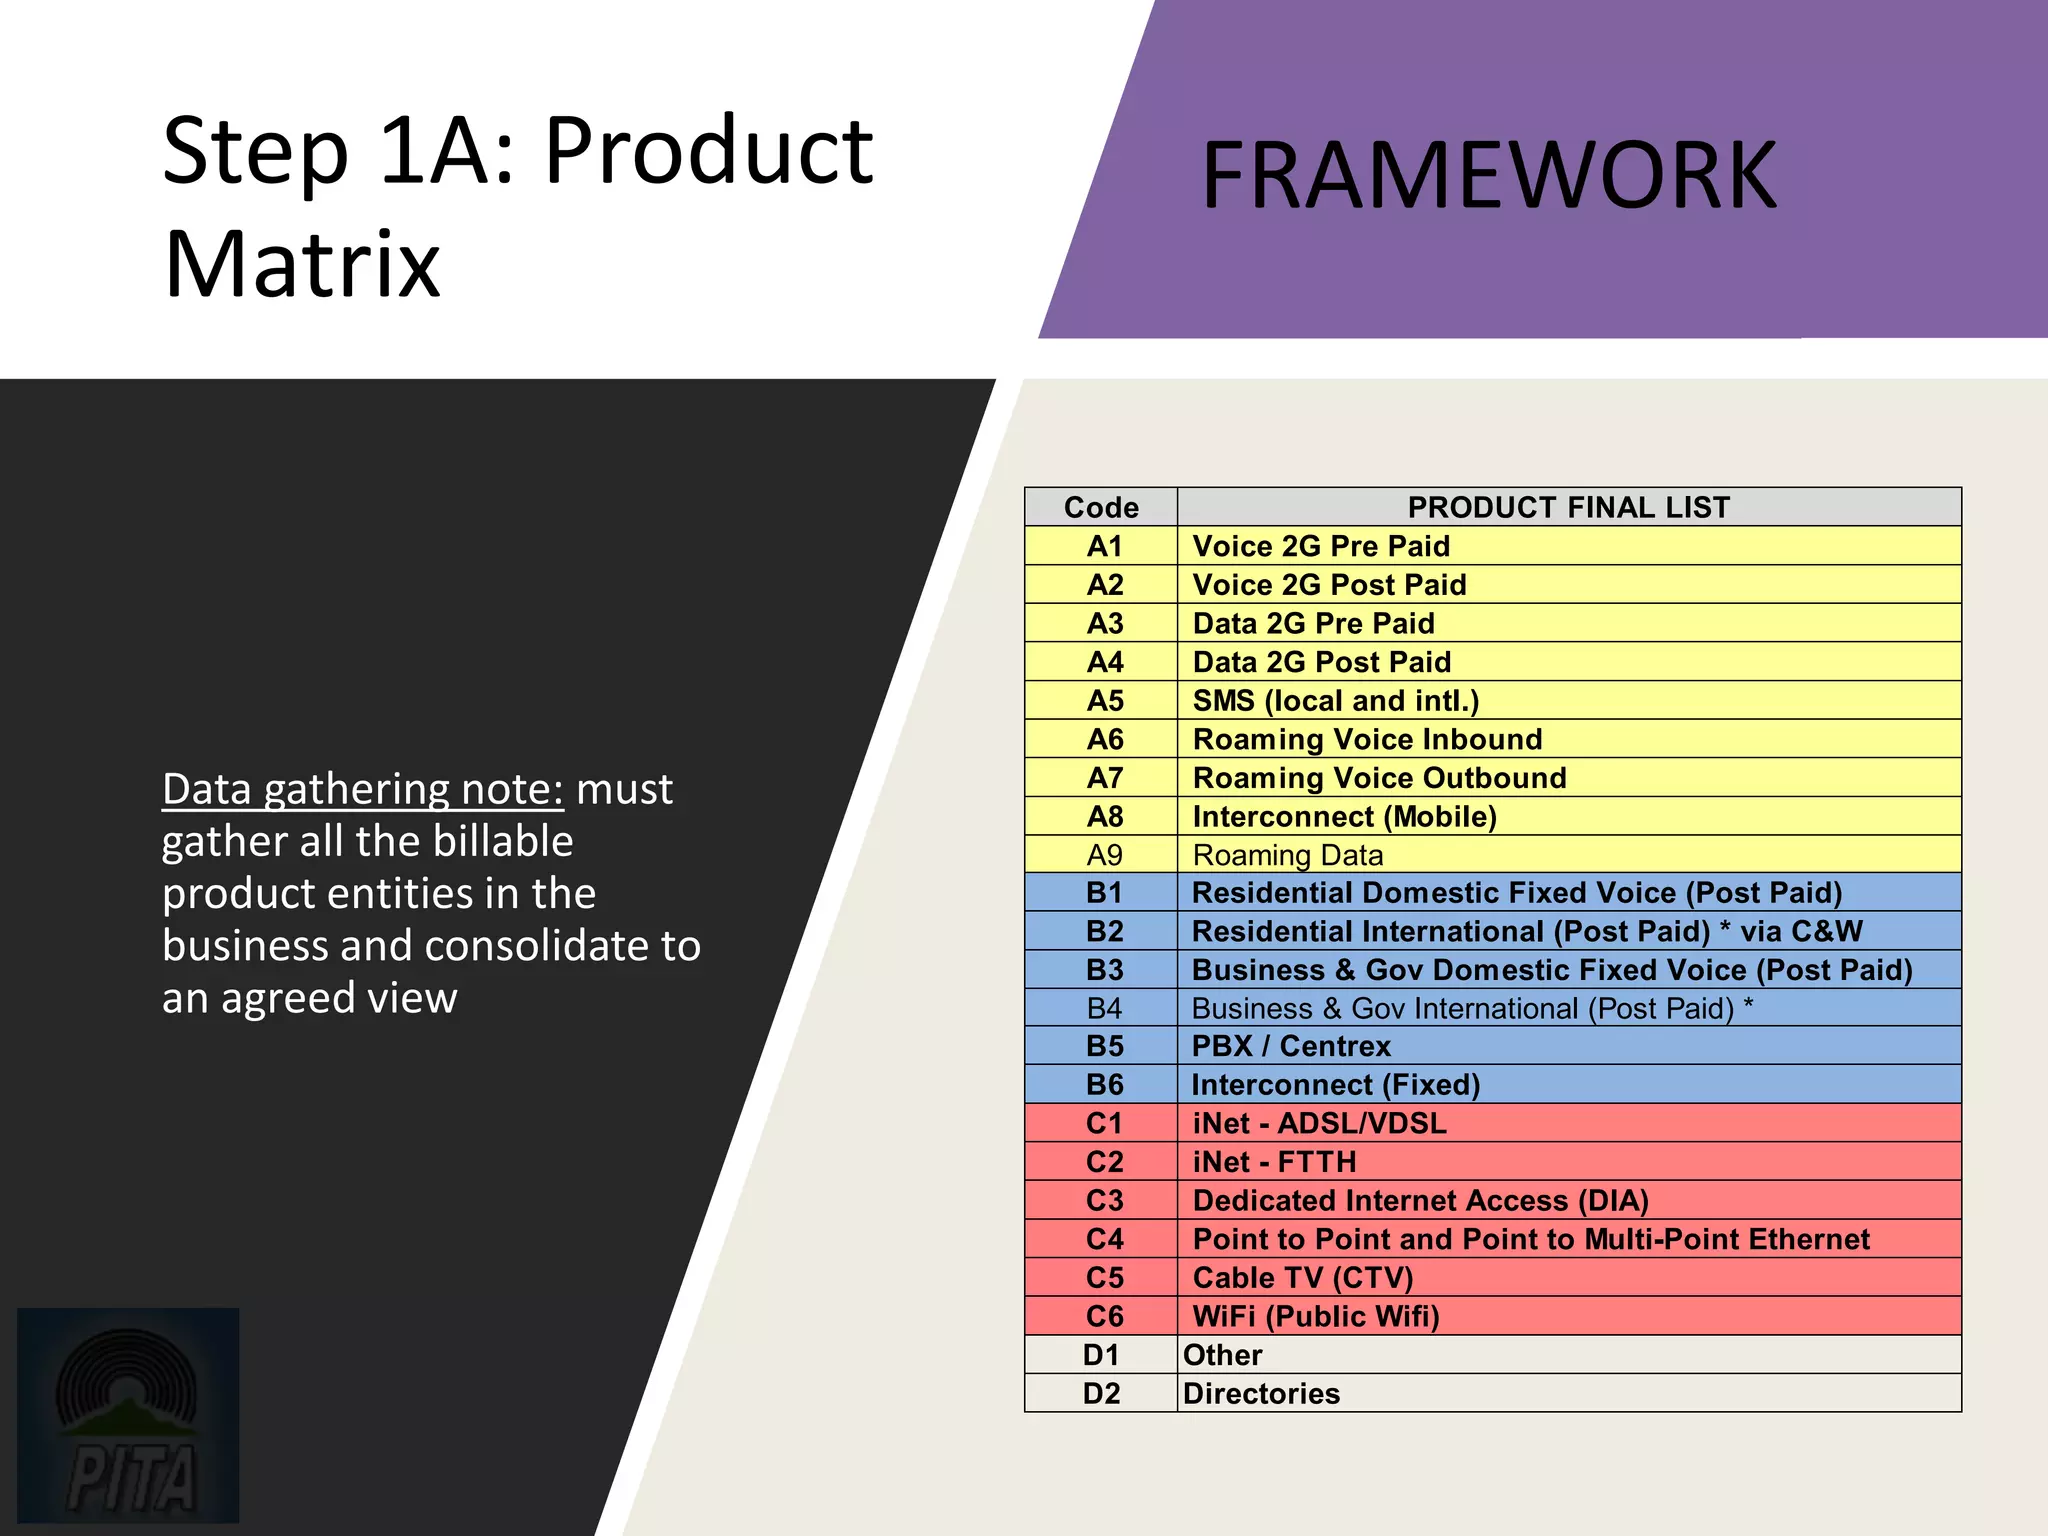
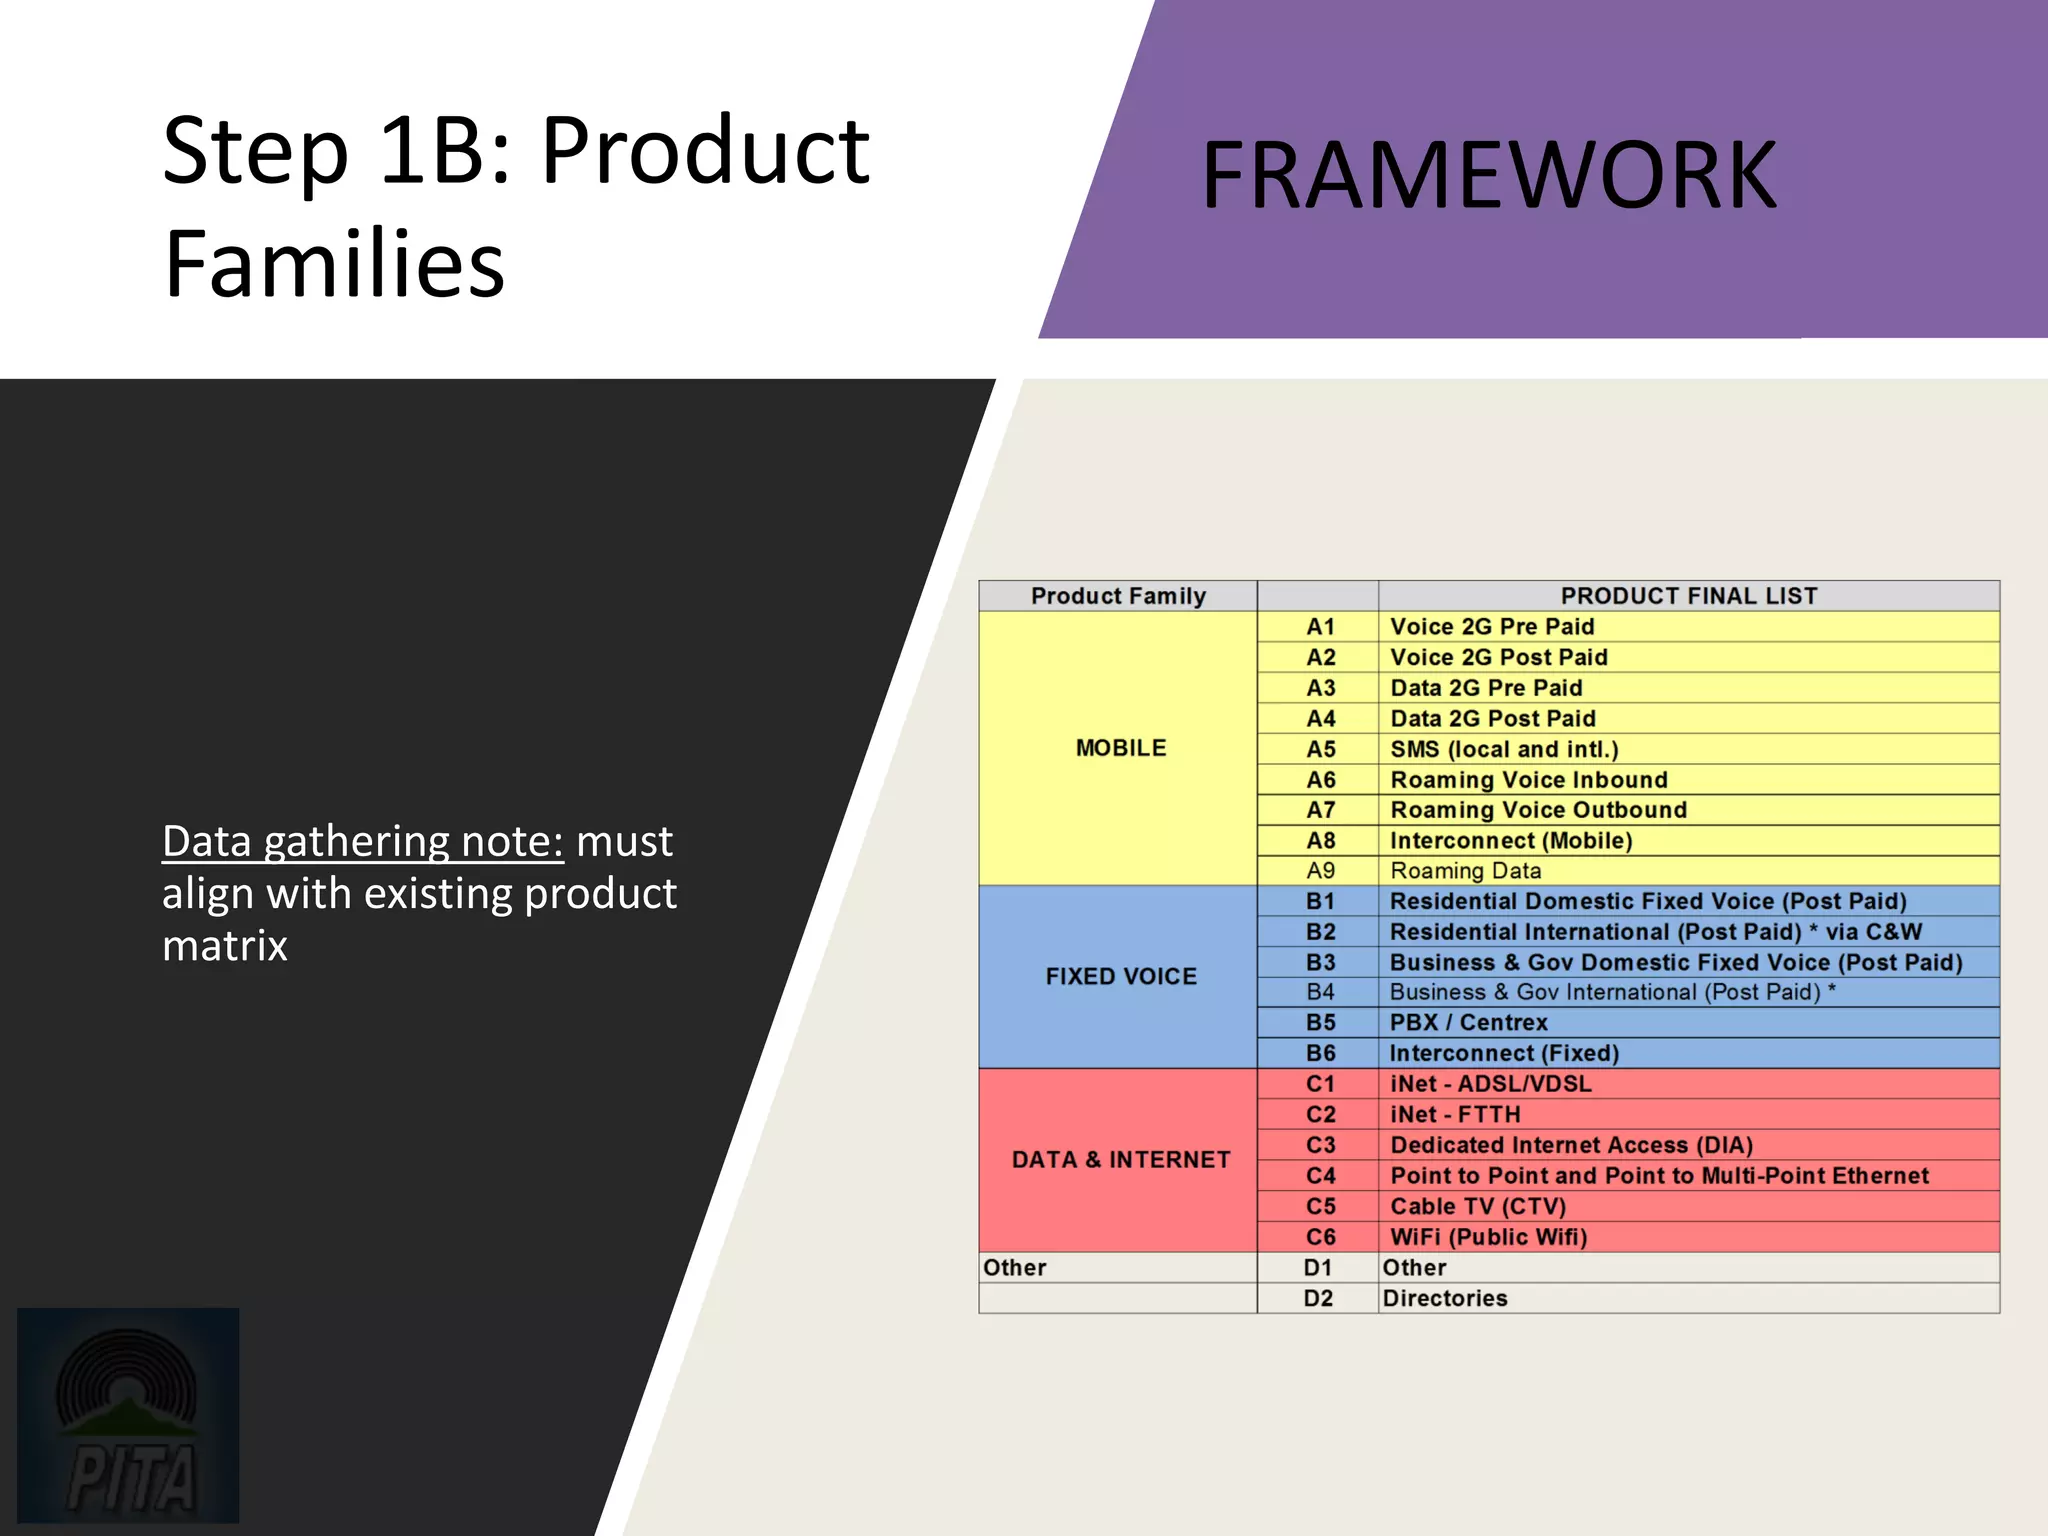
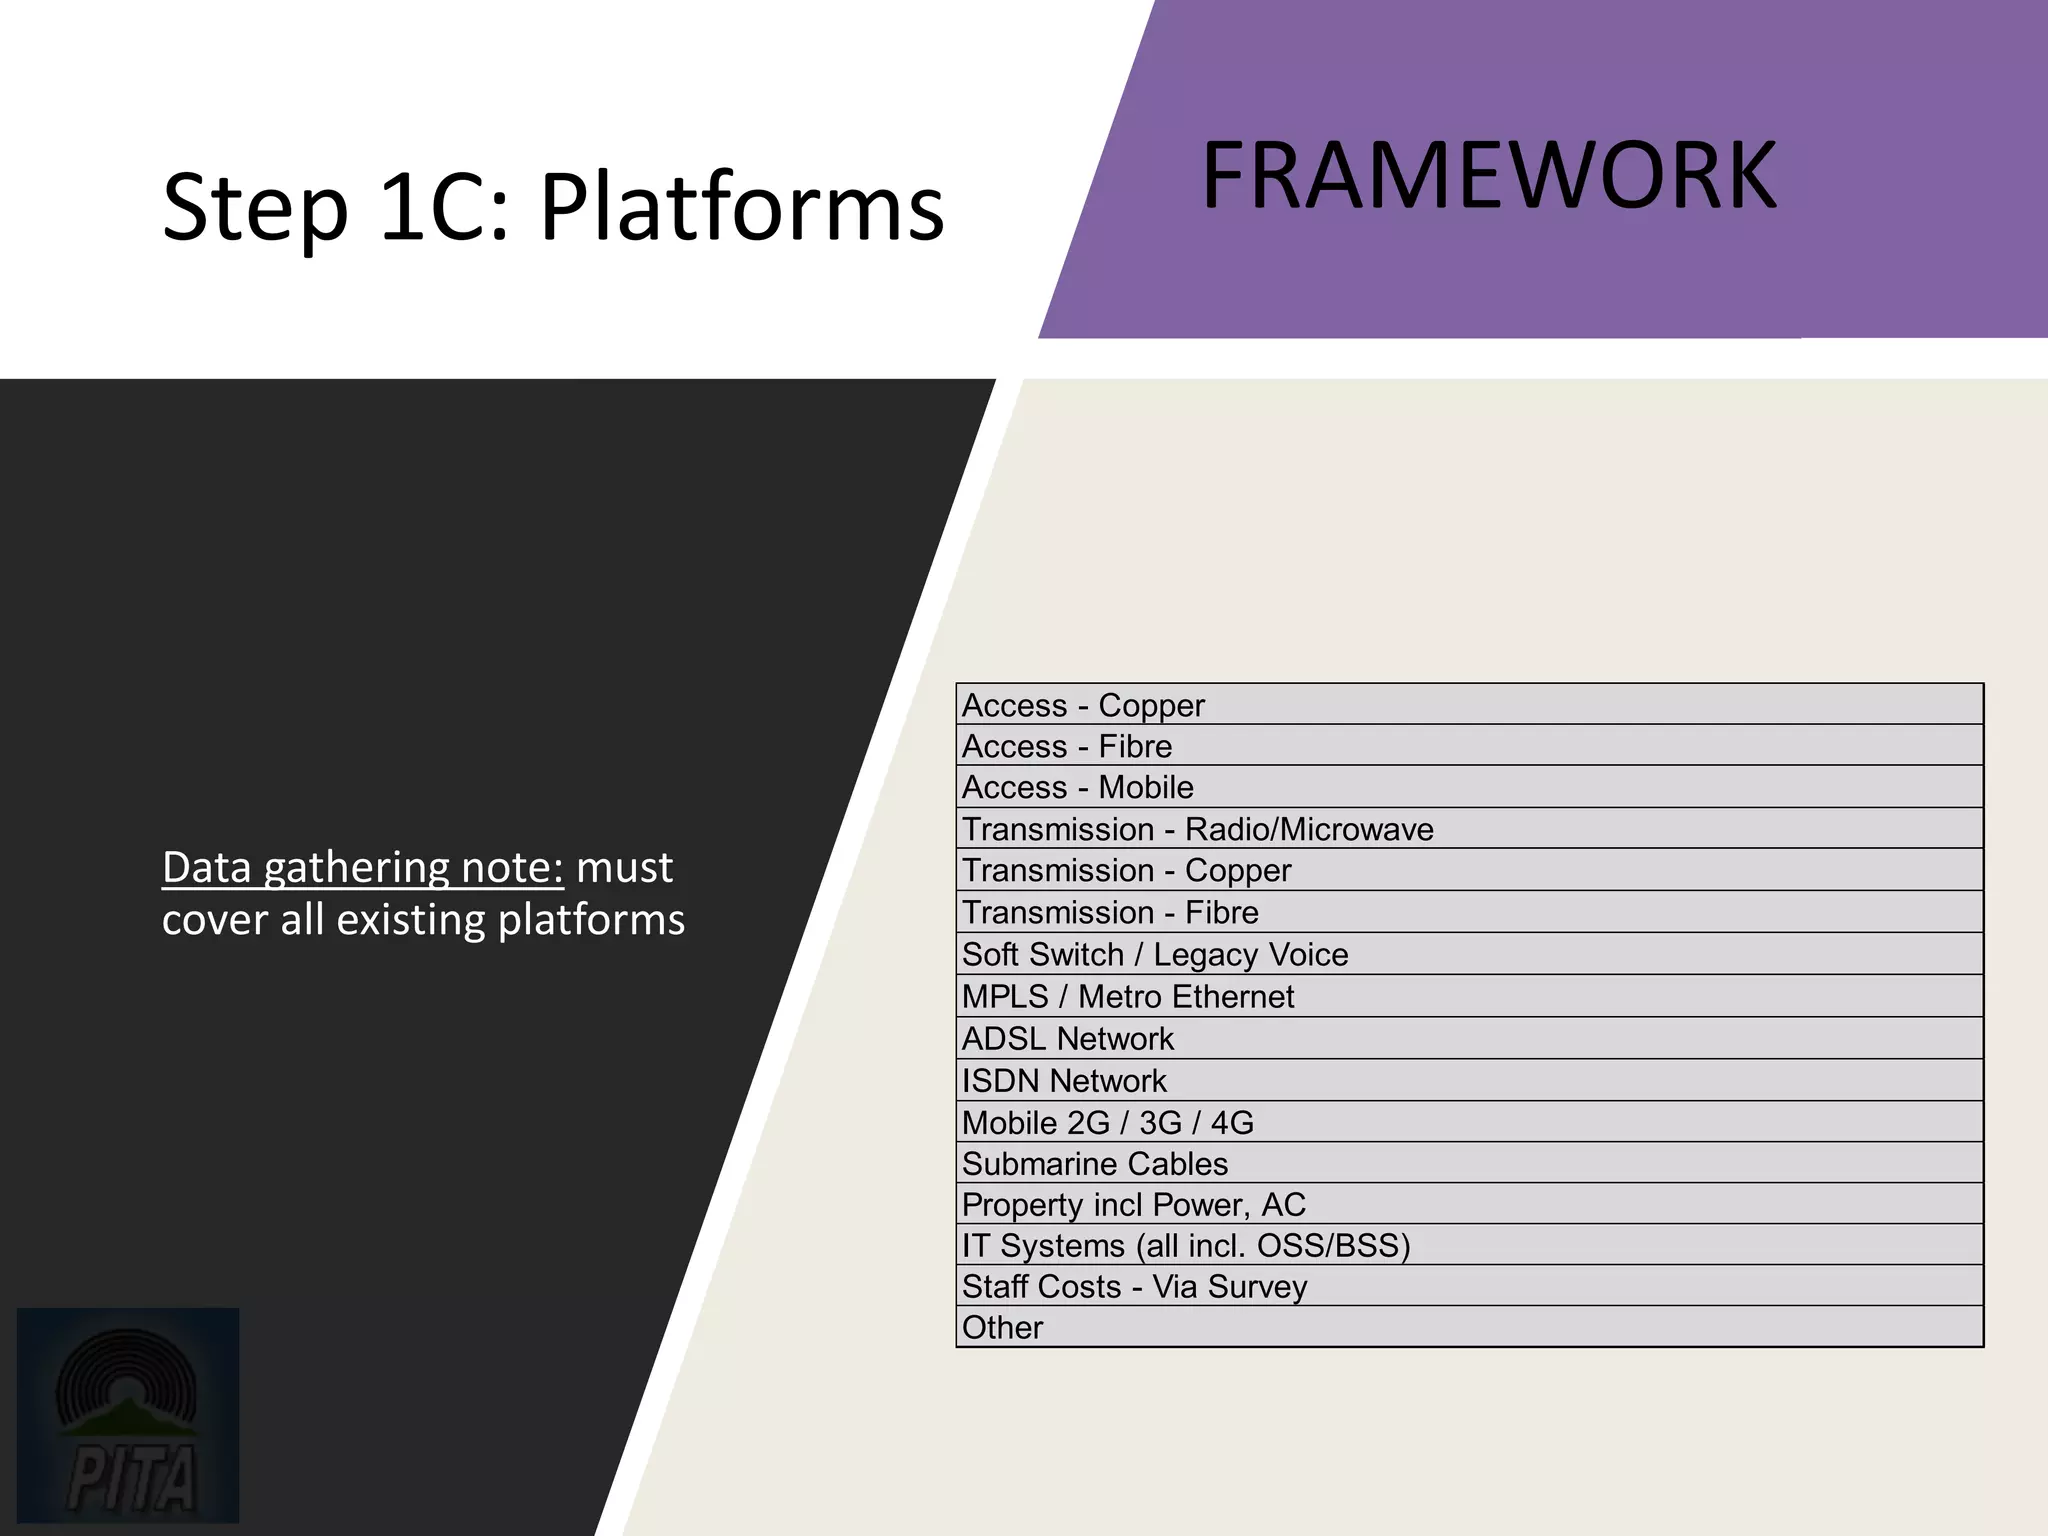

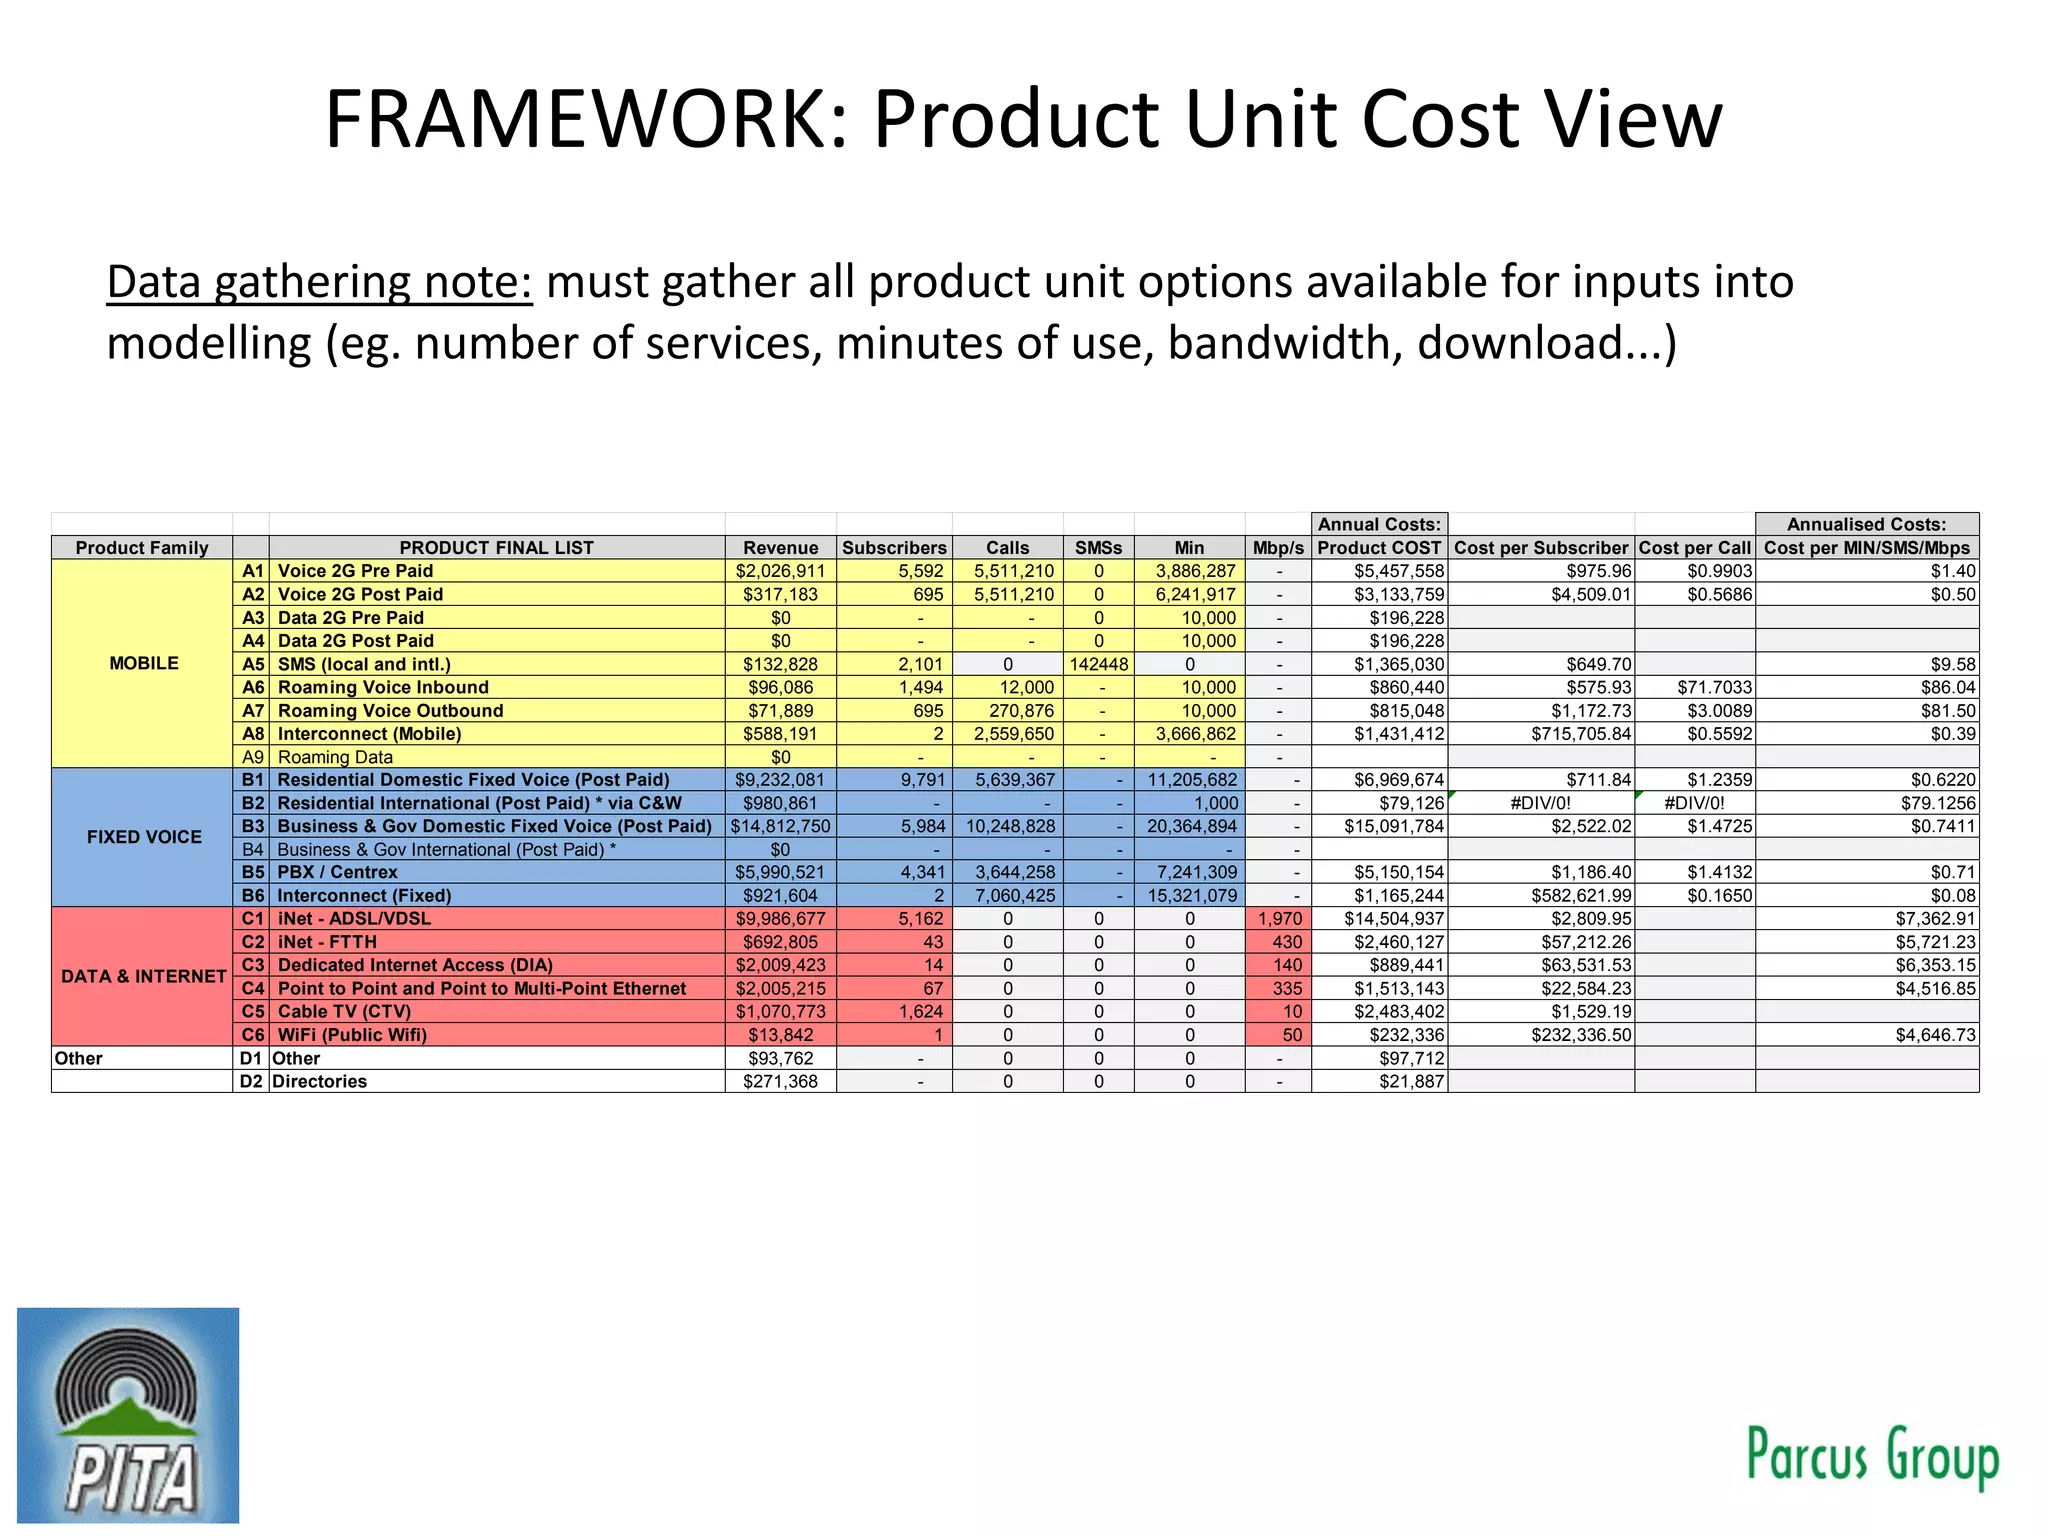
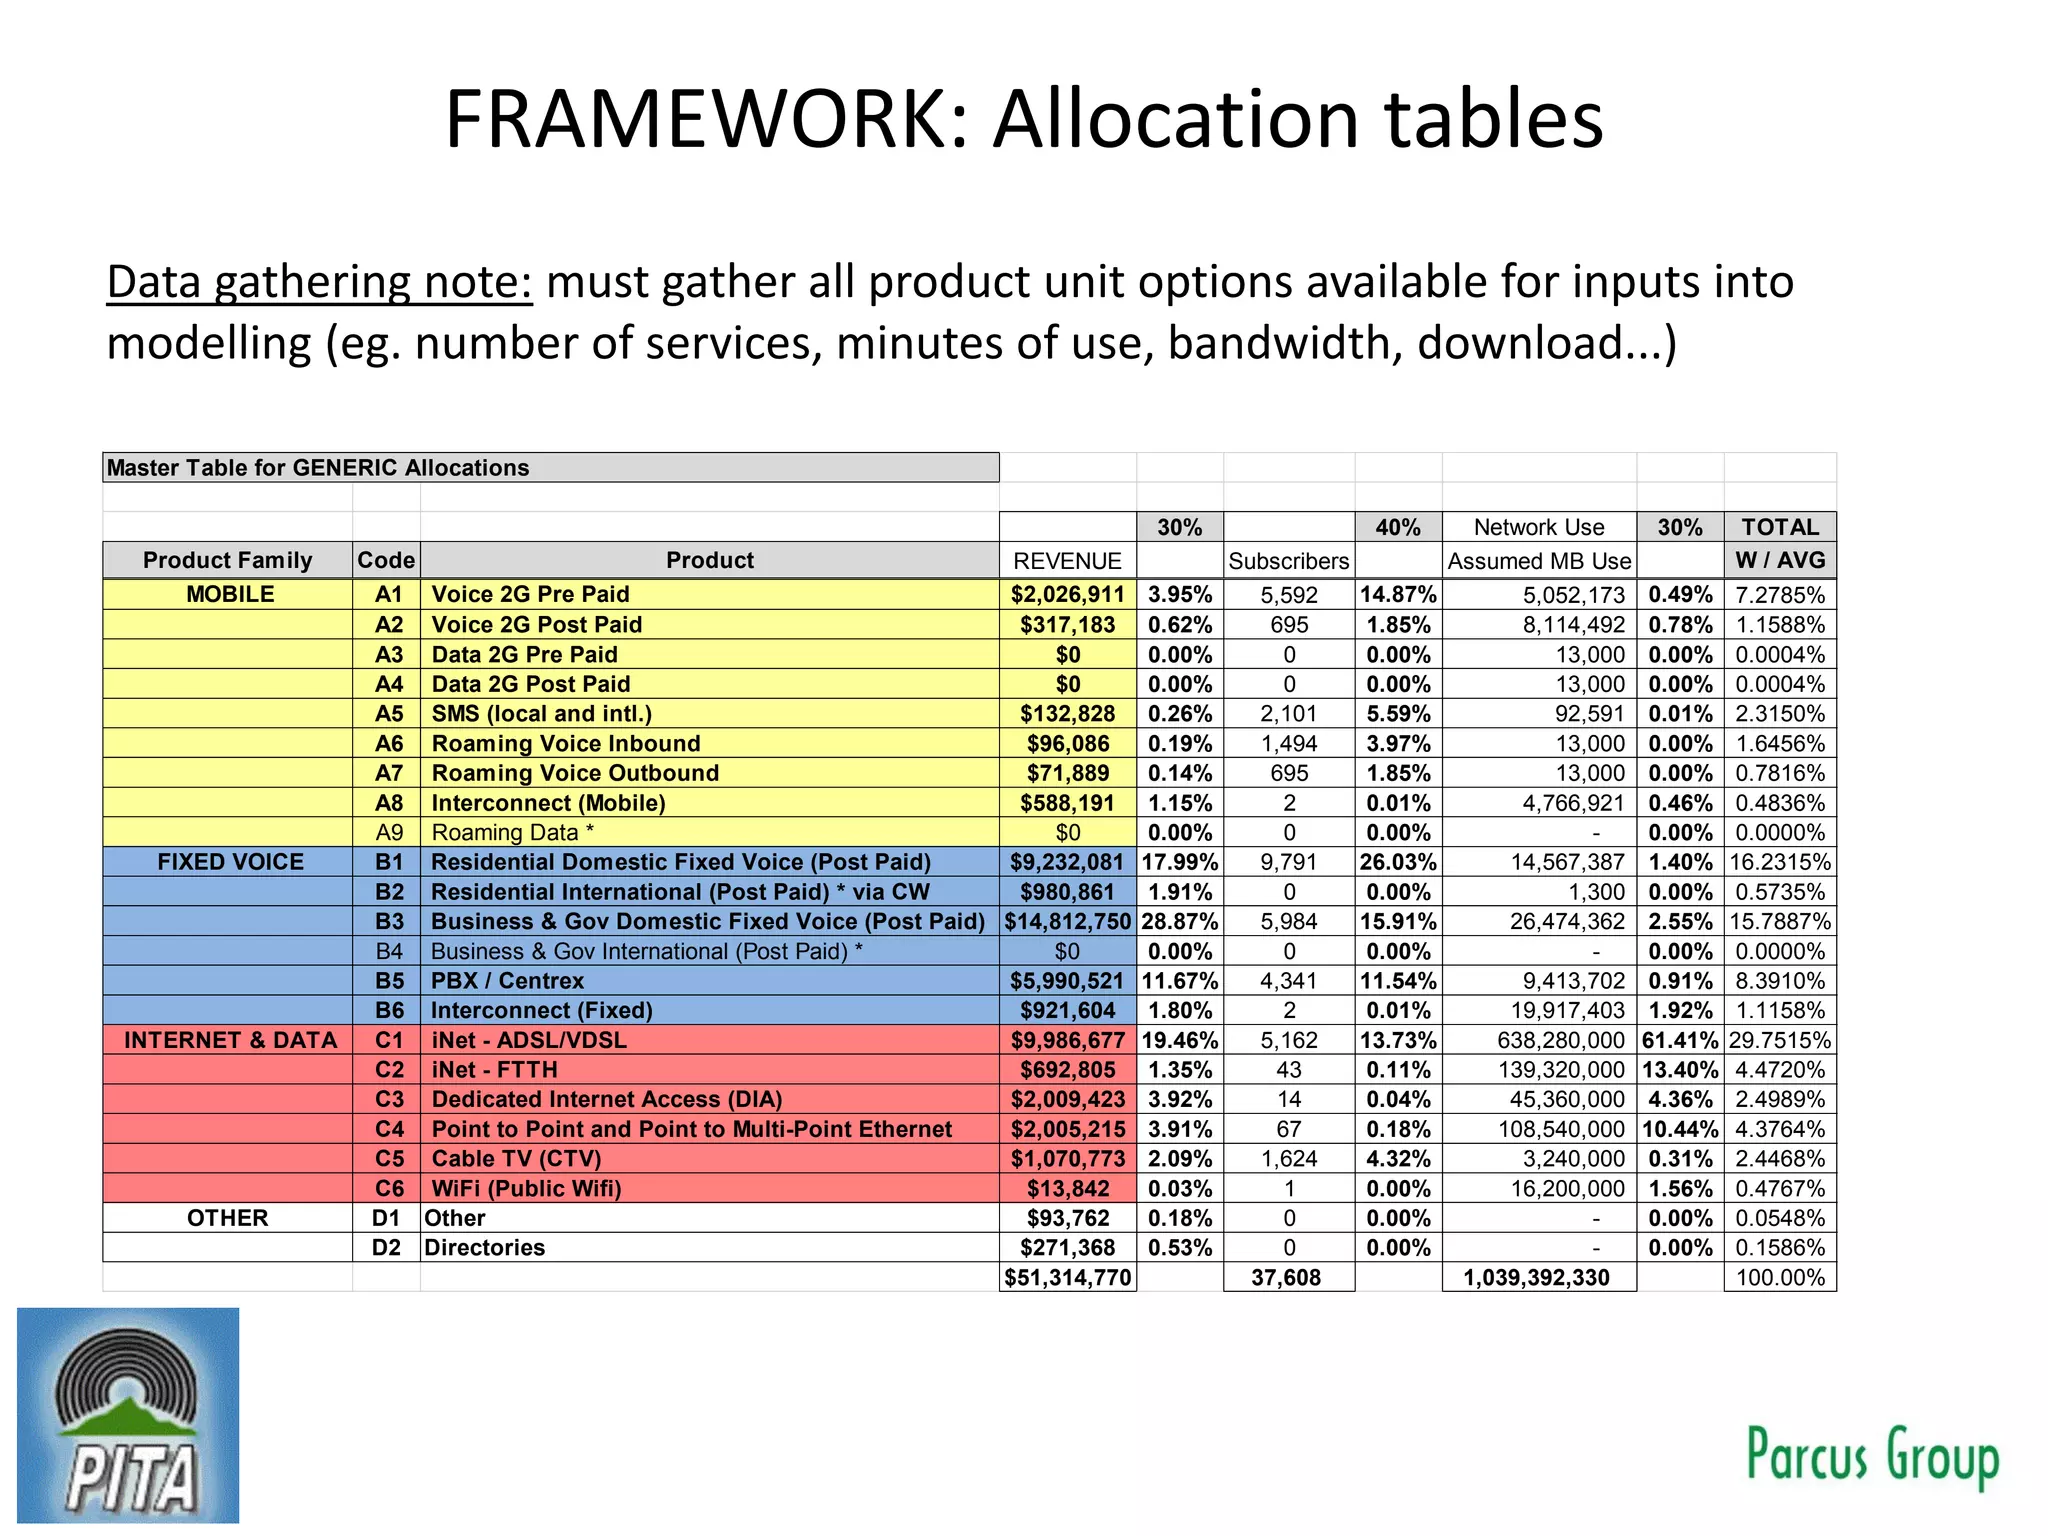
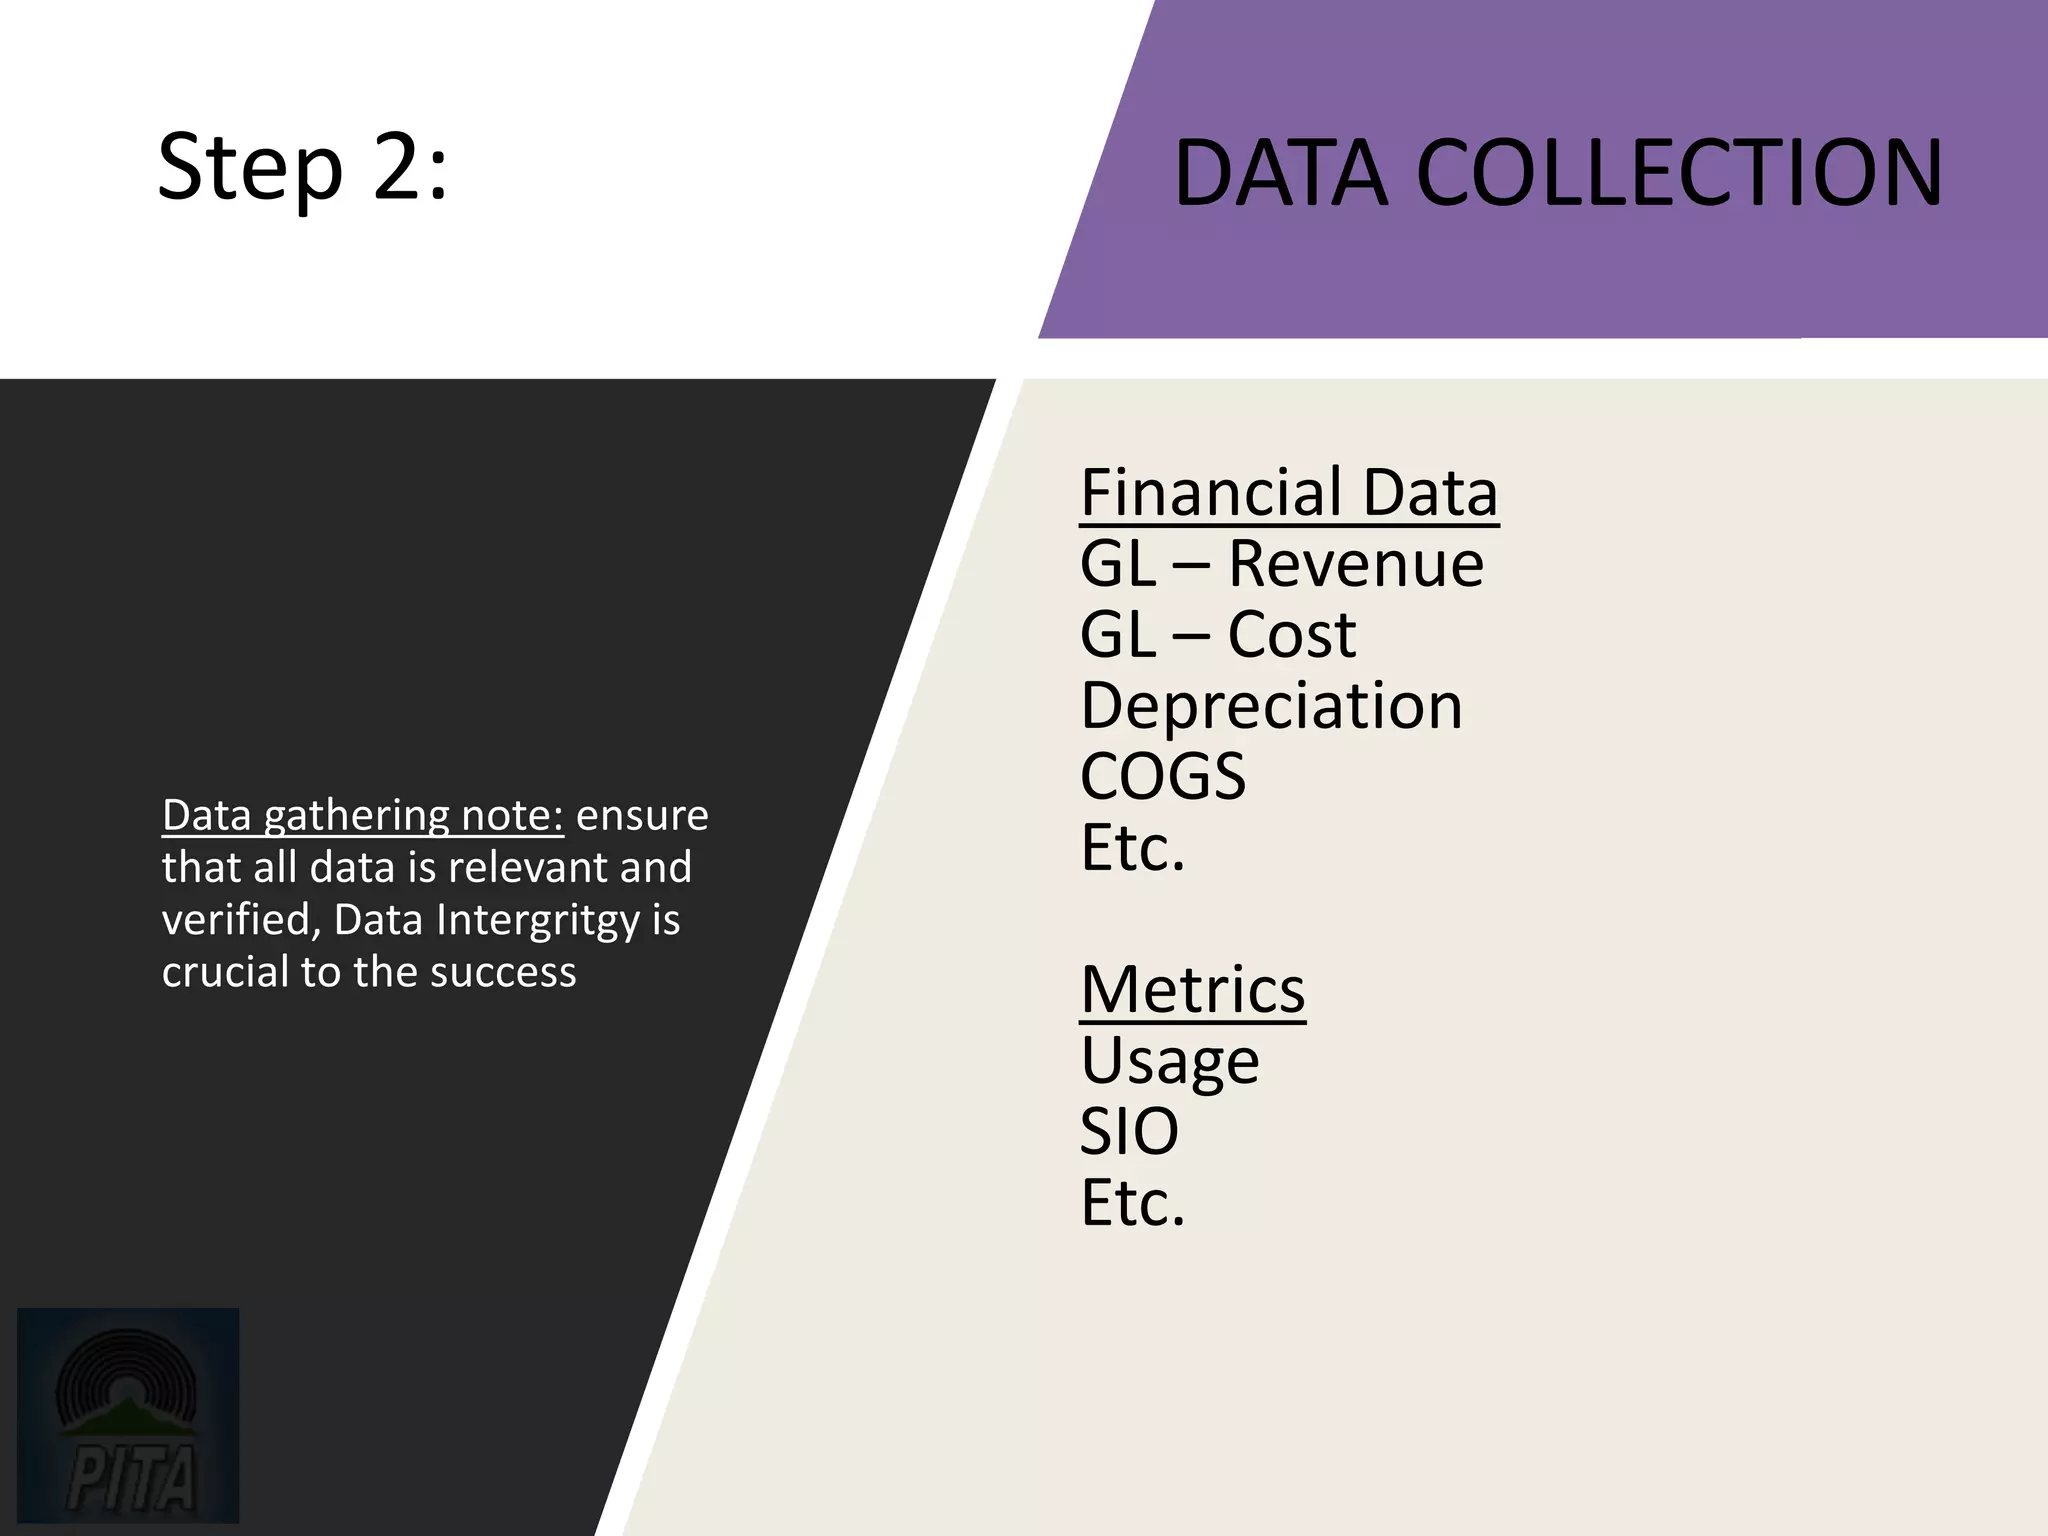
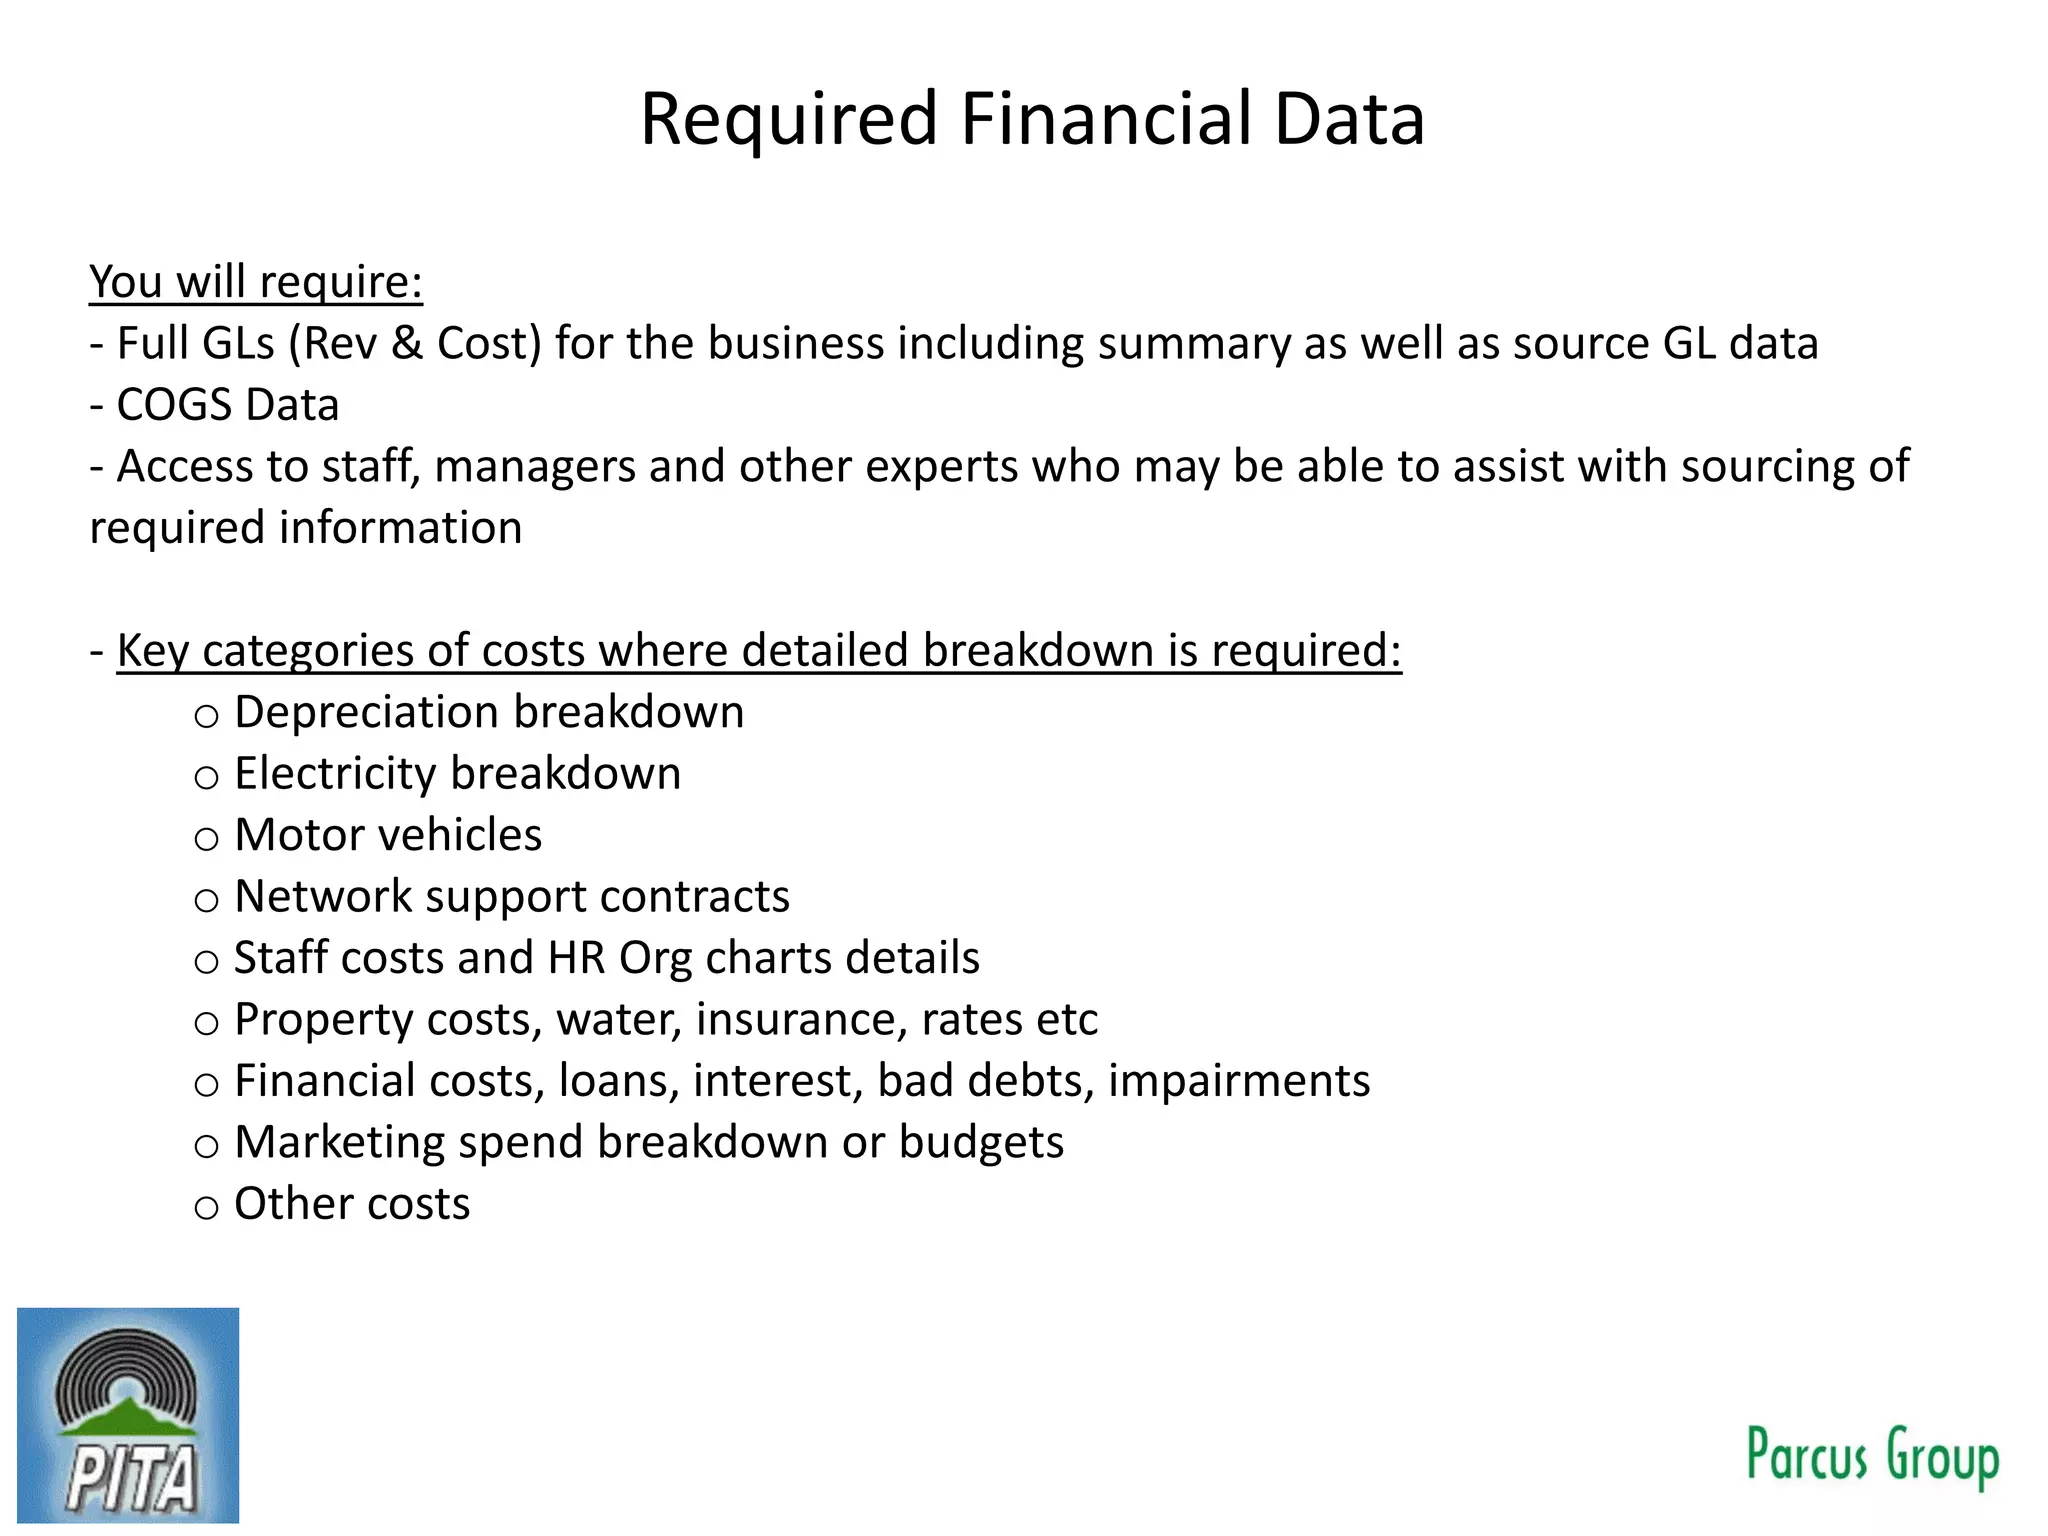
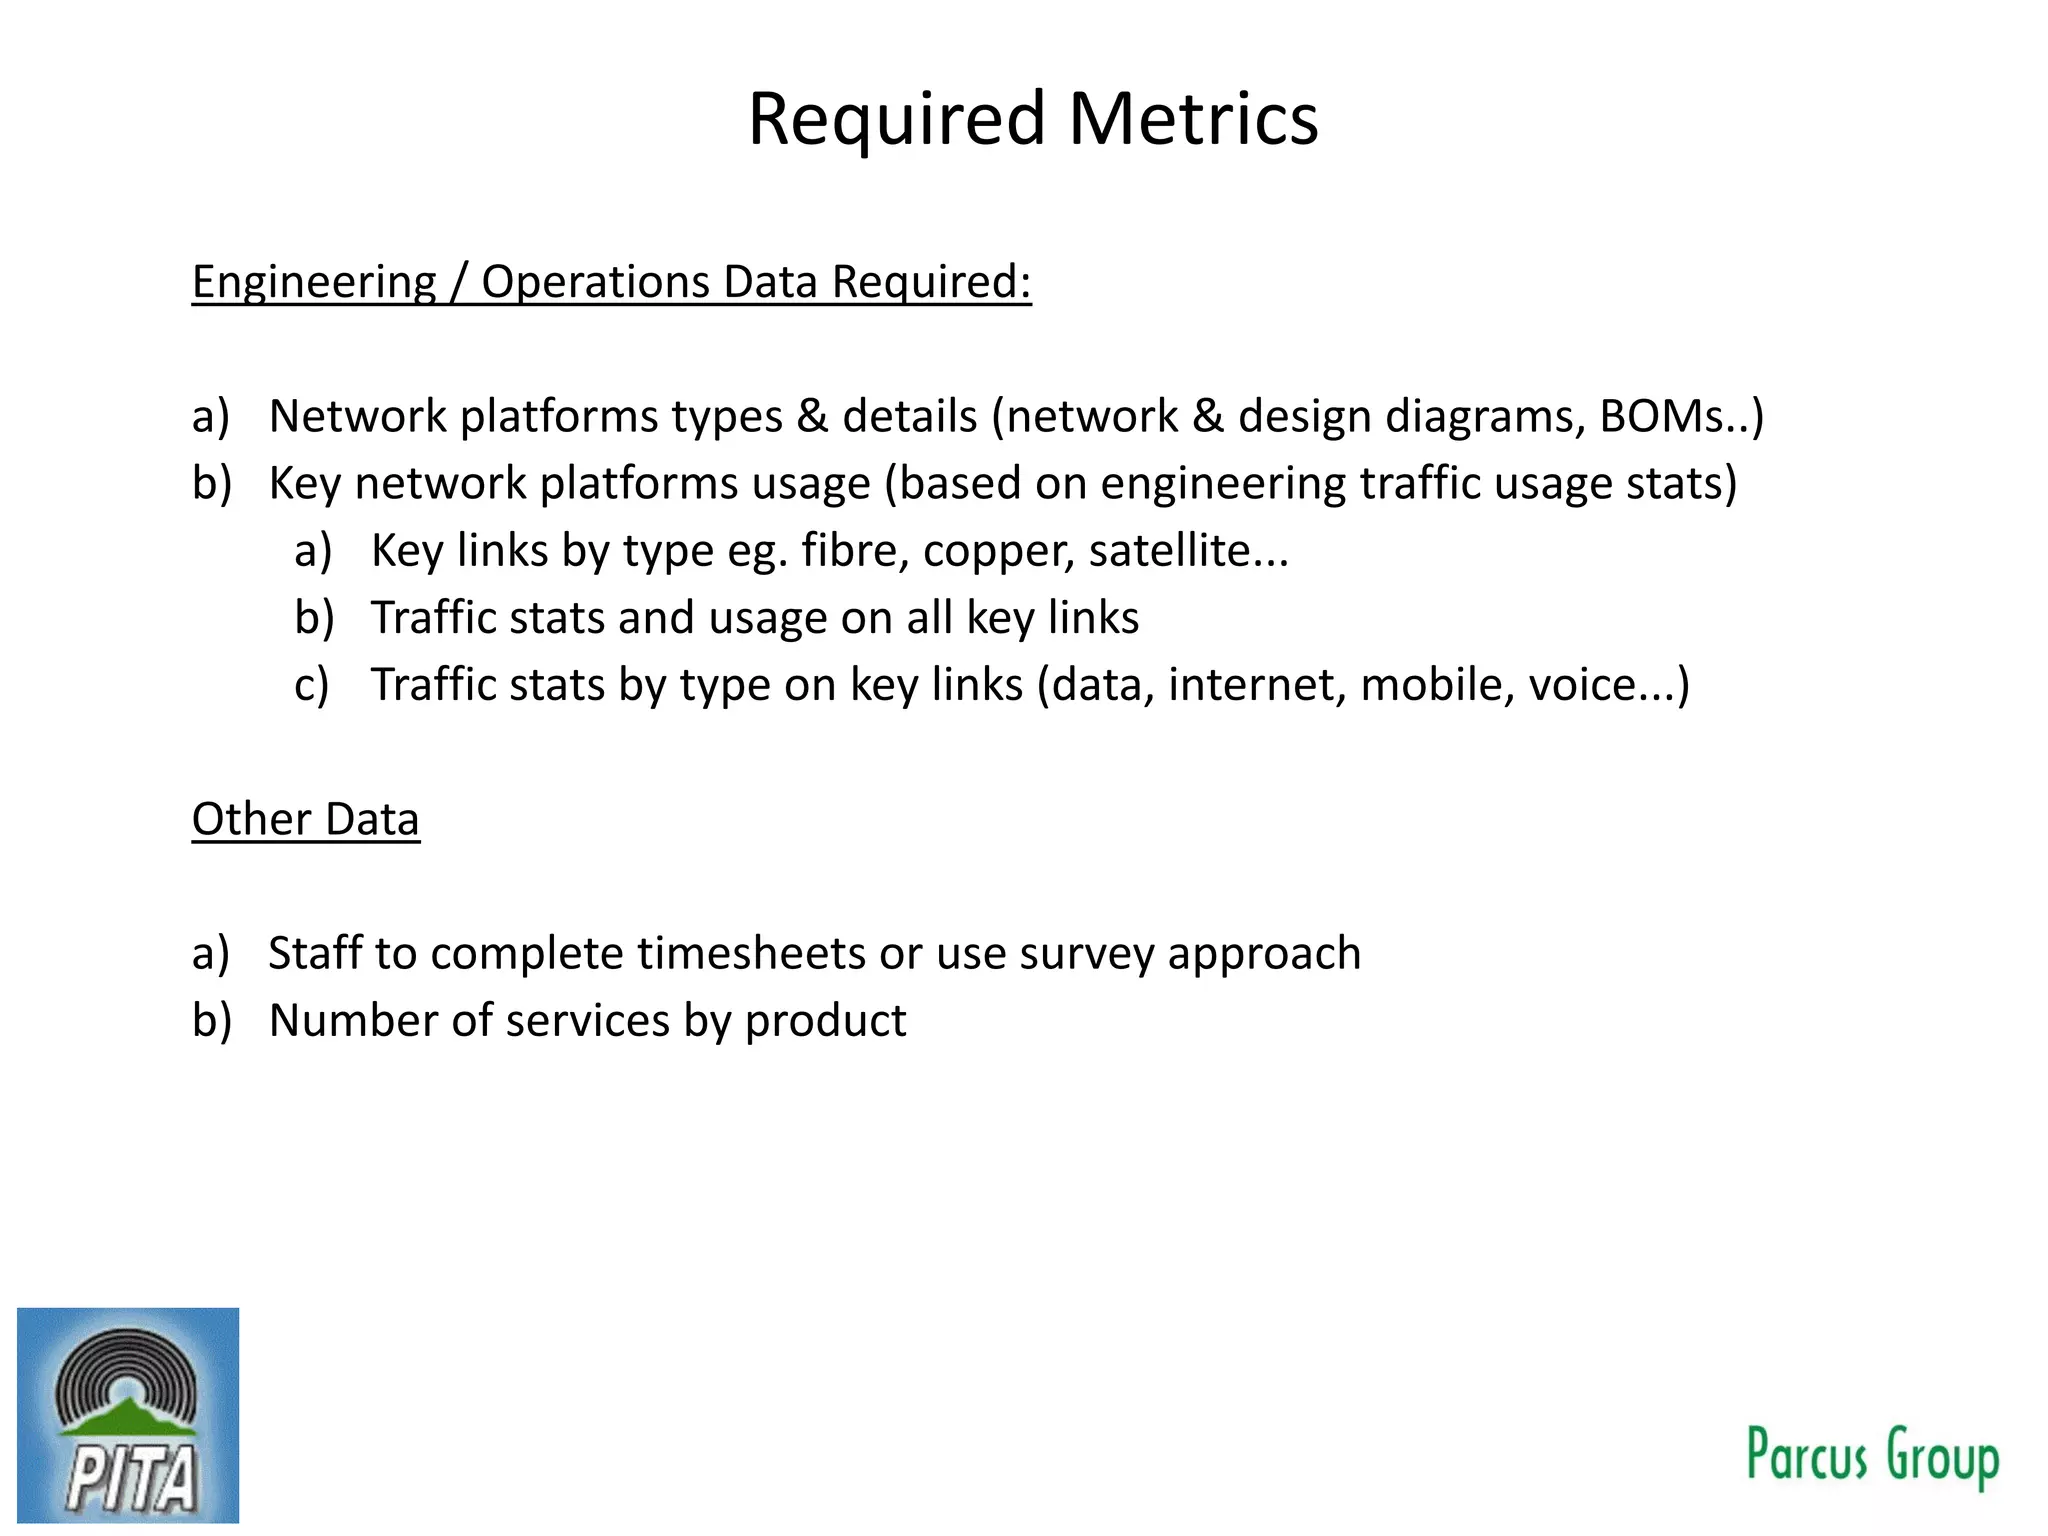
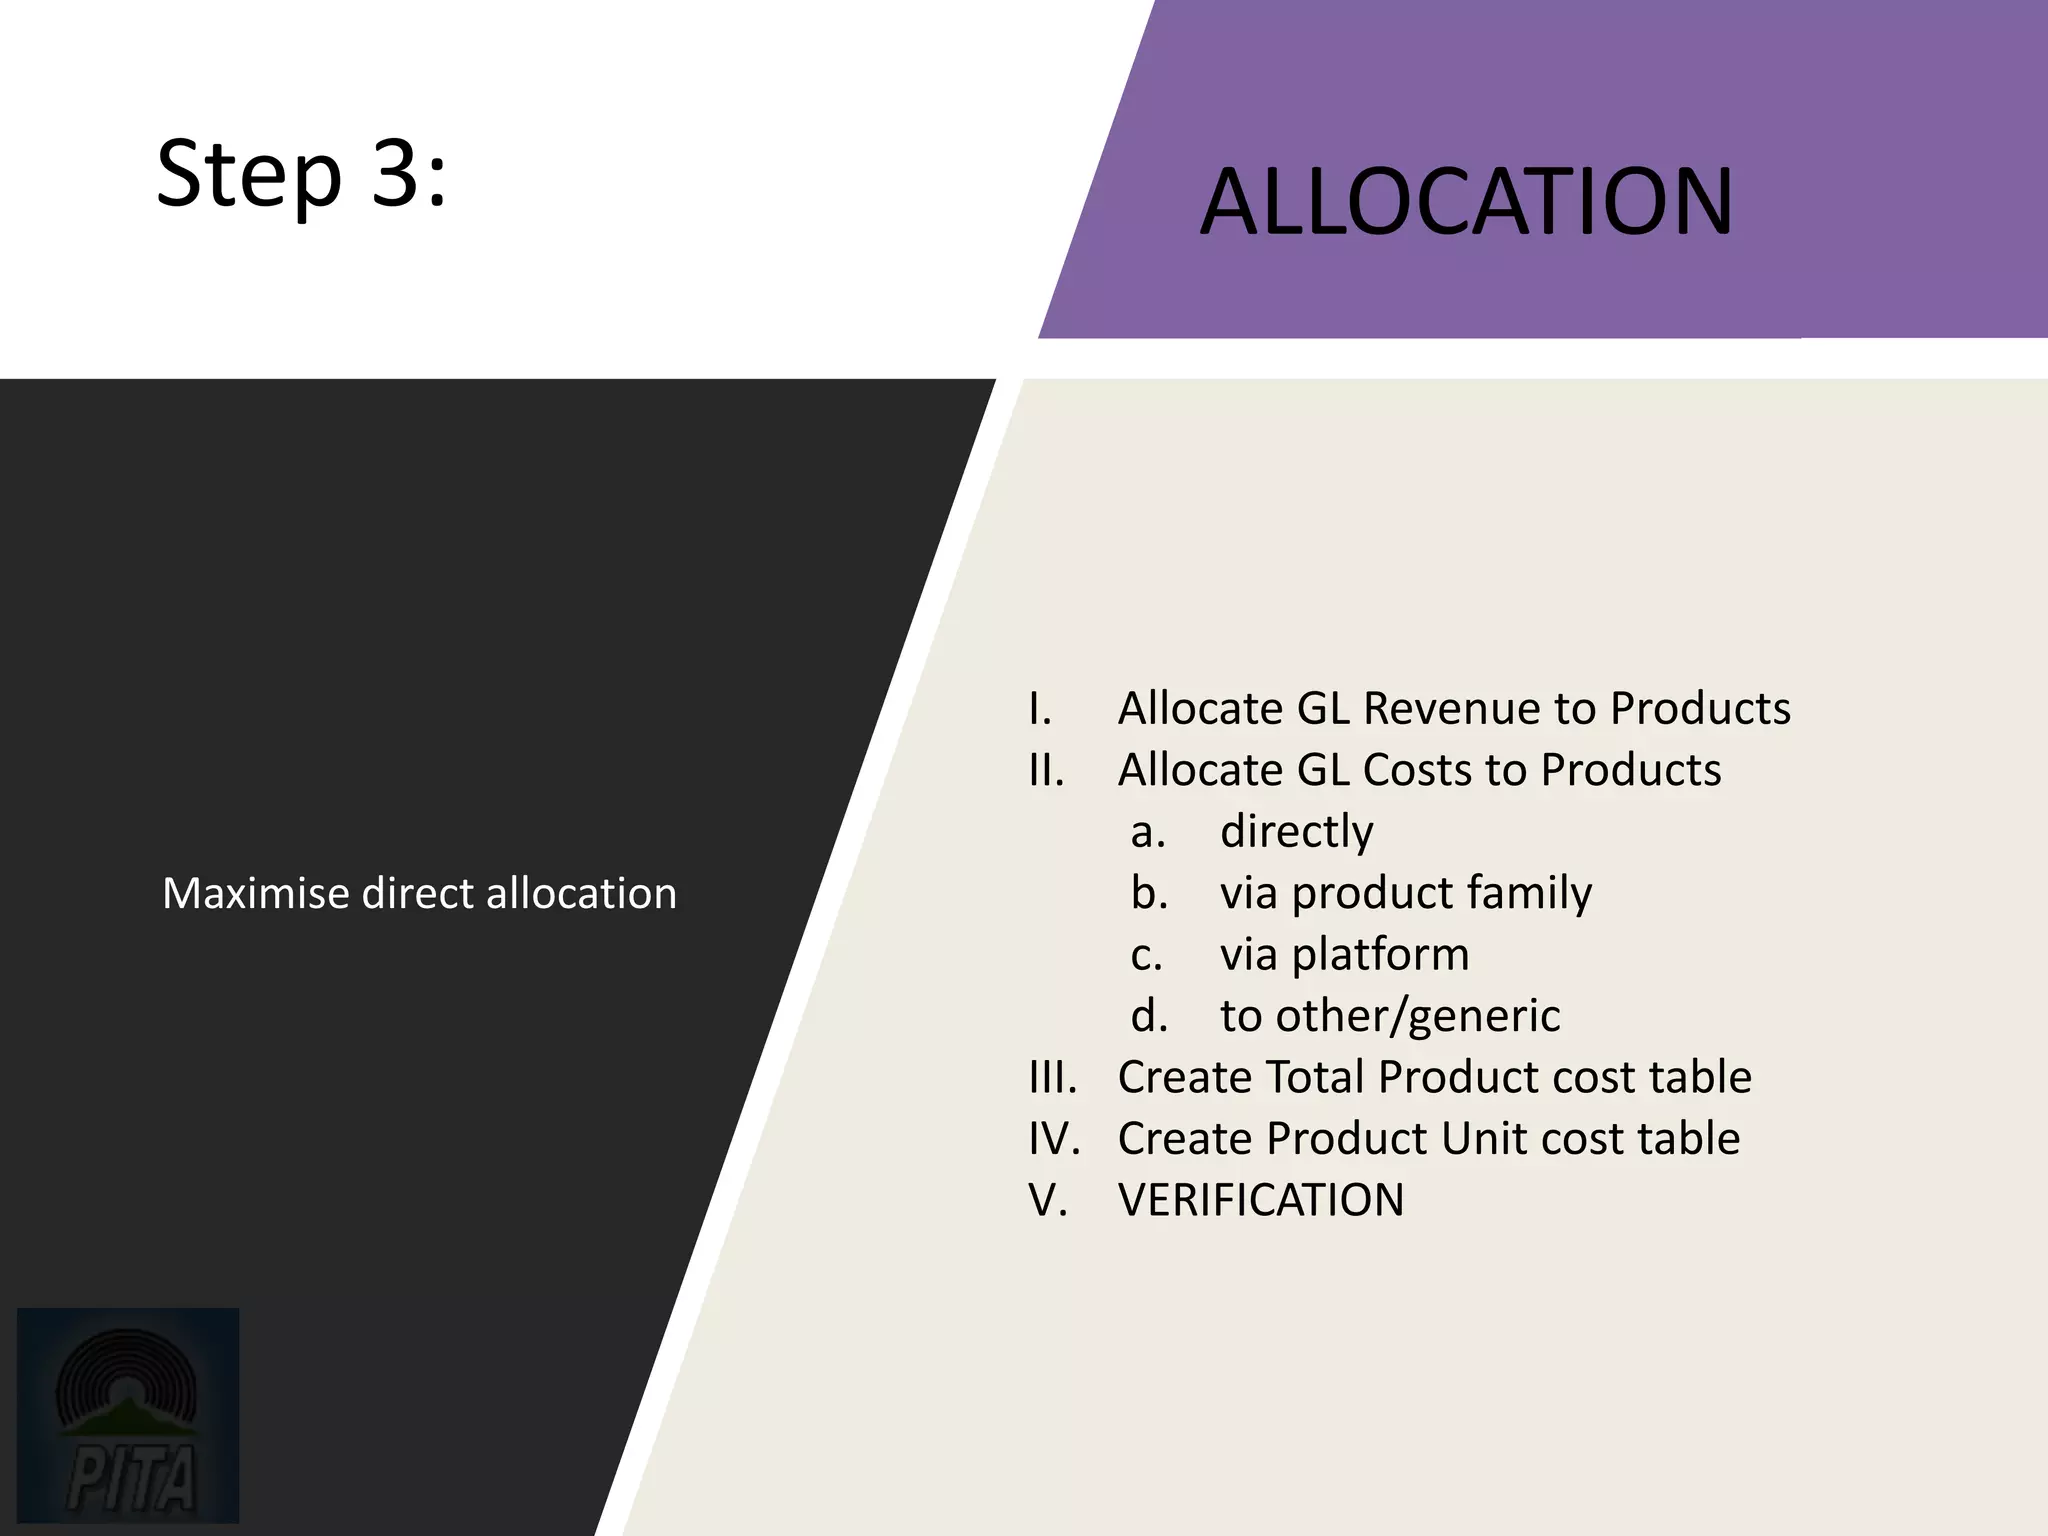
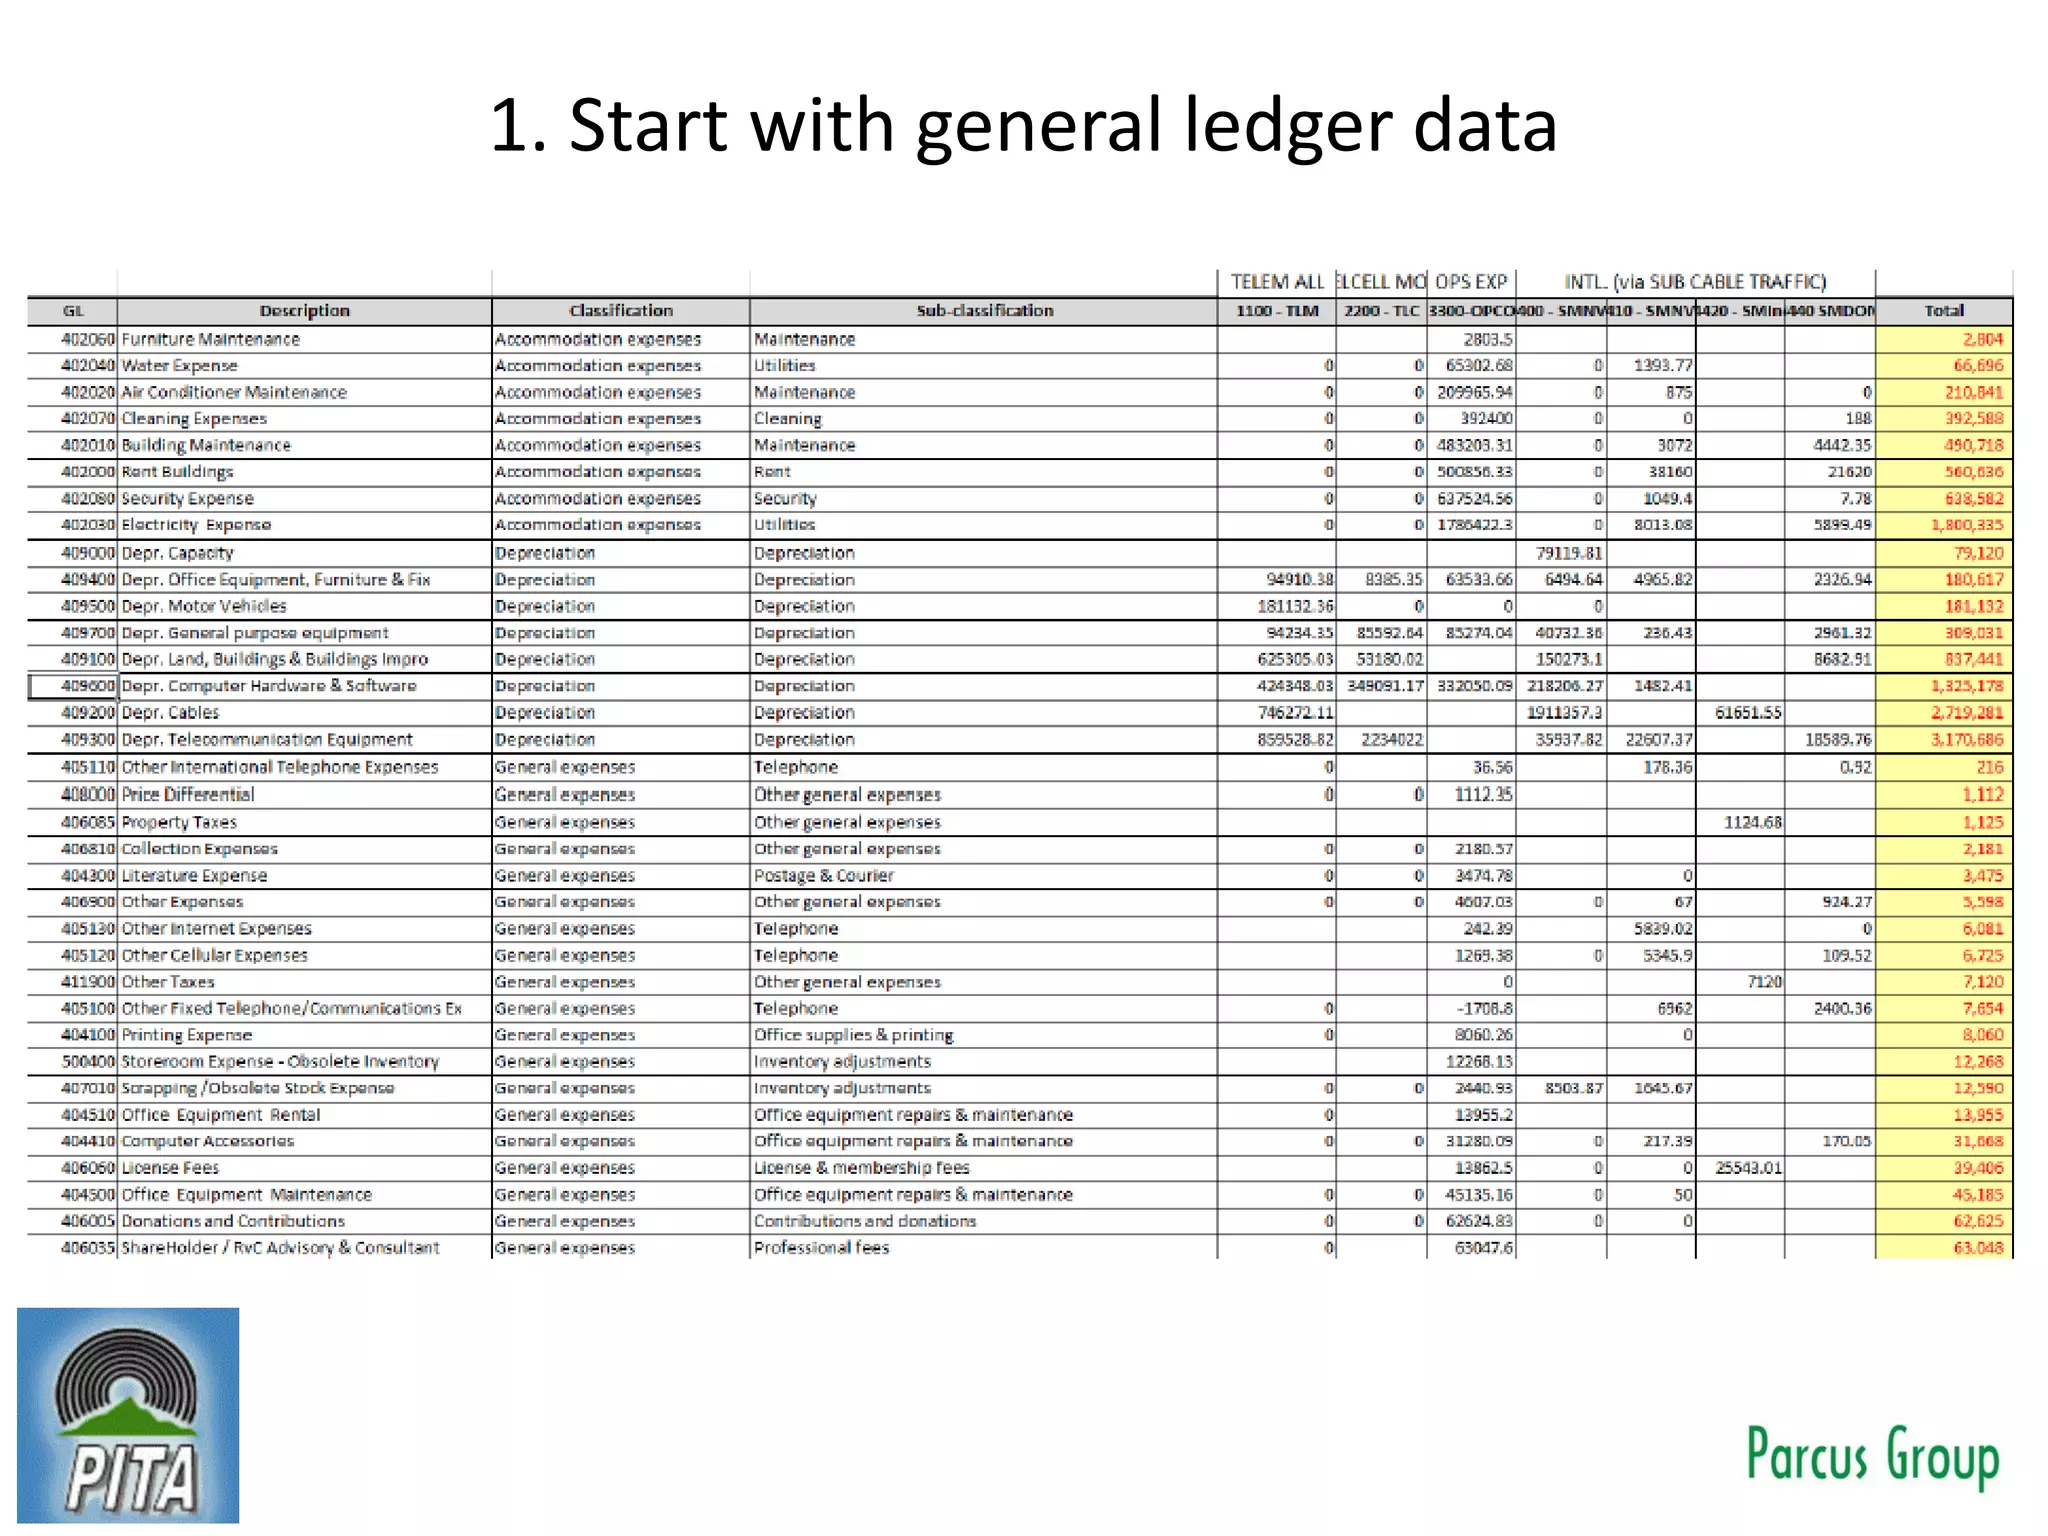
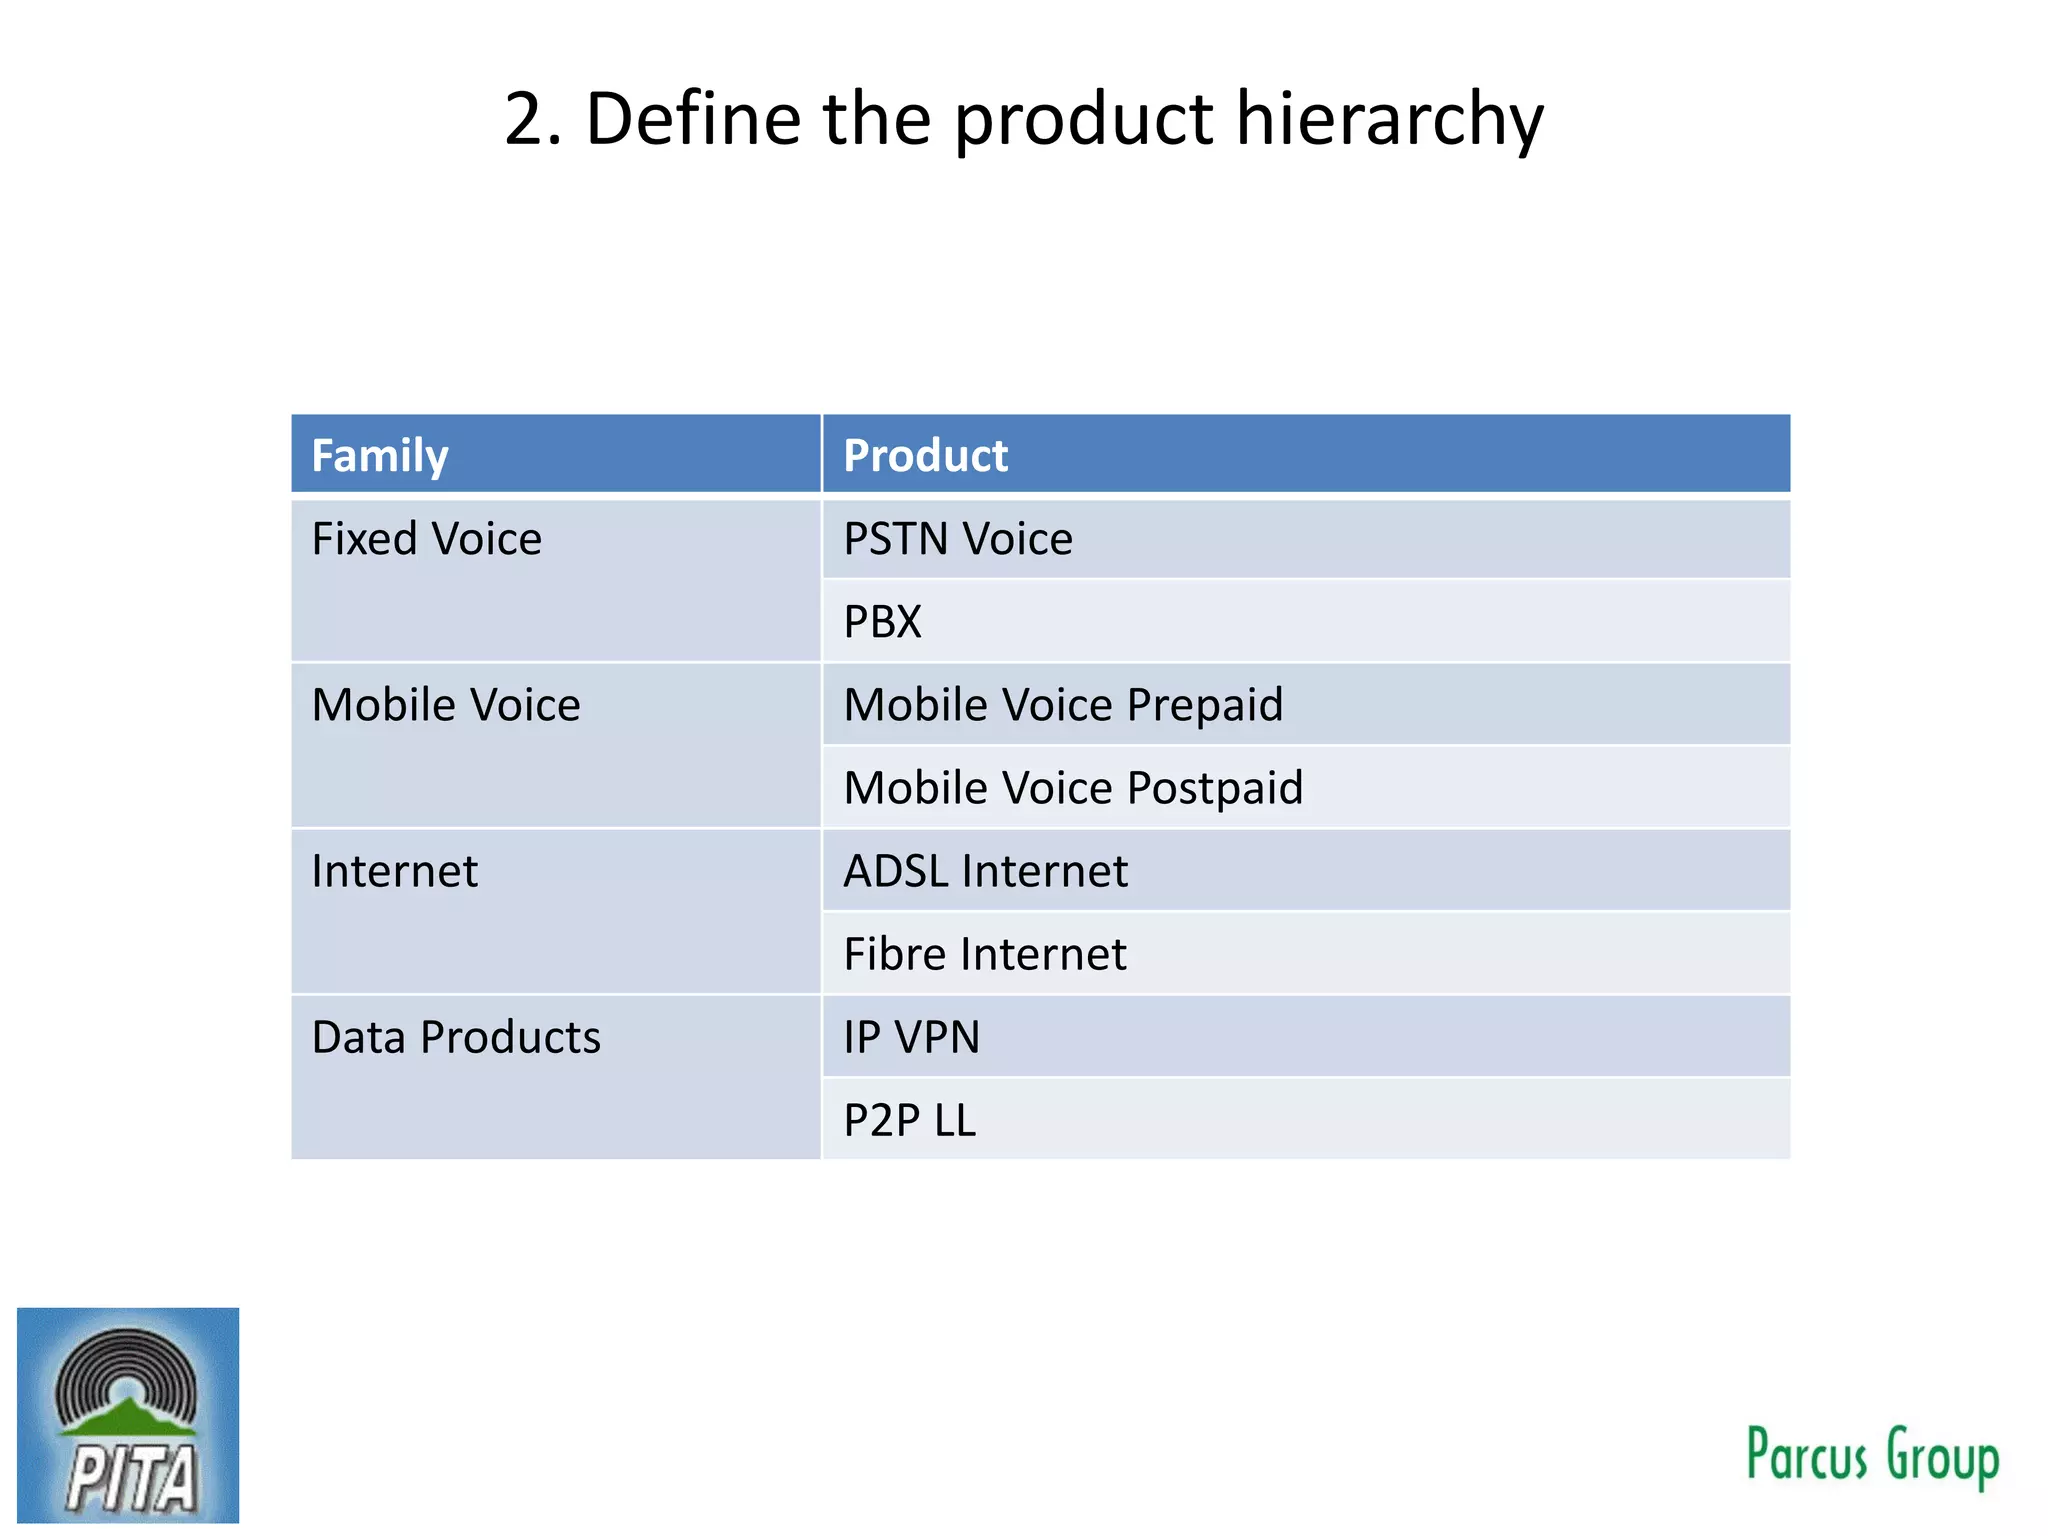
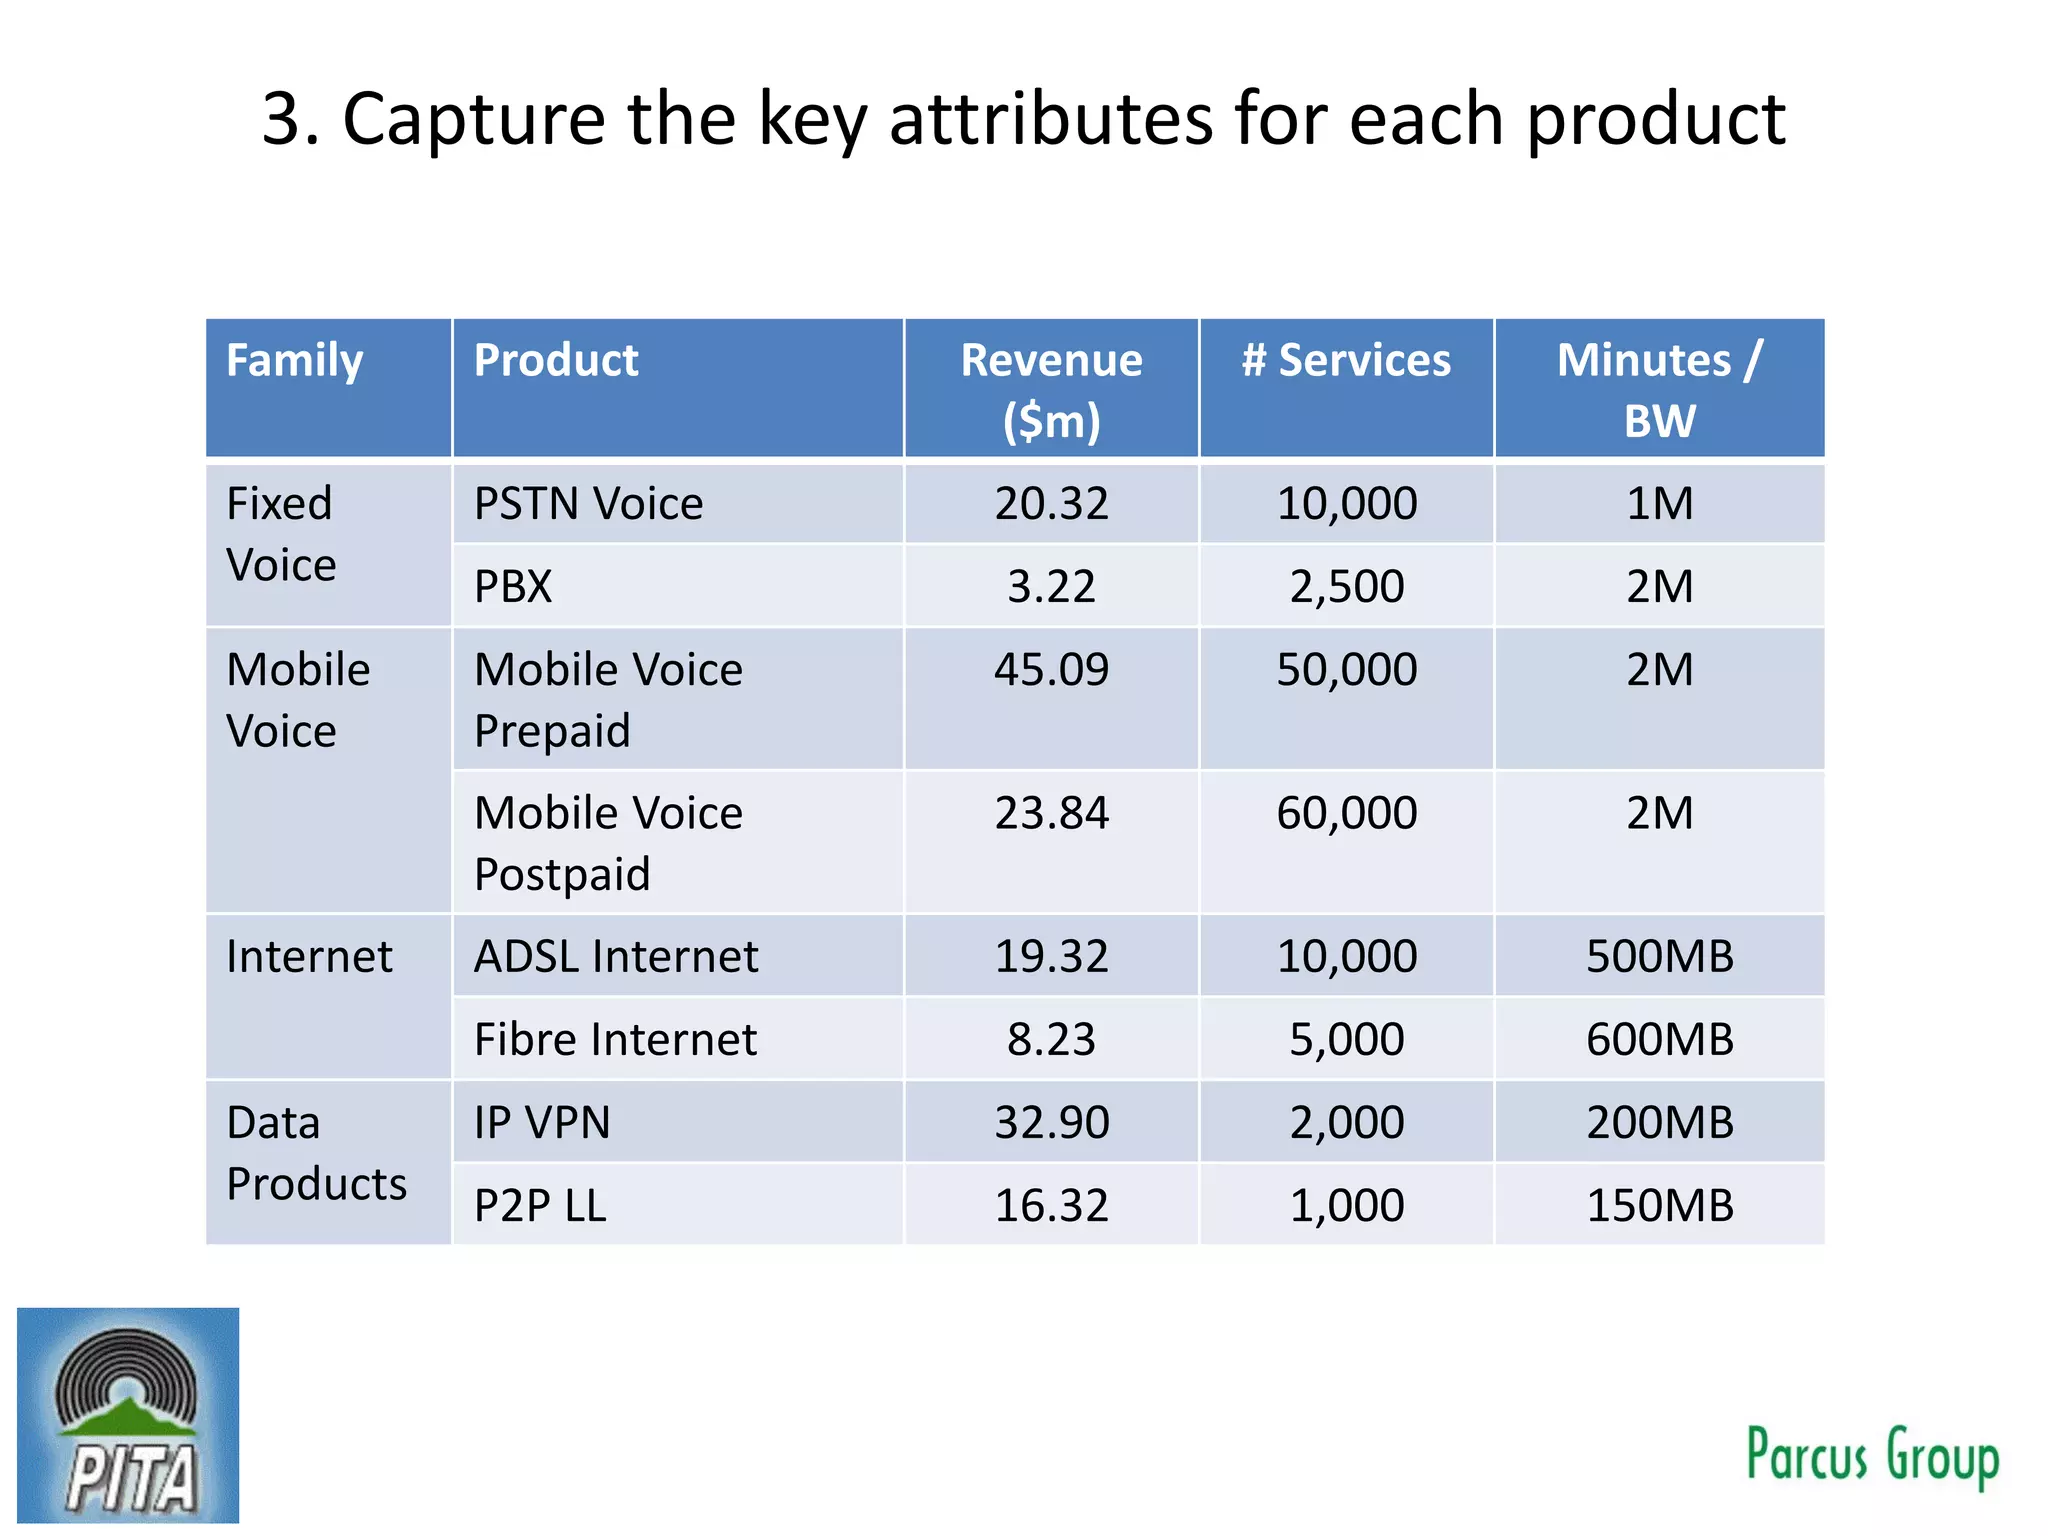
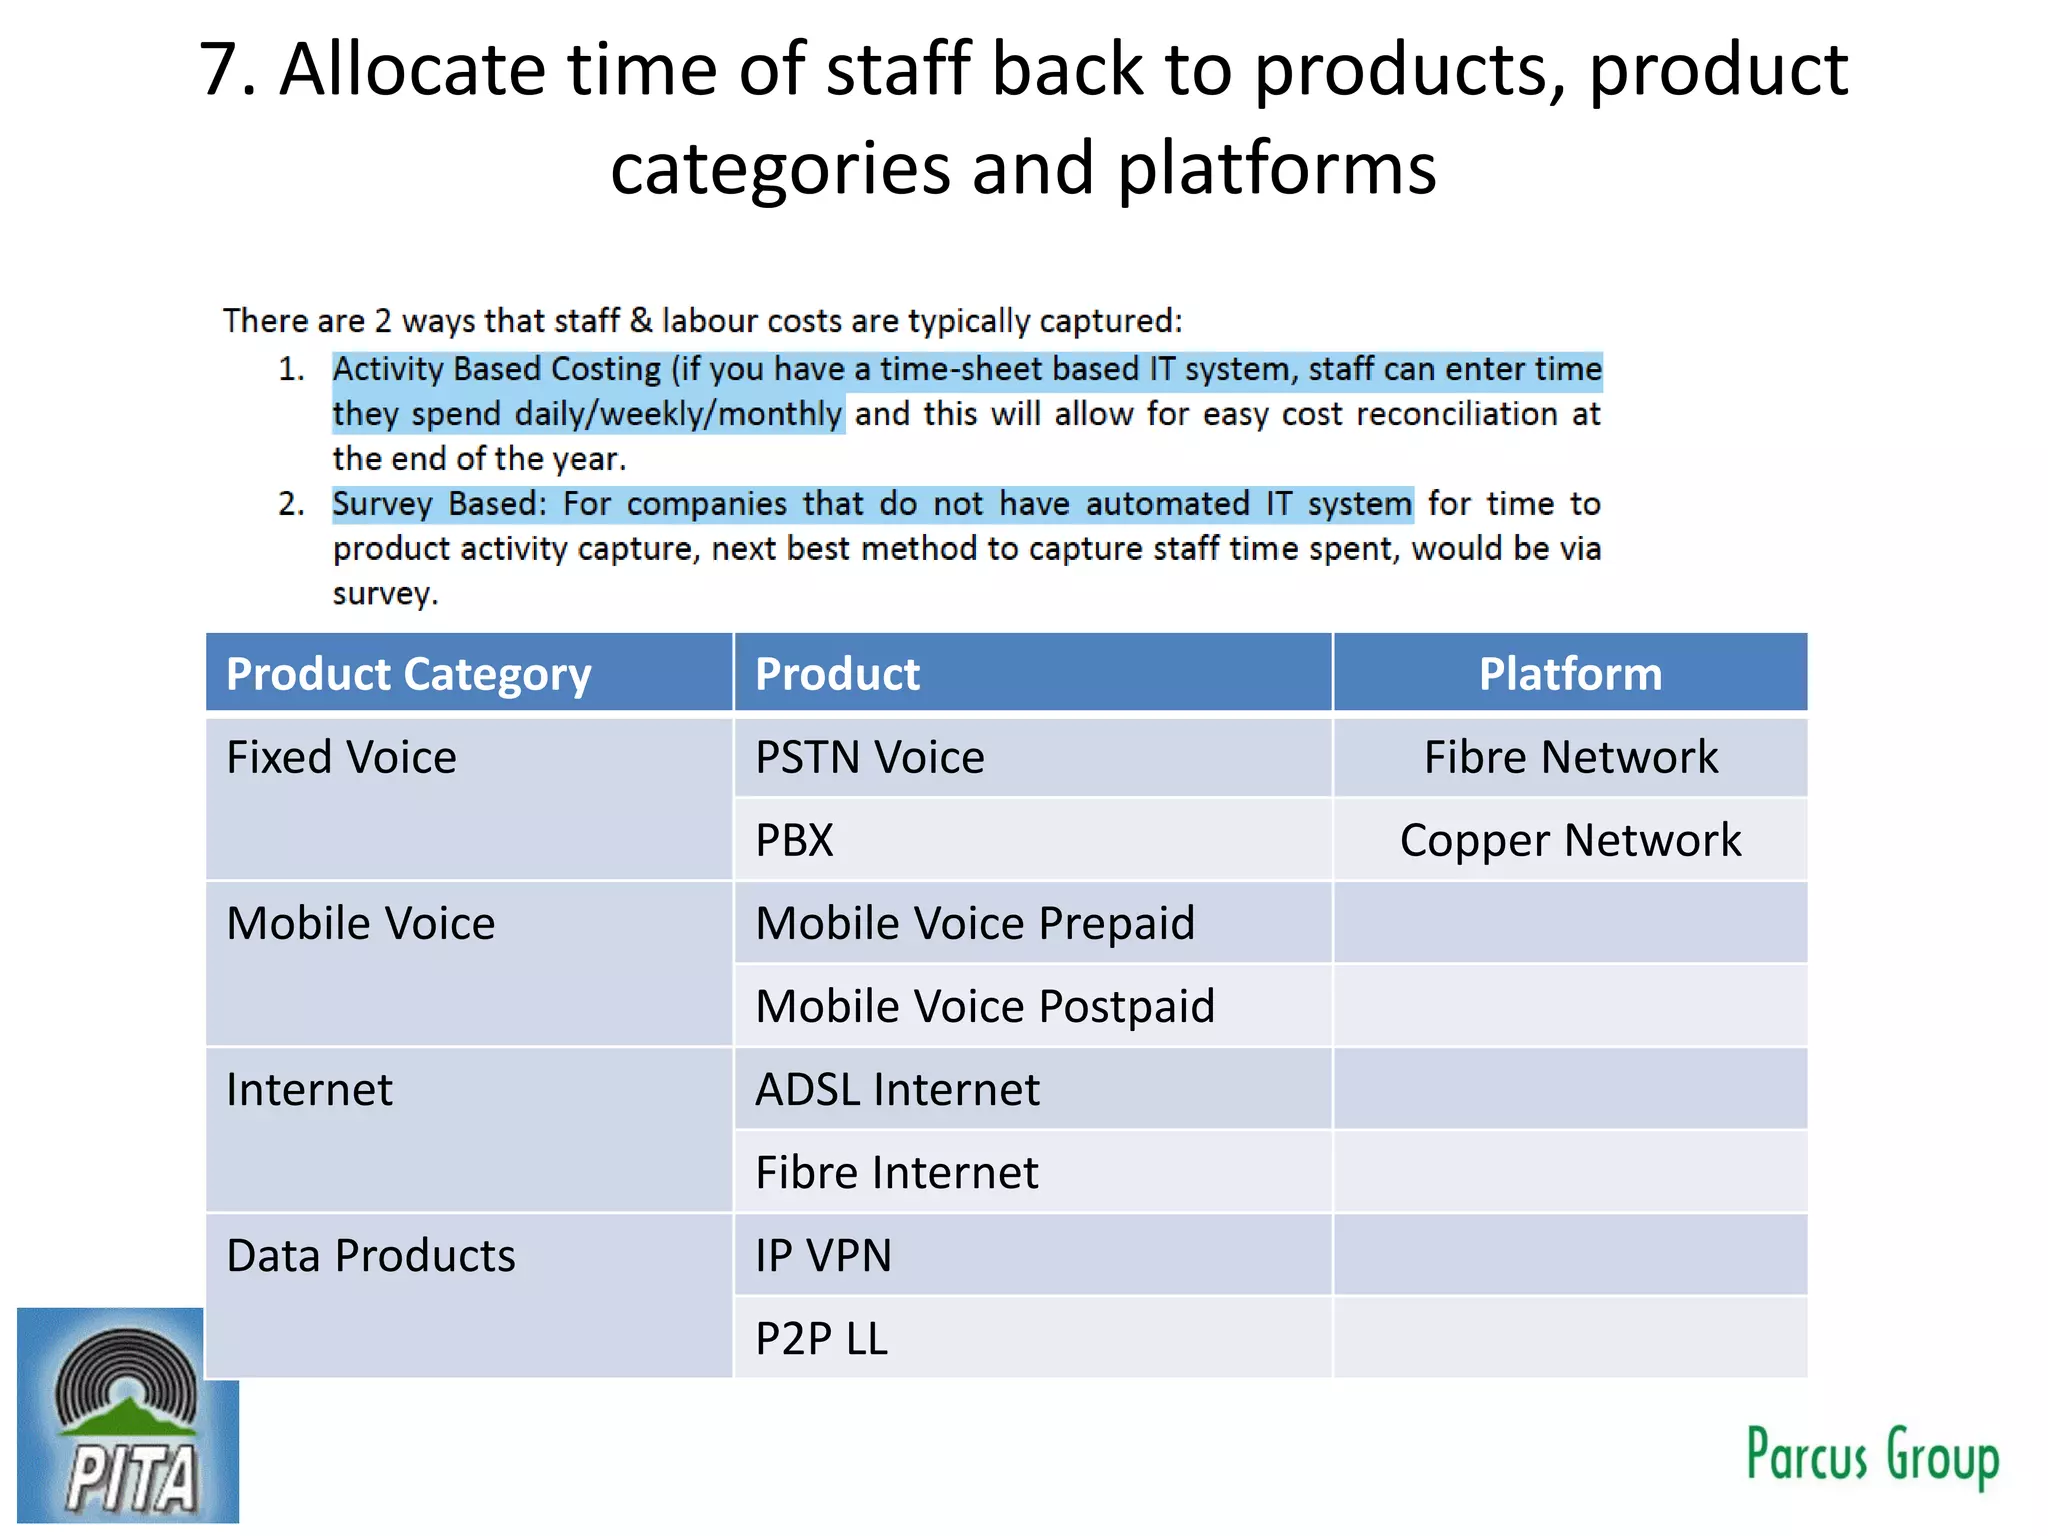
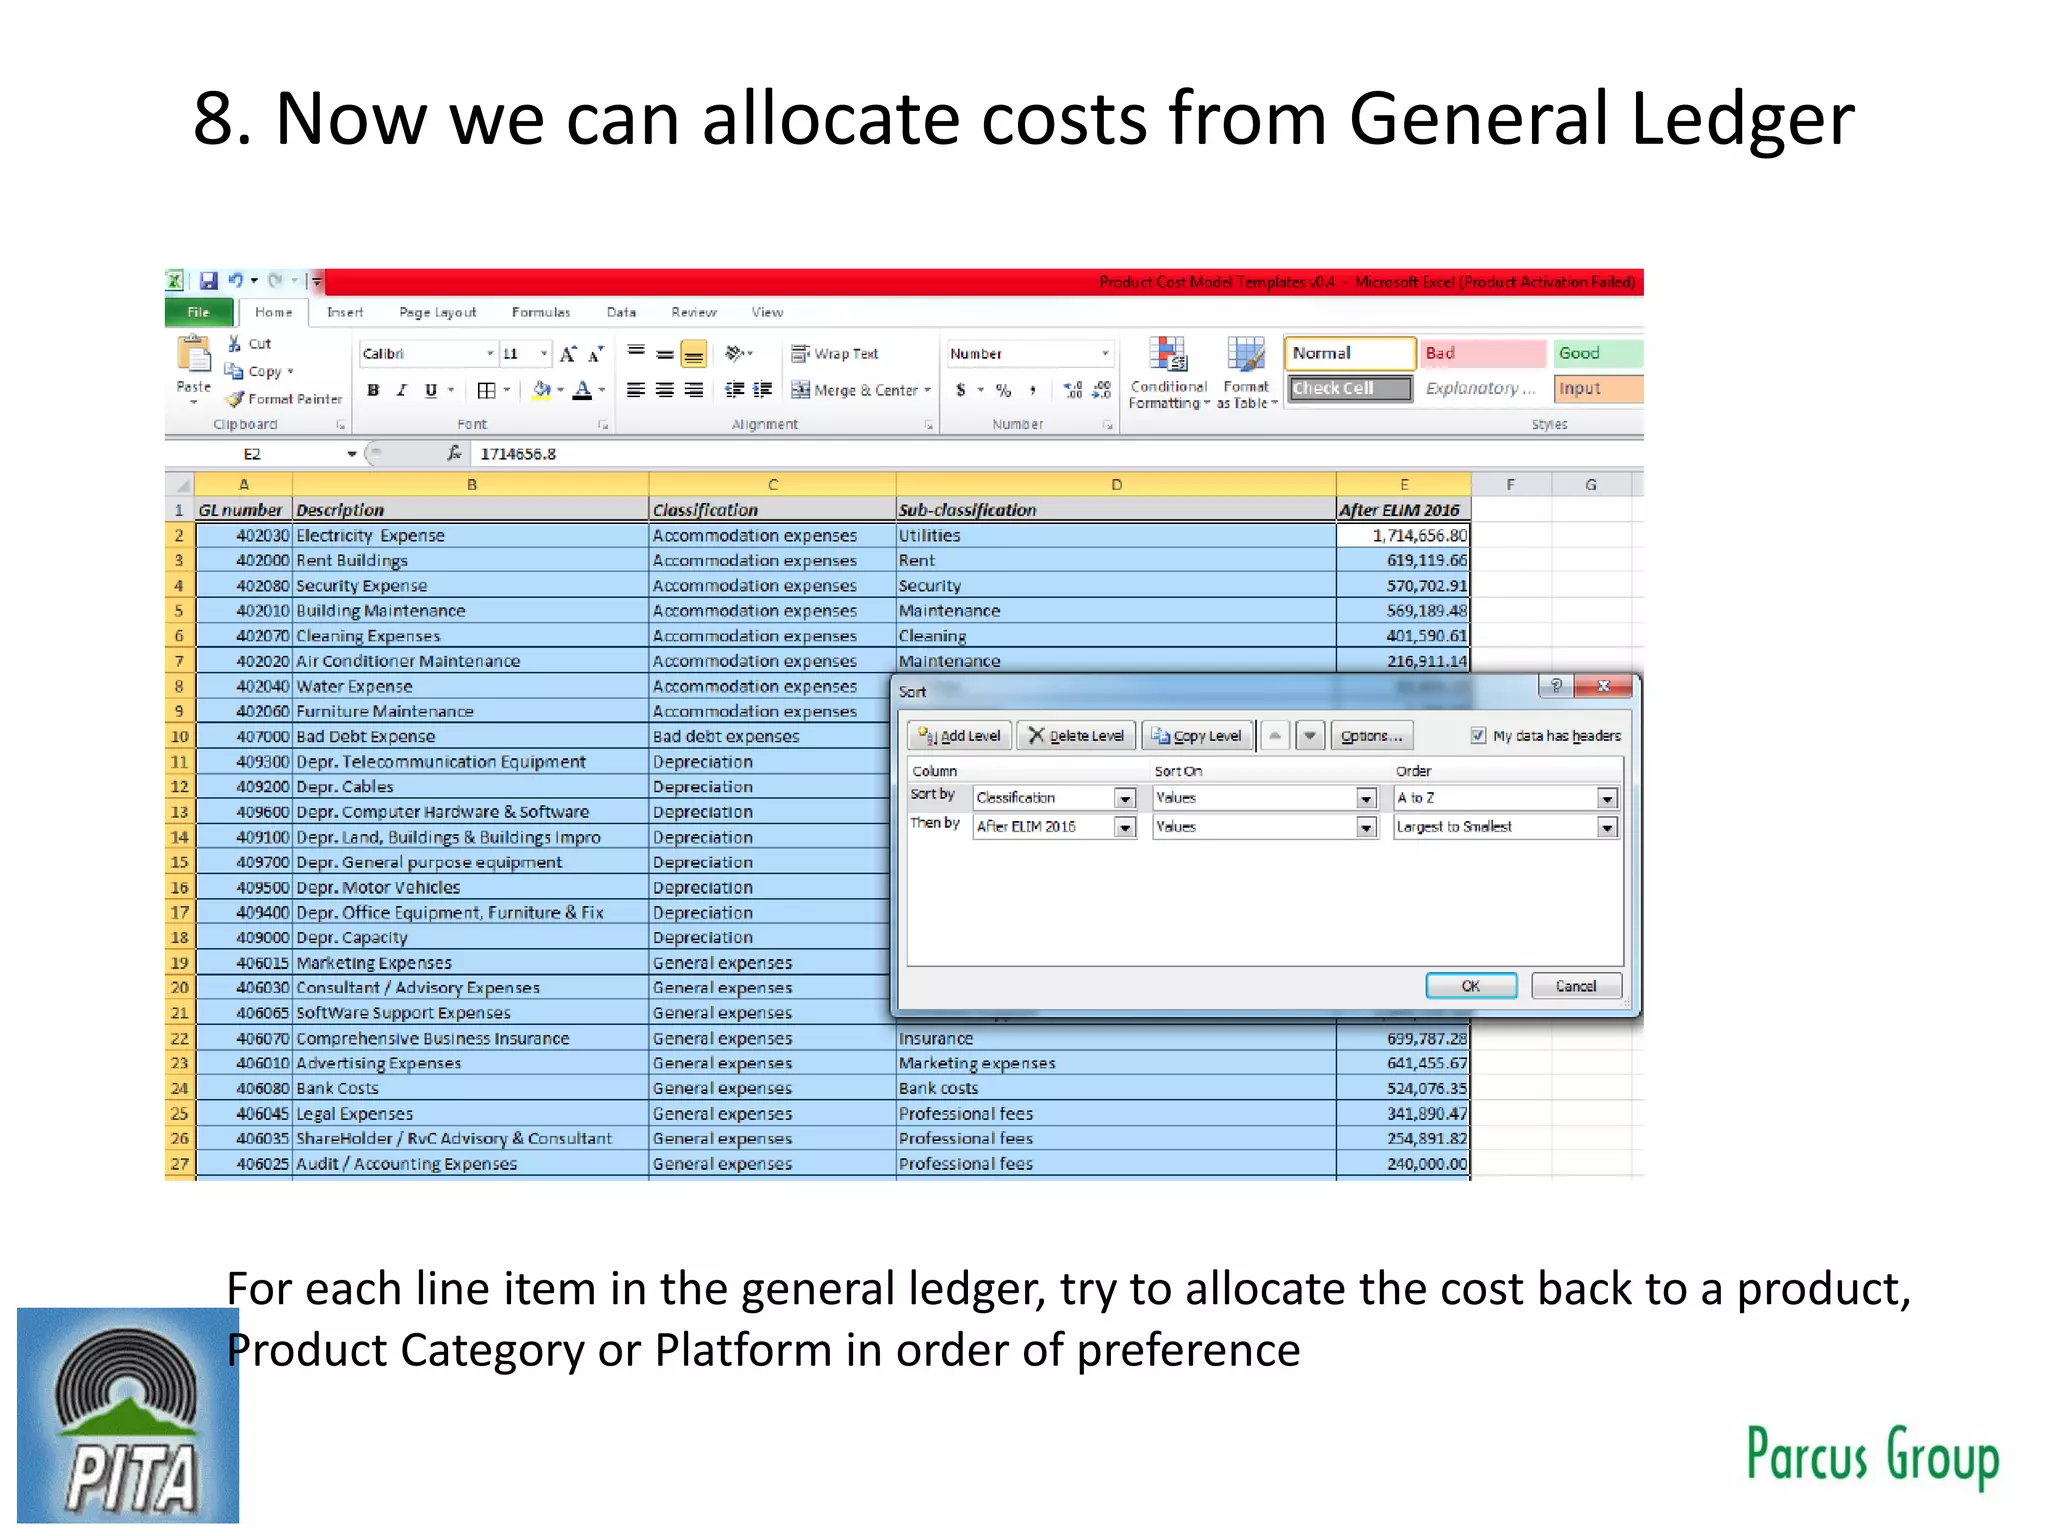
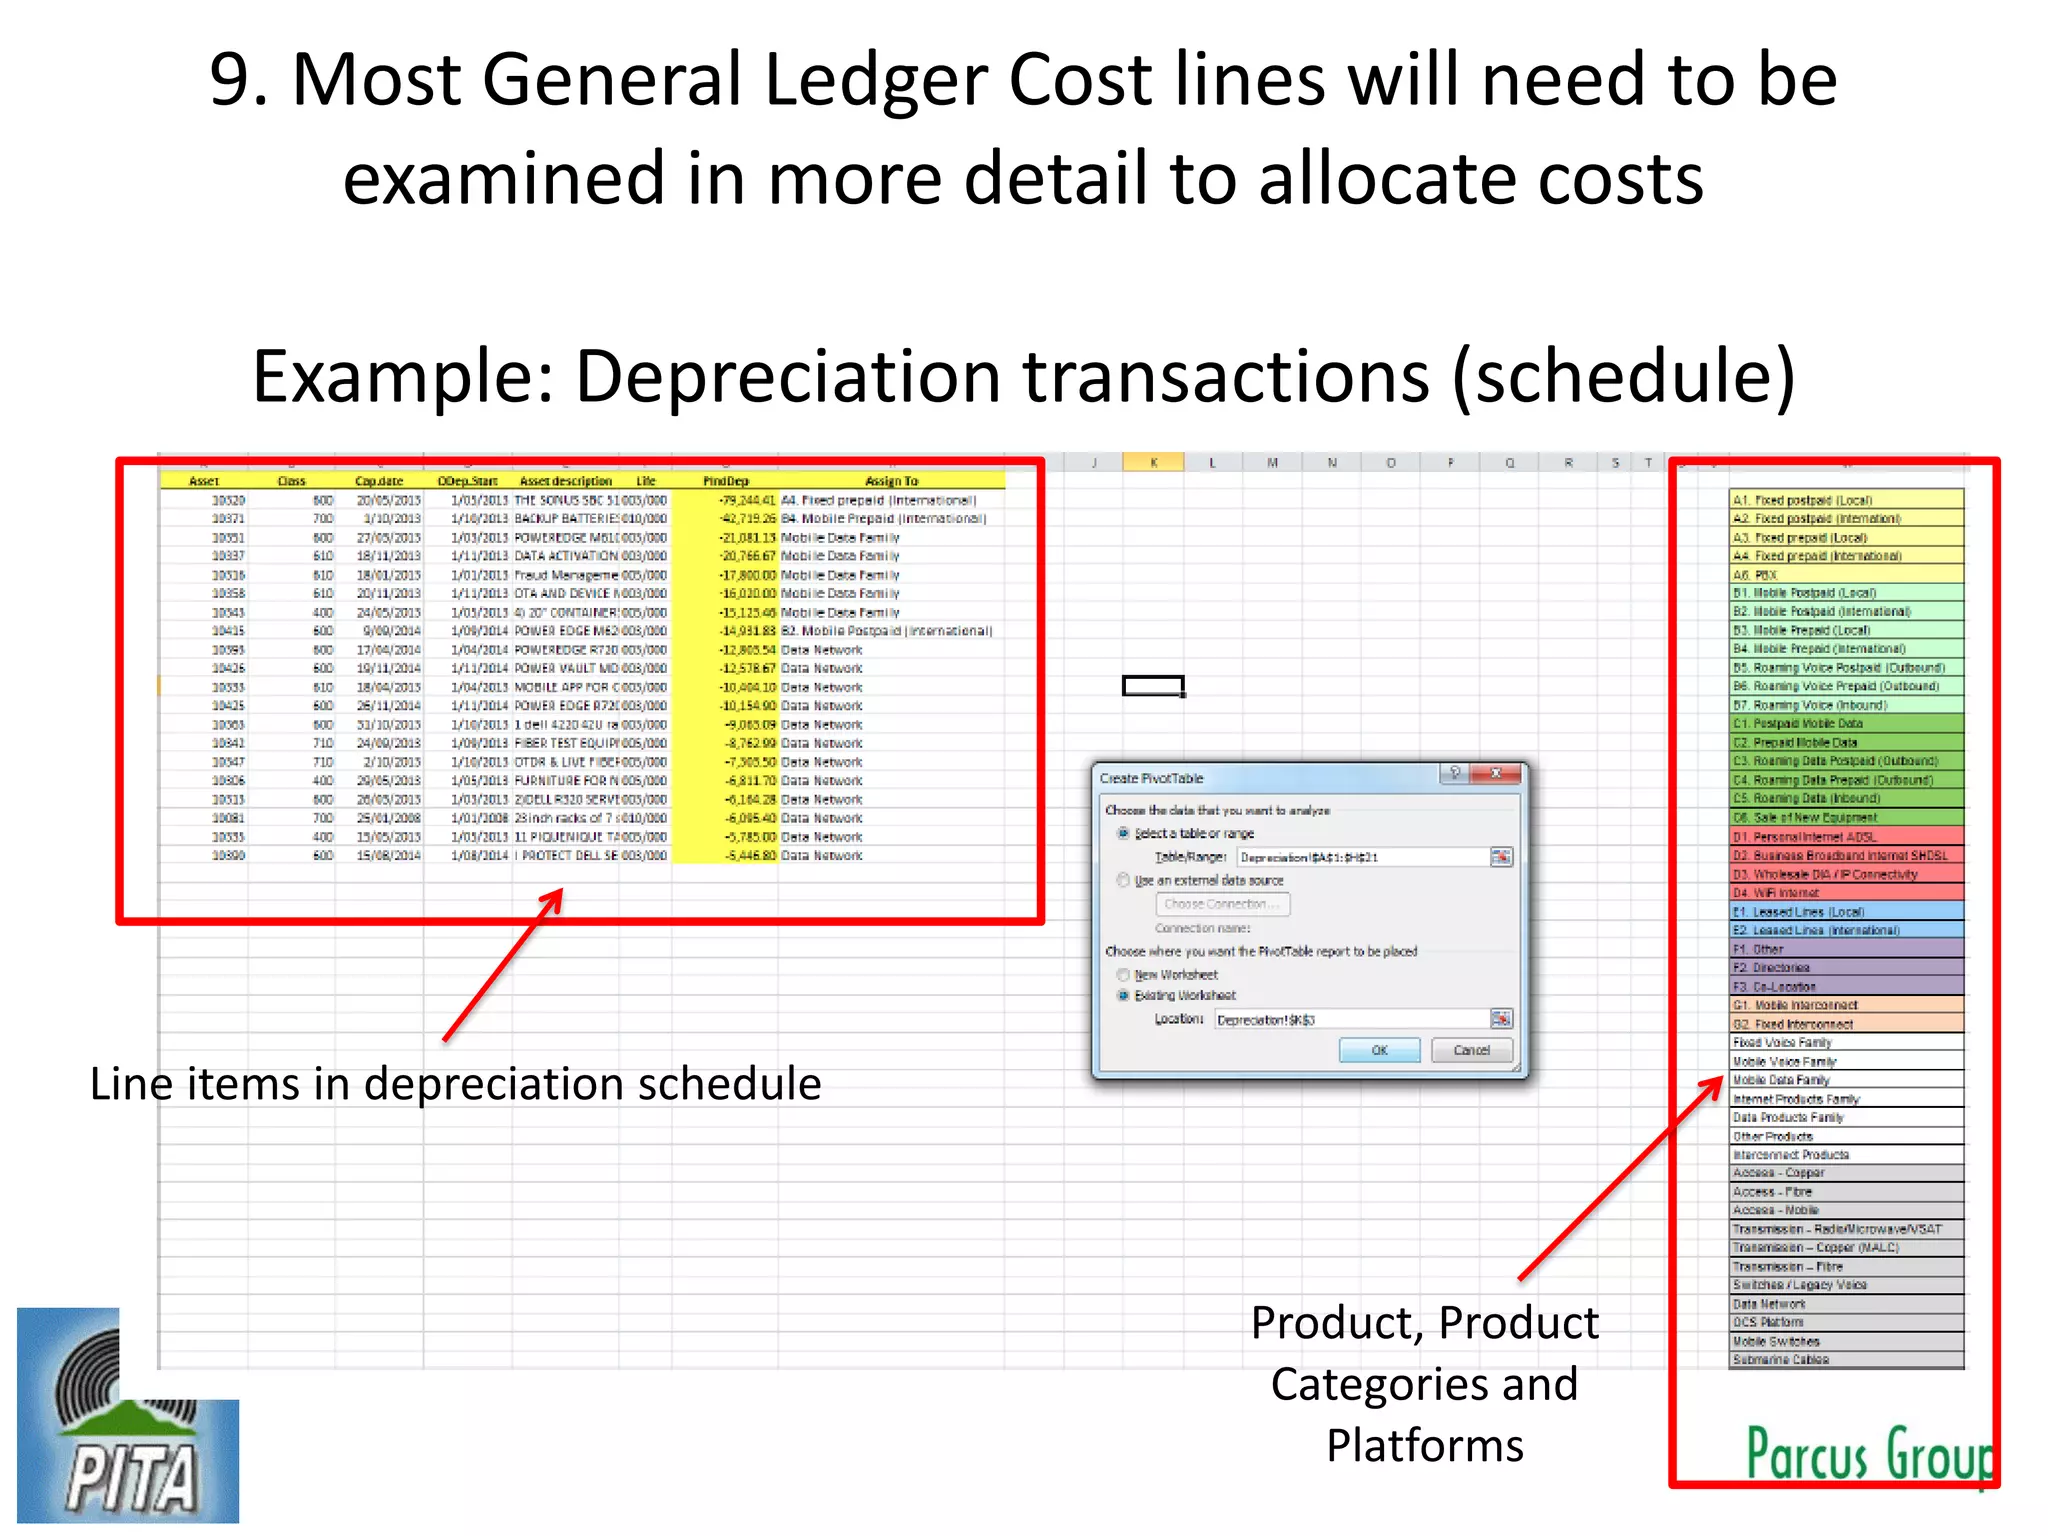
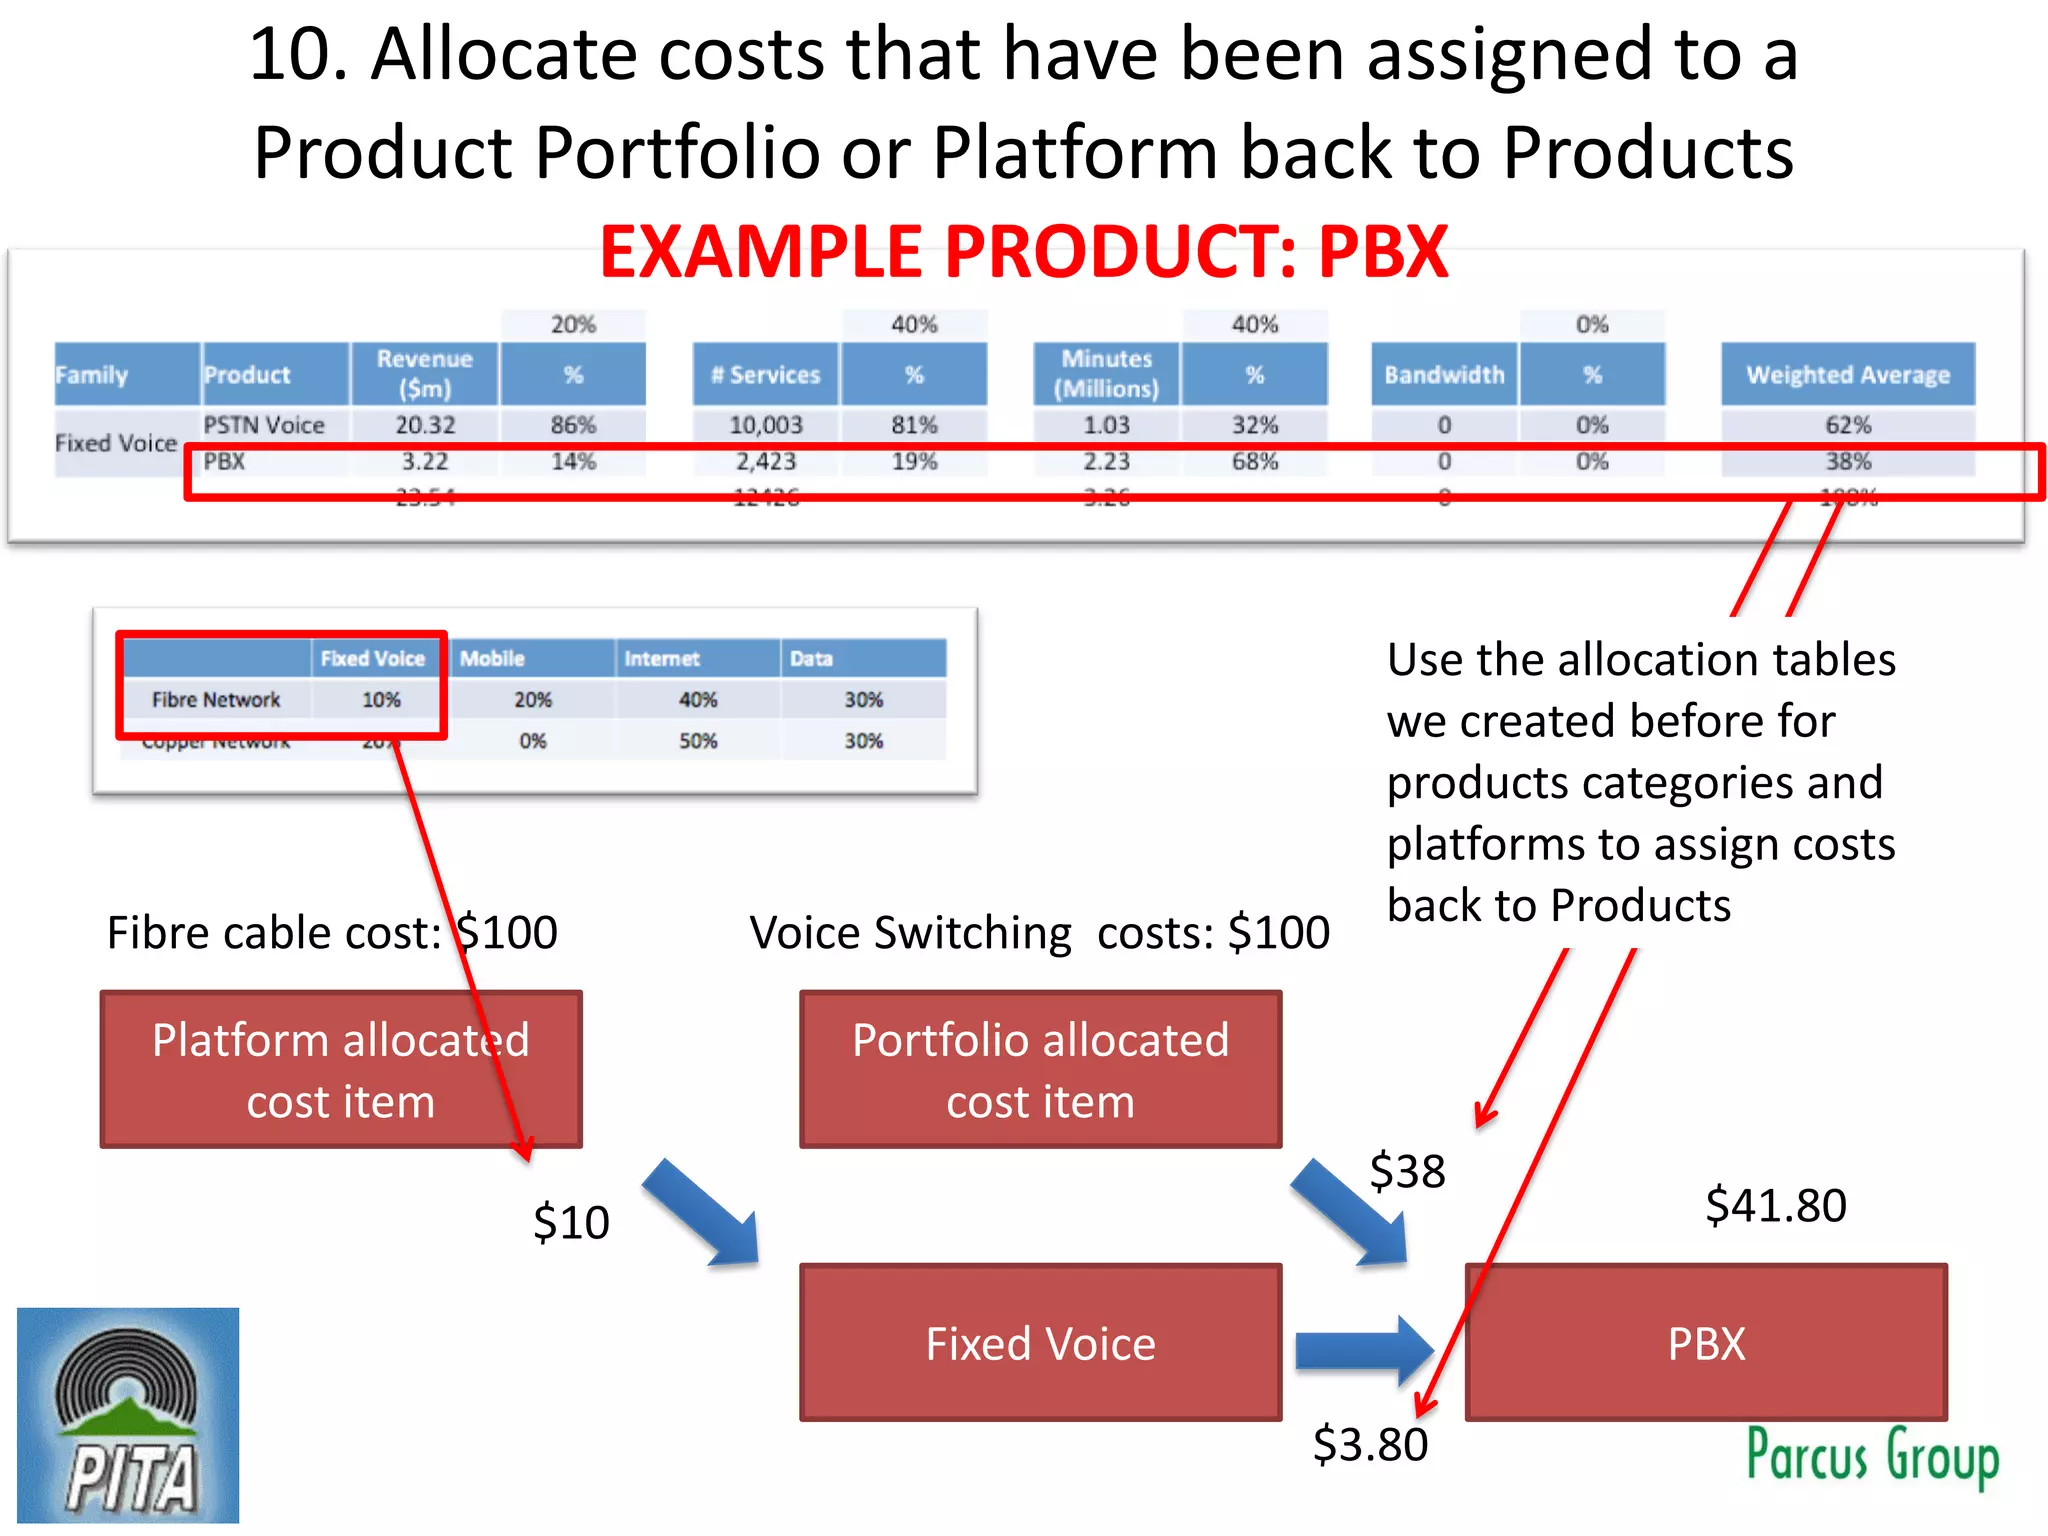
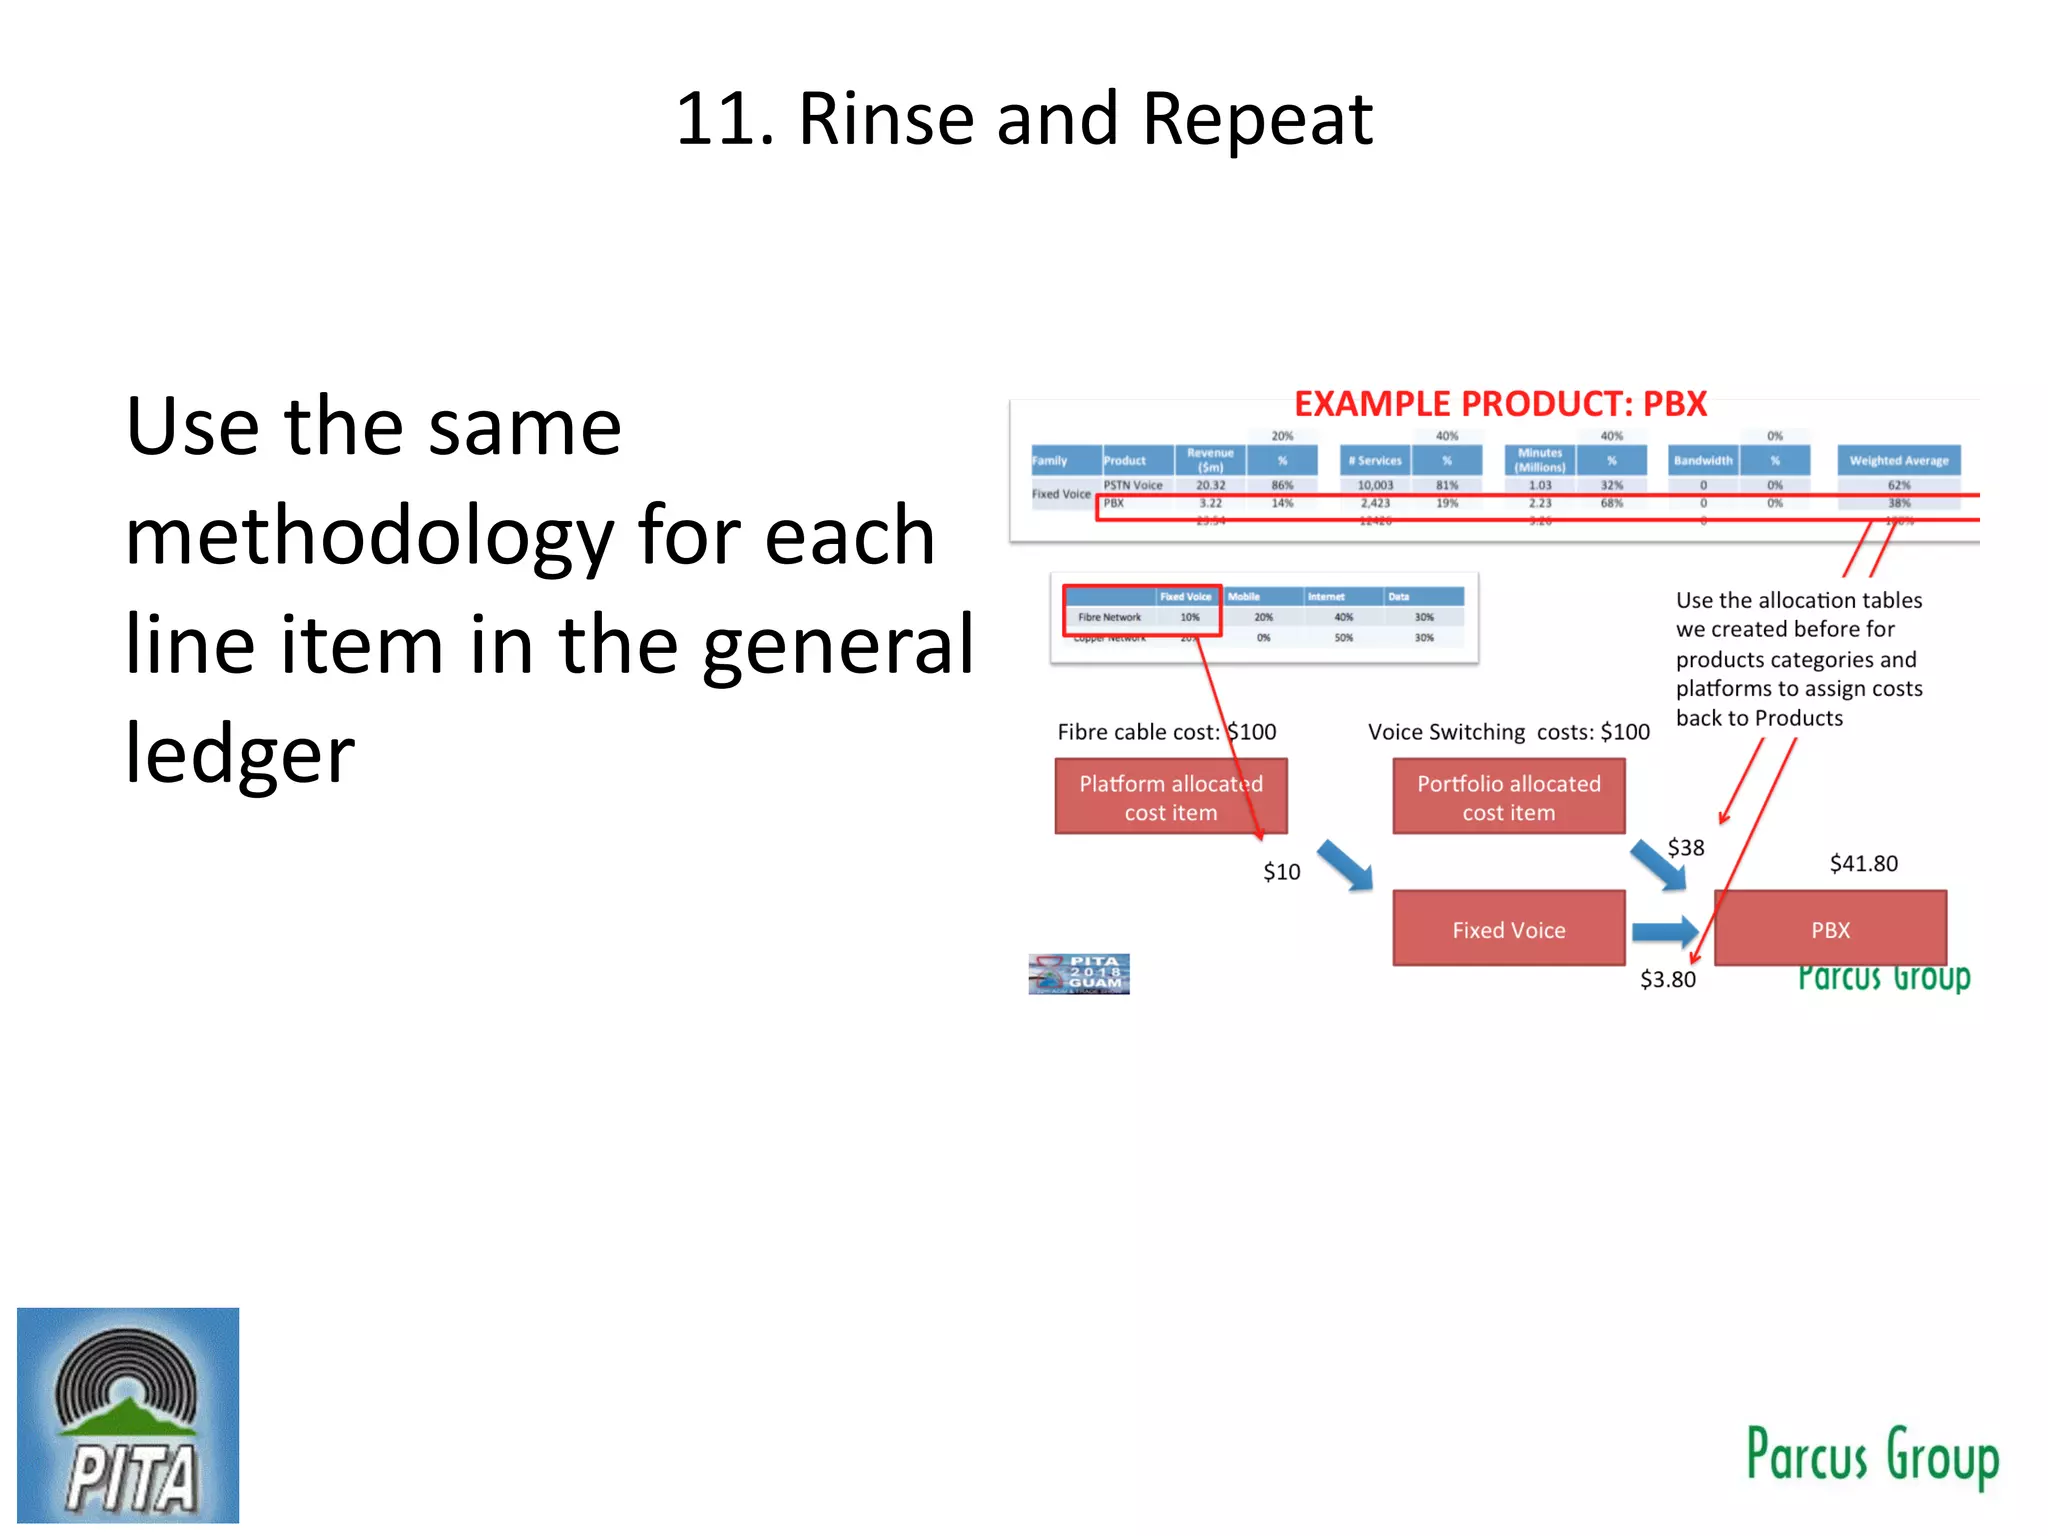
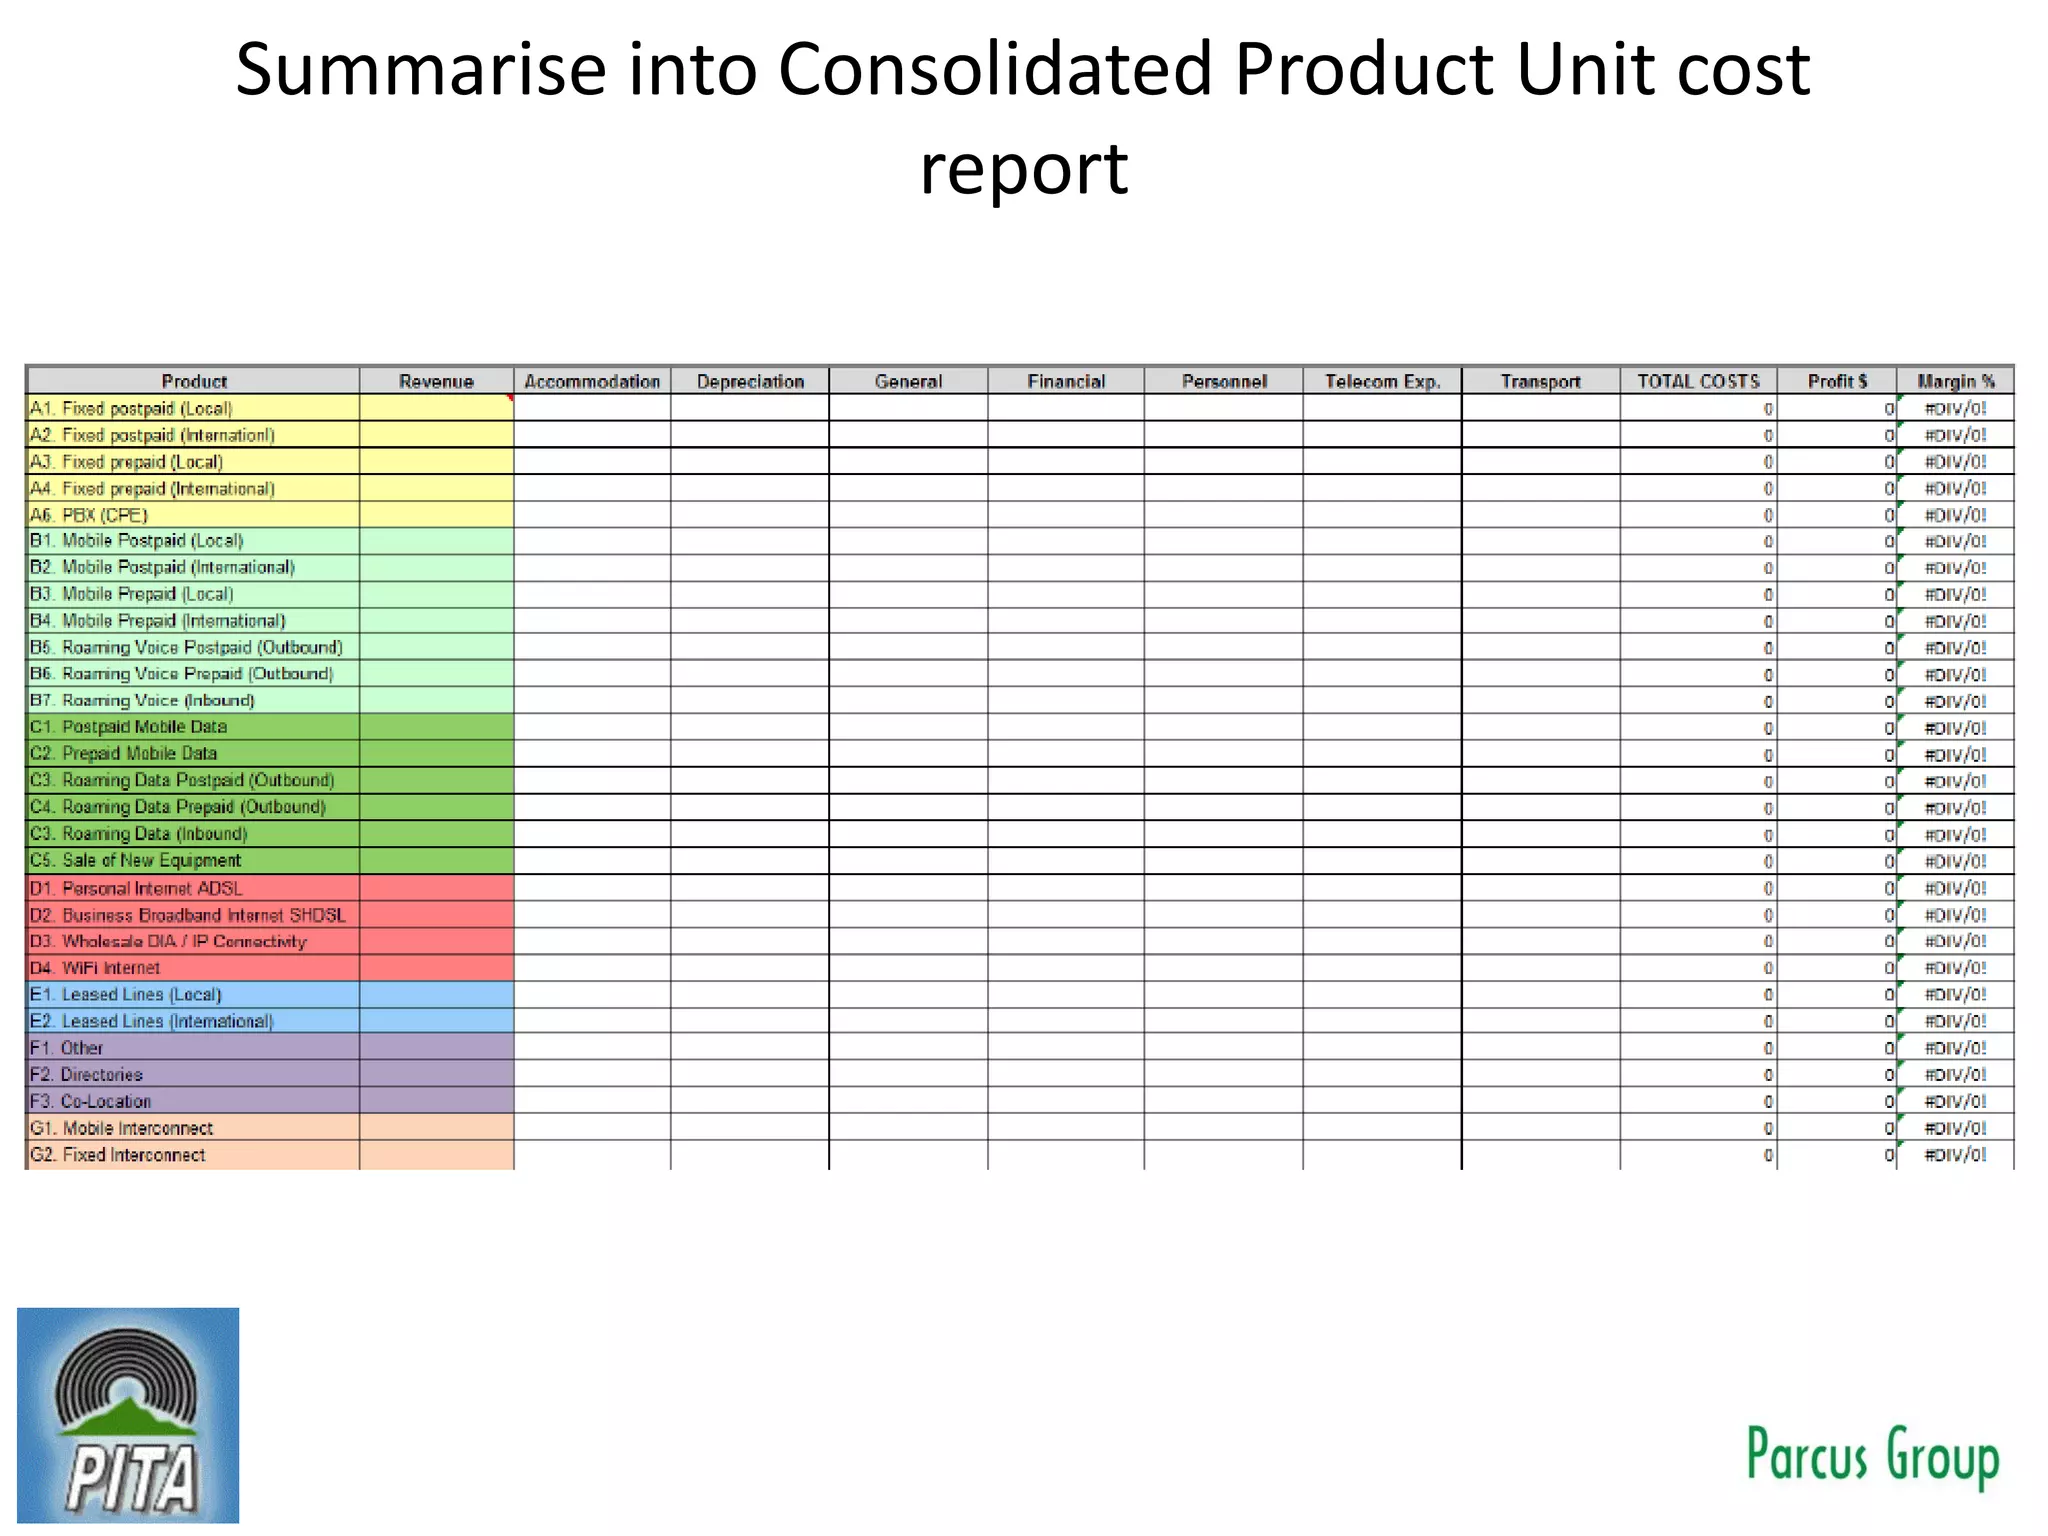

This document provides a framework and methodology for cost modelling in the telecom industry. It involves 3 main steps: 1) defining product matrices to categorize all billable products and platforms, 2) collecting relevant data on revenue, subscribers, usage, and costs to allocate to products and platforms, and 3) allocating costs based on factors like subscribers, usage, and network utilization to determine unit and total costs for each product. The goal is to develop a comprehensive model to understand the true costs of all products and services to inform pricing strategies.


![Vibe Coding vs. Spec-Driven Development [Free Meetup]](https://cdn.slidesharecdn.com/ss_thumbnails/vibecodingvsspecdrivendevelopment-251209105622-43f455e7-thumbnail.jpg?width=640&height=640&fit=bounds)


