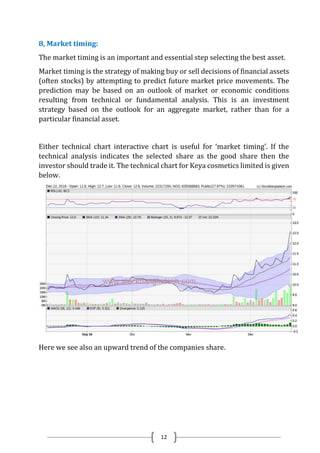
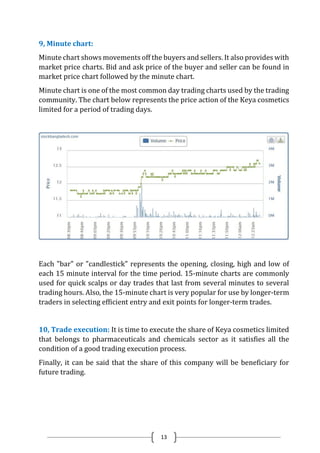
The document discusses the process of selecting a stock for investment from a particular sector. It begins by discussing how to identify a sector that investors are interested in based on its market composition and trading levels. It then examines the money flow status of companies in the selected sector. Next, it compares the sector index of the selected sector to other sectors to identify better investment opportunities. It outlines how a data matrix can be used to filter companies based on financial metrics. It also discusses how the company page and fundamental/news charts of a selected company provide important investment information. Technical charts are analyzed to time the market and select a stock showing upward trends.
![6
4, Data matrix:
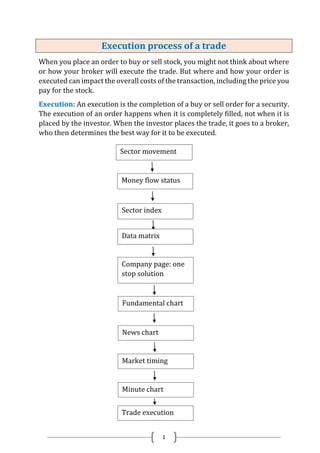
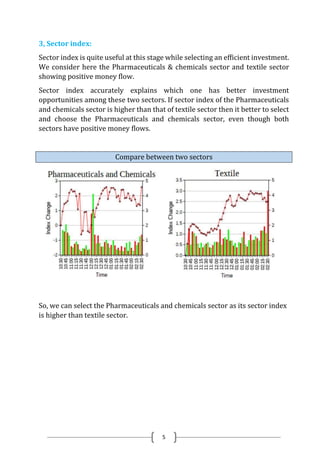
The Pharmaceuticals and chemicals sector is selected as it is identified as
feasible for investment. It is now important to figure out price related and other
information for all companies of the Pharmaceuticals and chemicals sector.
Data matrix allows the investor to sort price- related and other data for a given
sector in terms of profit or return and in terms of other attributes.
For example, data sort can be done in terms of information on EPS (Earning per
share), NAV (Net asset value) and volume or price change information etc.
Some can select desired companies of the Pharmaceuticals and chemicals
sector: data matrix would be expected to portray required information (say
price change) for every minute’s interval.
[Net asset value (NAV) is the value of an entity’s assets minus the value of its liabilities. Often
in relation to open-end or mutual funds. The volume is commonly reported as the number of
shares that changed hands during a given day. The average volume of a security over a longer
period of time is the total amount traded in that period, divided by the length of the period.]
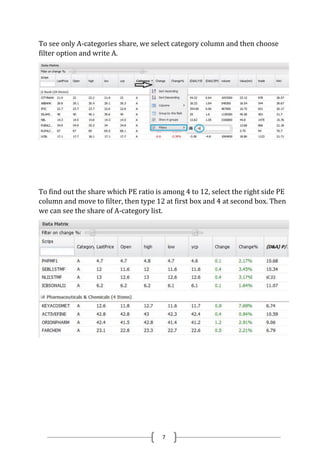
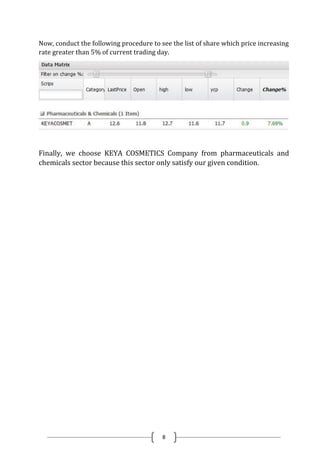
Procedure: Data matrix is a very powerful scanner by which one can select a
share according to his own choice. Let, one eager to see the list of companies
which PE ratio are between 4 to12 and the rate of price increase is greater than
5% among the A-category share. By using Data matrix one can easily find out
that list.
Some column are used as default in Data matrix tools. Now, it is necessary to
add the category column.](https://image.slidesharecdn.com/8e95746f-4b43-4af8-b219-8bd78304ad48-170202172552/85/Team-work-on-stock-maarket-6-320.jpg)
![9
5, Company page: one stop solution
When a companies selected by analyzing all of the companies that belong to a
given sector, then the company page of the selected company provides
important and useful information for investors. For example: information
highest and lowest price of current year, volume, minuet chart, sector chart,
sector details, share holdings, capital details, beta coefficient, basic information
and company news etc. can be found and evaluated visiting the company page.
Company page of the other similar and competitive companies can also be
visited at this stage. This enables the investor to confirm his/her selection.
[Beta is a measure of the volatility, or systematic risk of a security or a portfolio in comparison
to the market as a whole. Beta is used in the capital asset pricing model (CAPM), which
calculates the expected return of an asset based on its beta and expected market returns.]
6, Fundamental chart:
Financial condition of last few years can be exhibited by fundamental charts.](https://image.slidesharecdn.com/8e95746f-4b43-4af8-b219-8bd78304ad48-170202172552/85/Team-work-on-stock-maarket-9-320.jpg)
![11
7, News chart:
The news chart allows the investors to know the dates the selected company
generally deposits the dividend.
[A dividend is defined as a payment made by a corporation to its shareholders. Usually these
payouts are made in cash (called “cash dividend”), but sometimes companies will also
distribute stock dividend, whereby additional stock shares are distributed to shareholders.
Stock dividend is also known as stock splits.]
From the chart, we see that there is an upward trends of dividend deposit.](https://image.slidesharecdn.com/8e95746f-4b43-4af8-b219-8bd78304ad48-170202172552/85/Team-work-on-stock-maarket-11-320.jpg)


![ShinjuDilshad[1]](https://cdn.slidesharecdn.com/ss_thumbnails/4103a145-b424-4188-bc54-5988c626ff9d-170202110643-thumbnail.jpg?width=640&height=640&fit=bounds)


