Download to read offline


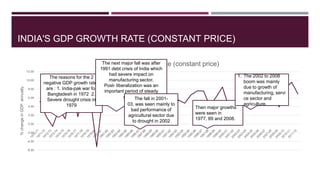
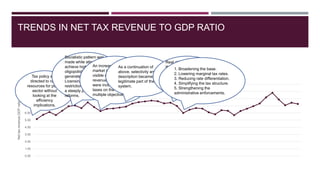
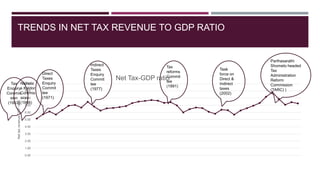
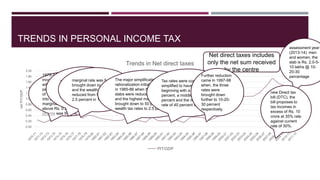
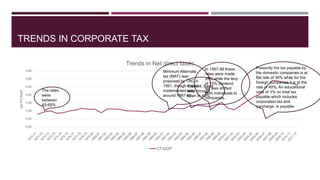
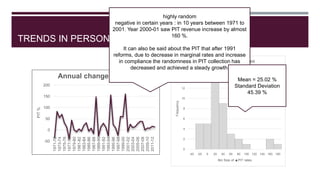
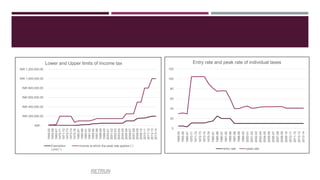
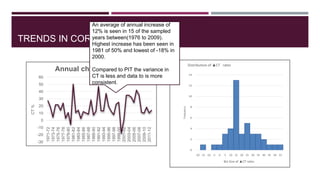
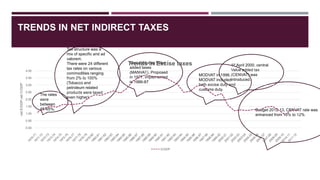
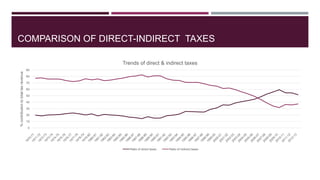
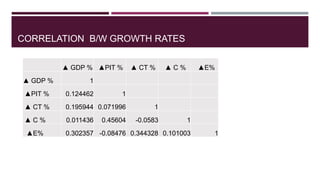
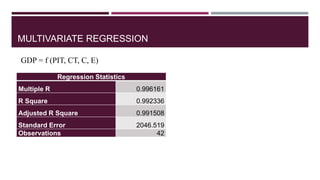
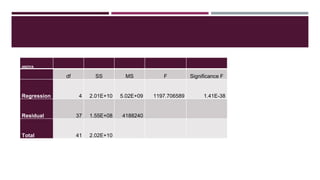
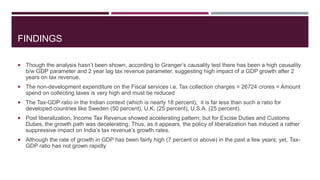


- The document provides statistics and trends related to India's GDP, tax revenue, and tax rates from 1949-2013. It analyzes how tax policies and rates have changed over time. - Key trends include a steady increase in the net tax-GDP ratio from 1949-1971, followed by higher peaks and valleys. Tax rates for personal income and corporate taxes generally declined post-1991 reforms as the system was simplified and broadened. - Indirect tax rates varied widely until reforms in the 1990s consolidated rates and reduced complexity in the system. Overall, tax revenue has grown but still lags targets as a percentage of GDP.


![Getting Started with Apache Spark: Big Data Made Simple [Free Meetup]](https://cdn.slidesharecdn.com/ss_thumbnails/apachesparkgettingstarted-260203175547-8361bcc3-thumbnail.jpg?width=640&height=640&fit=bounds)
