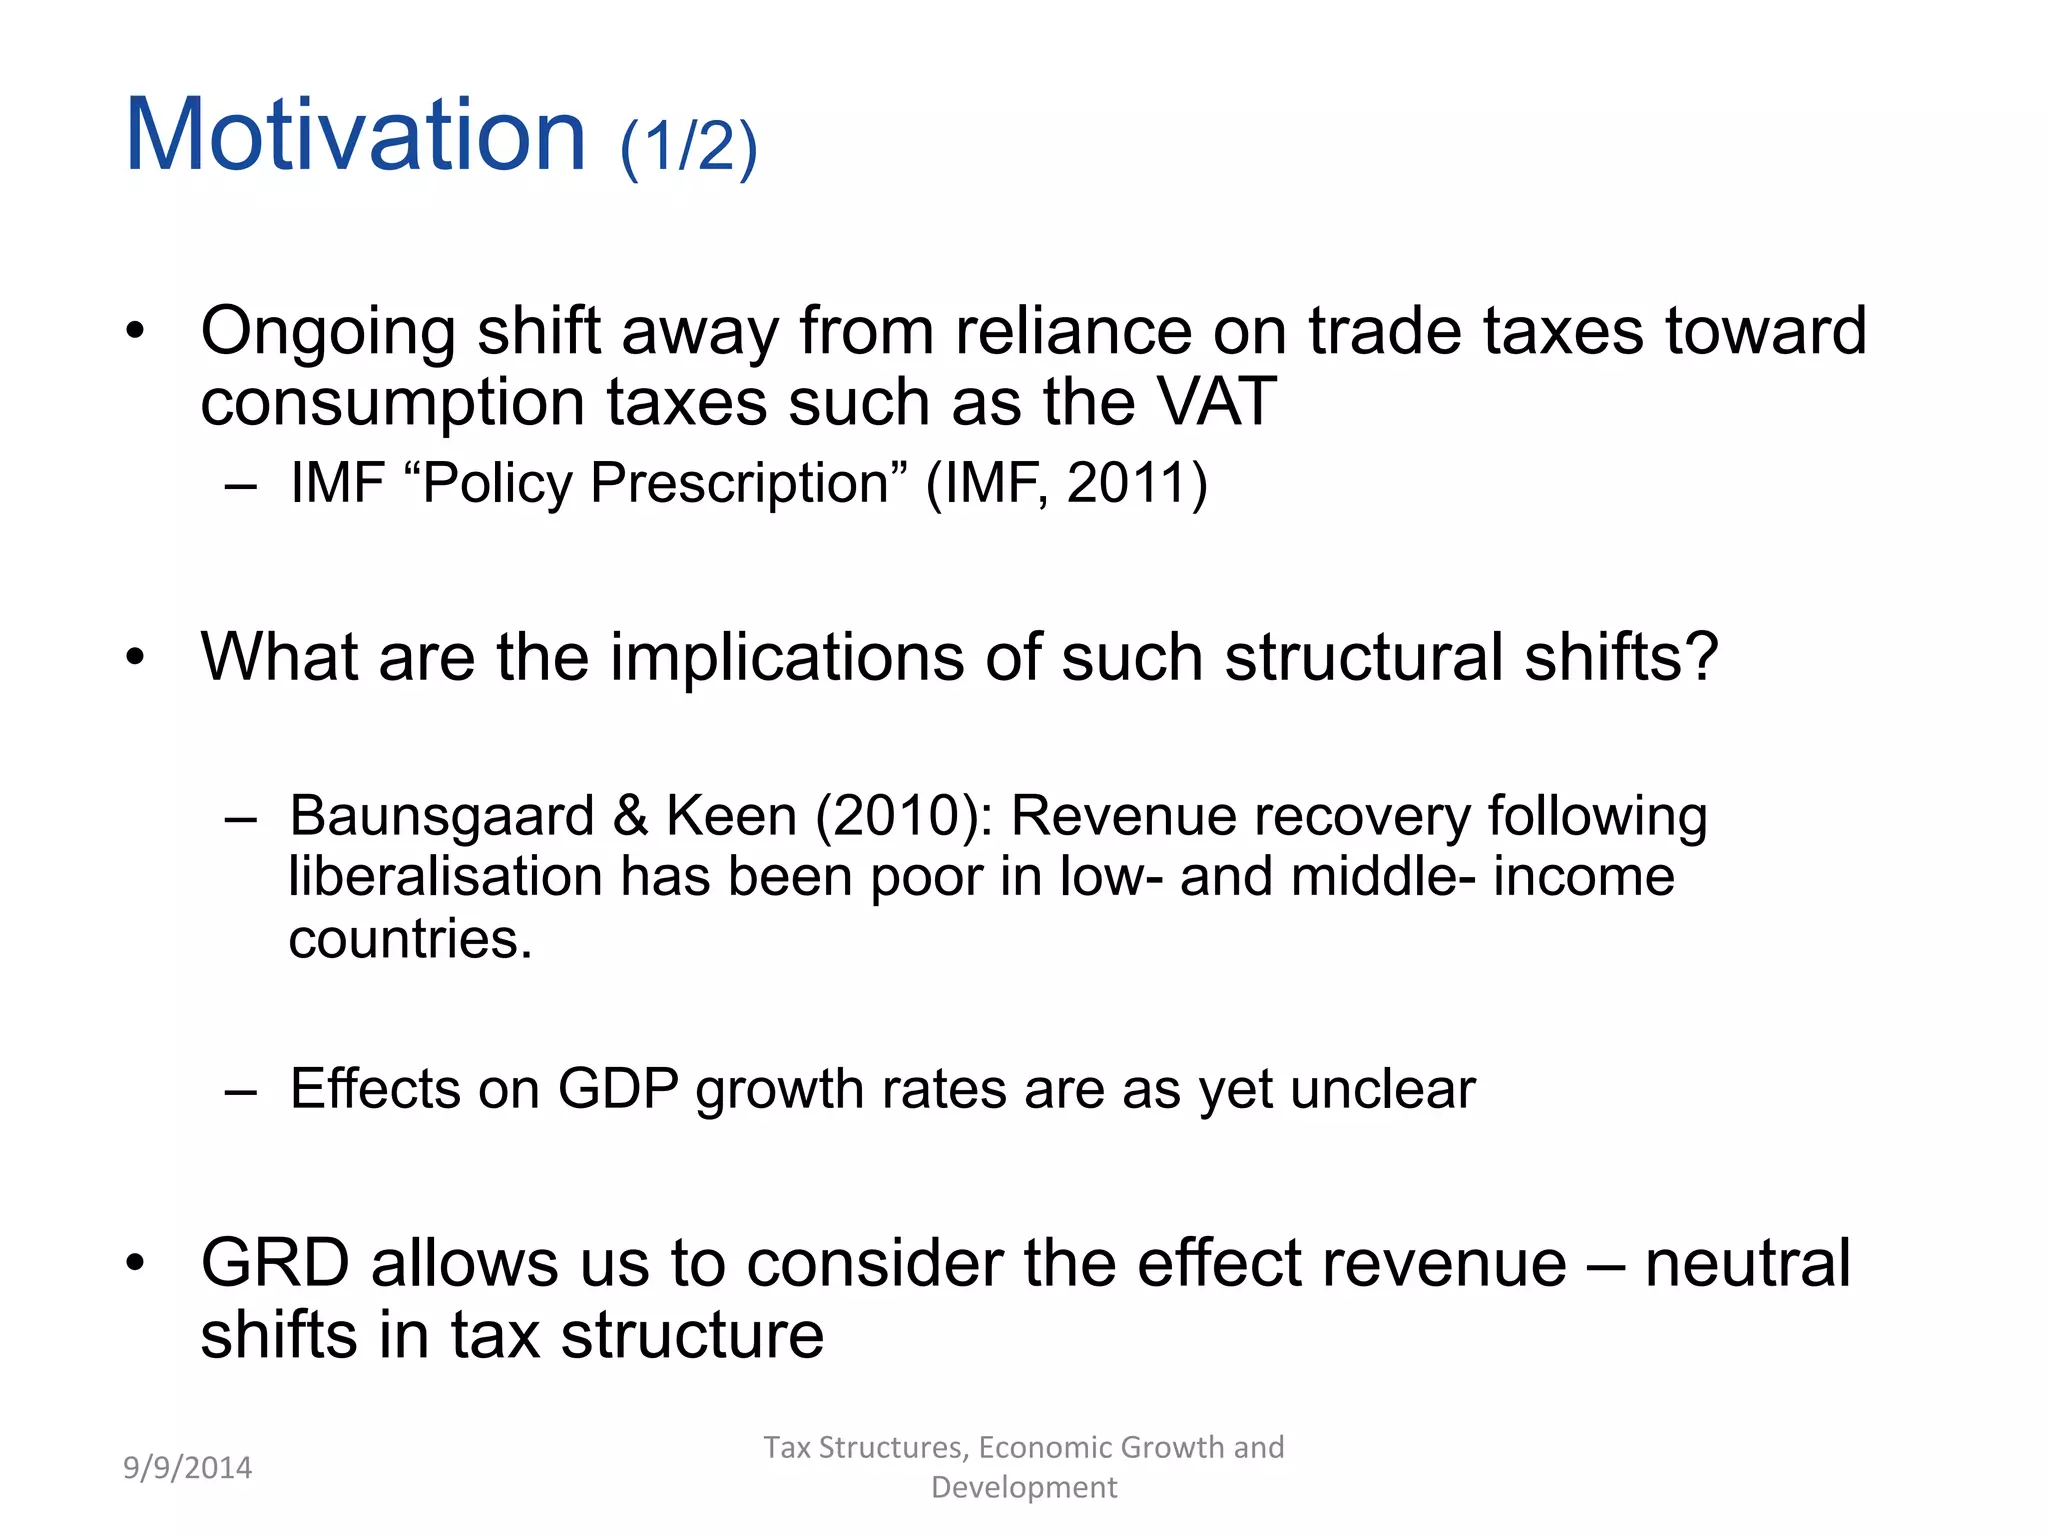
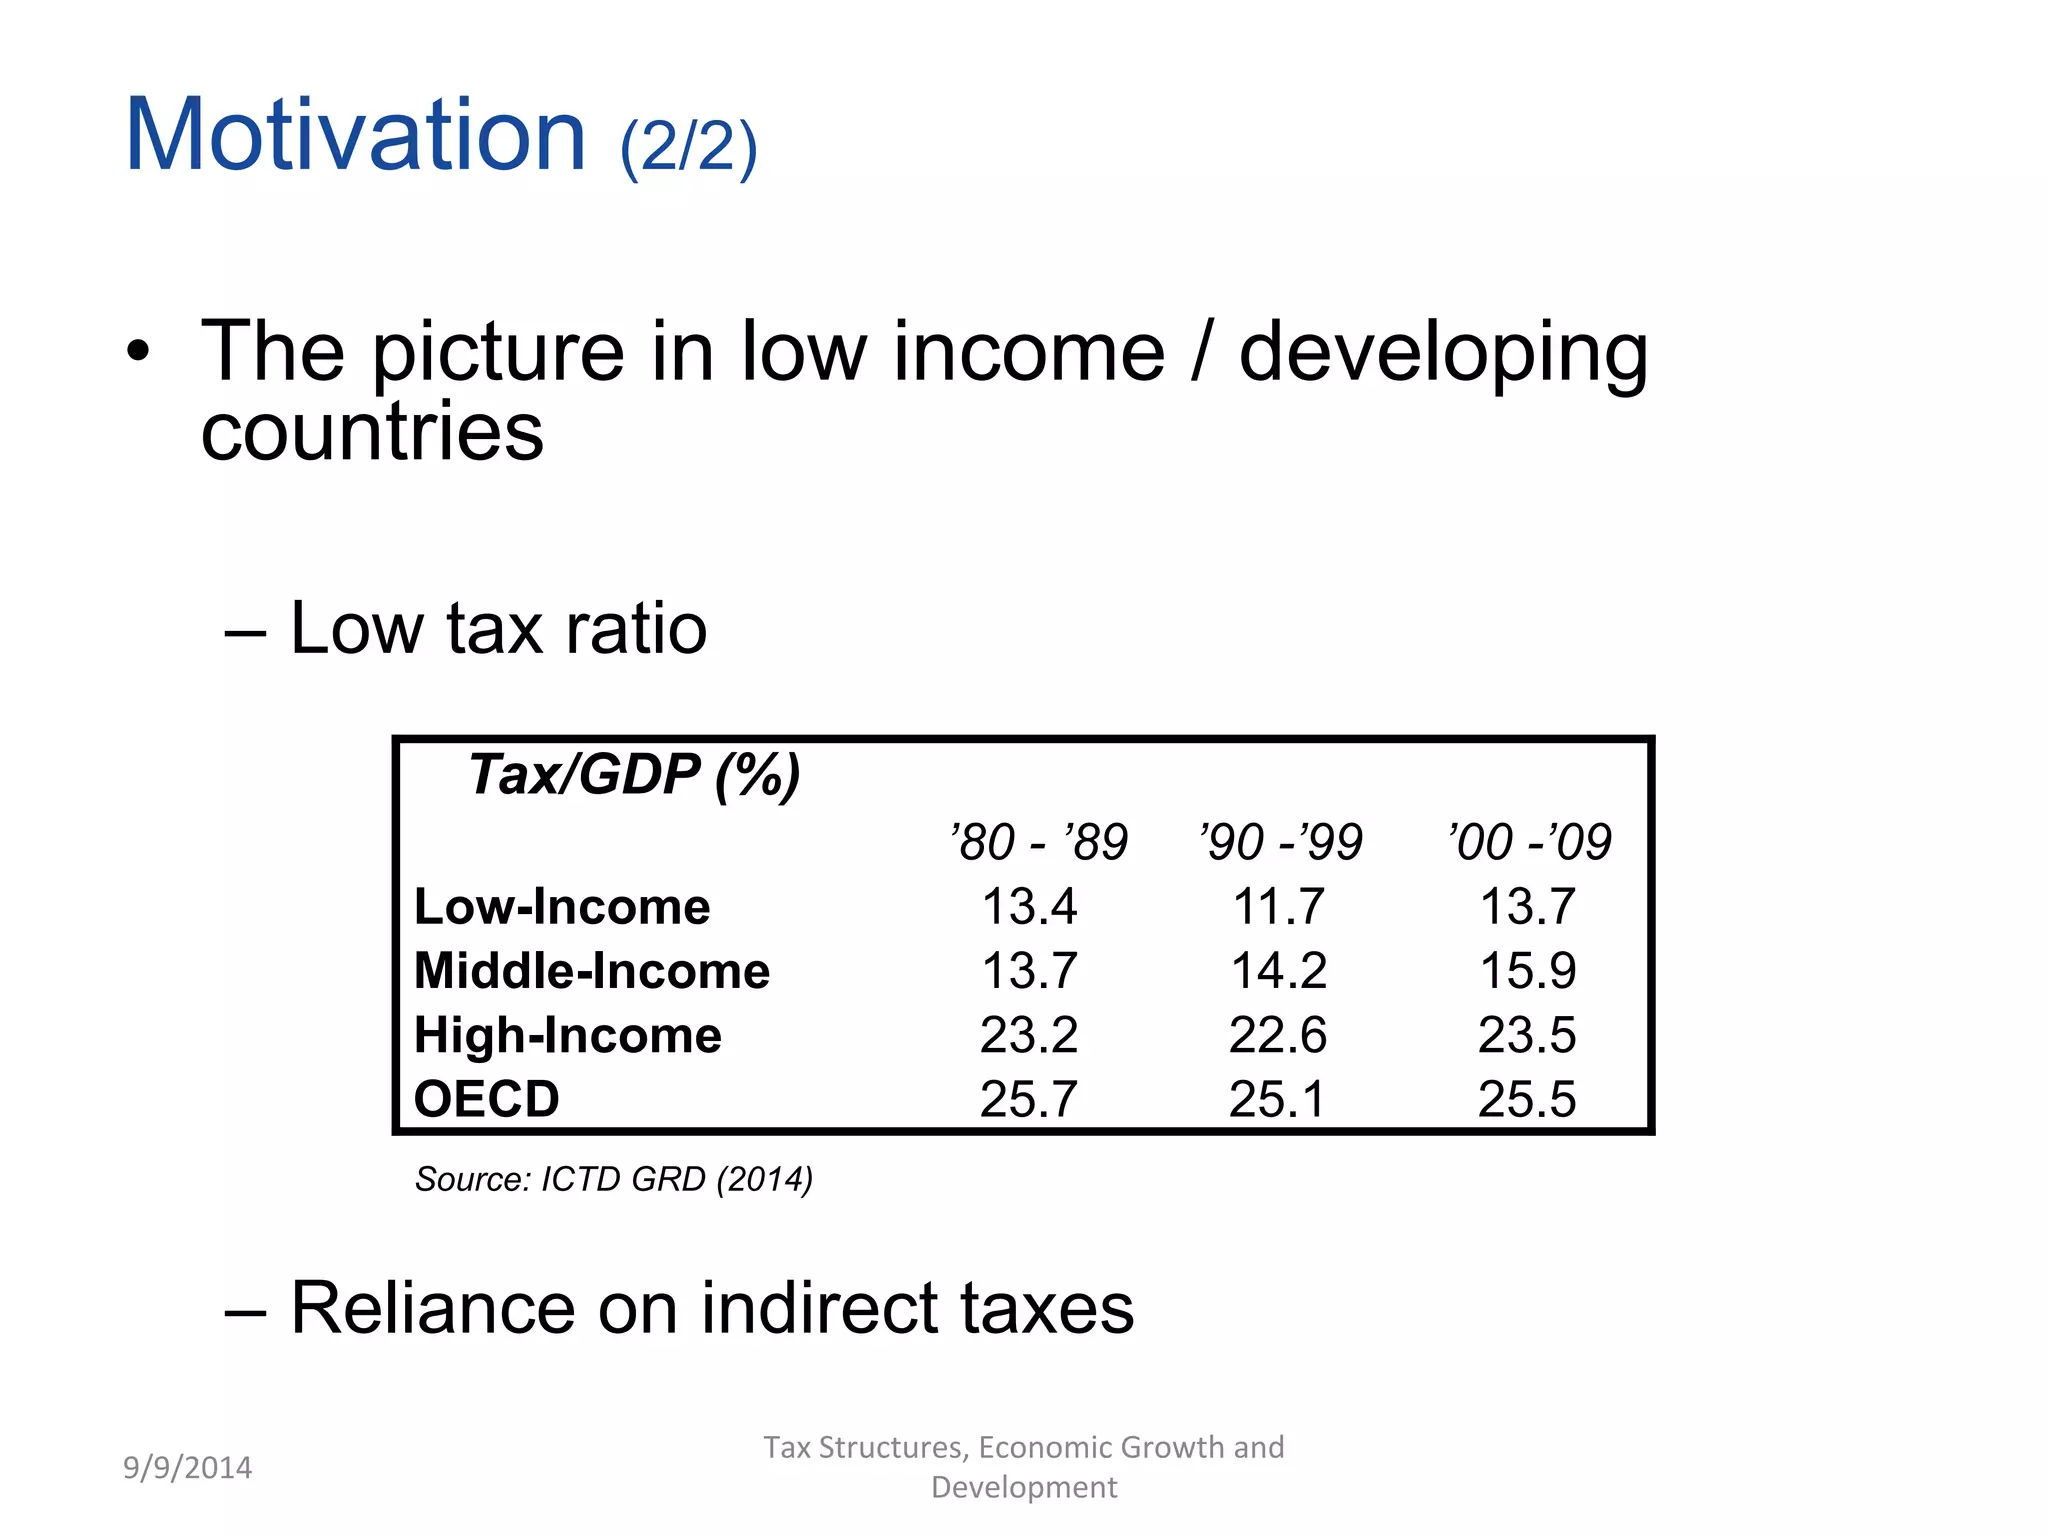
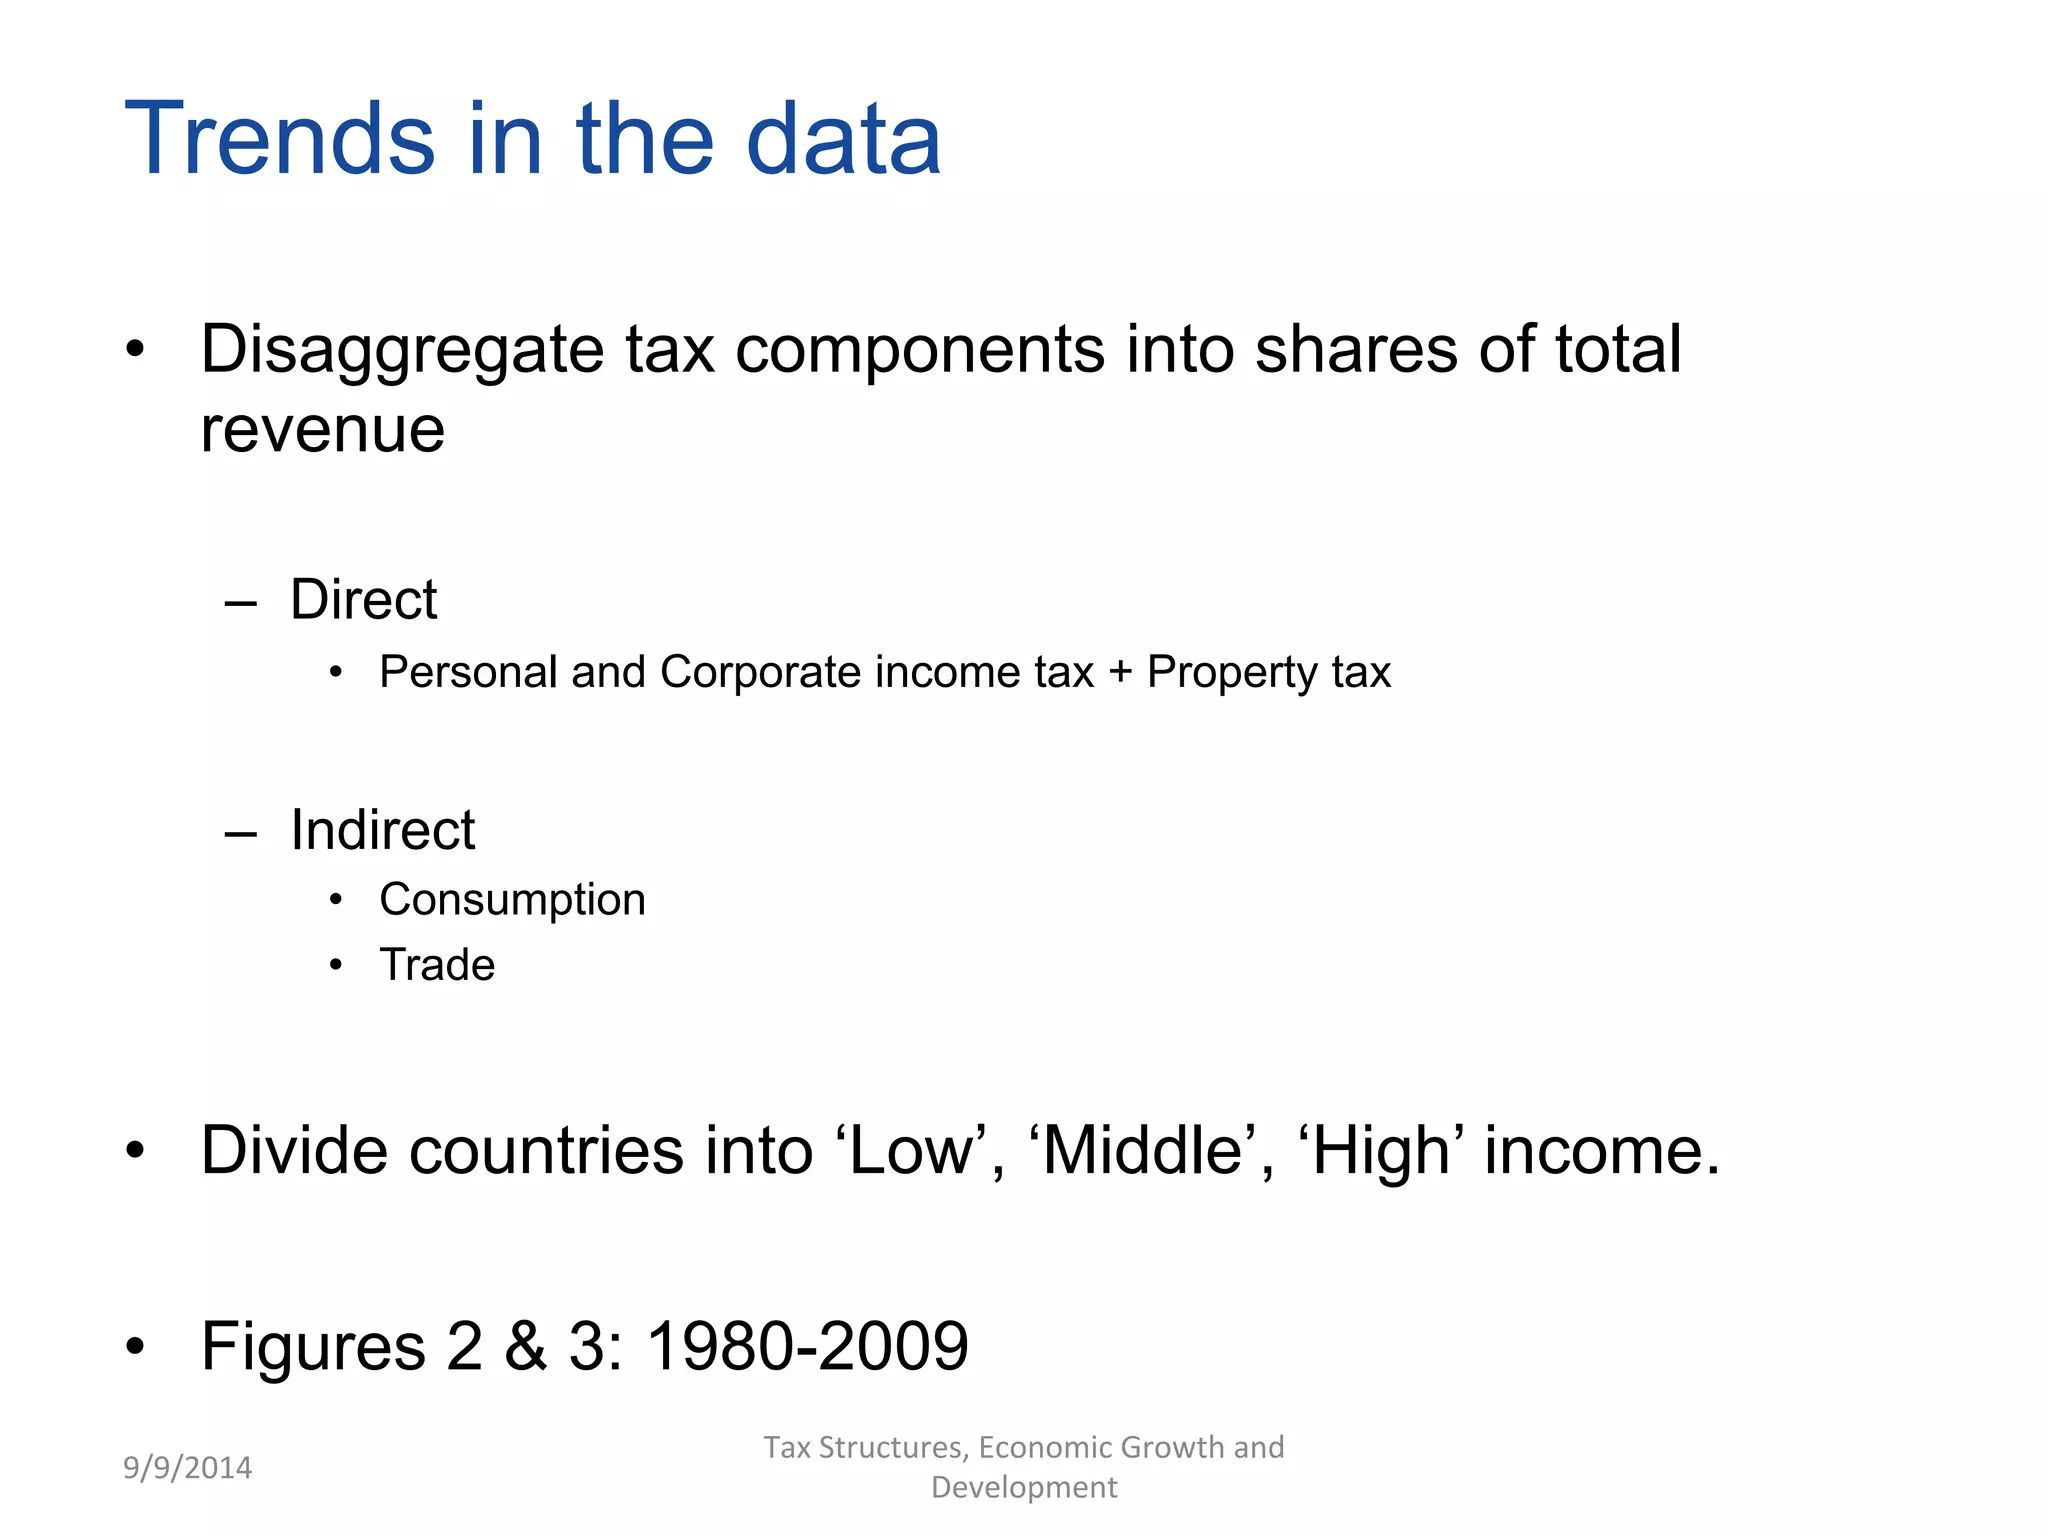
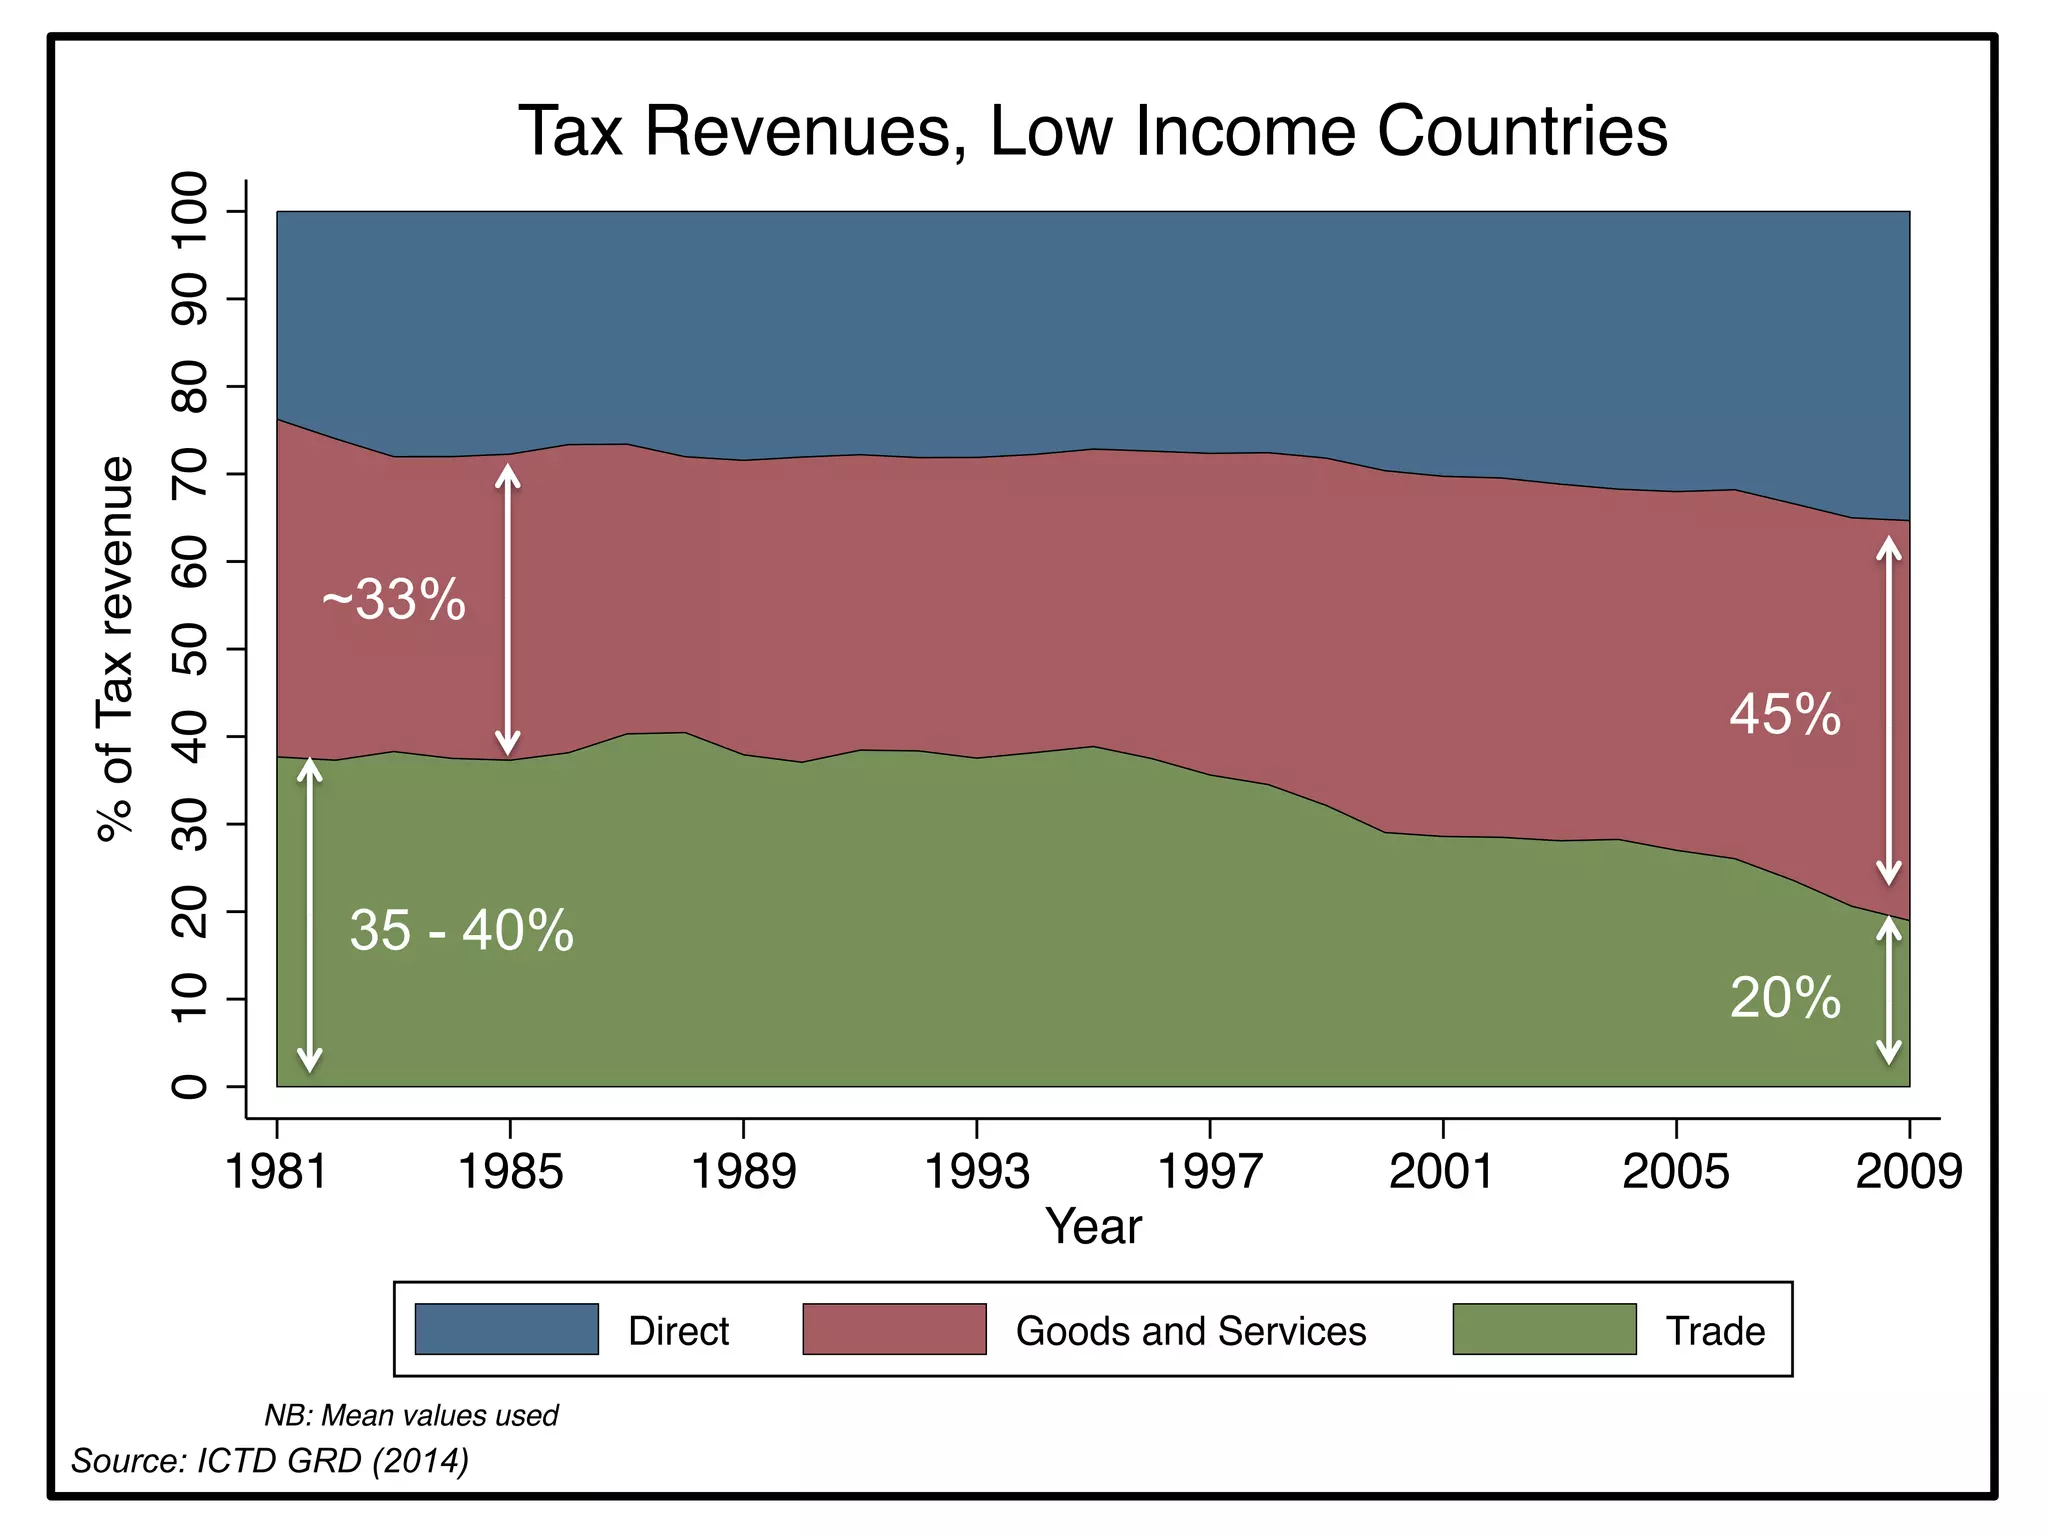
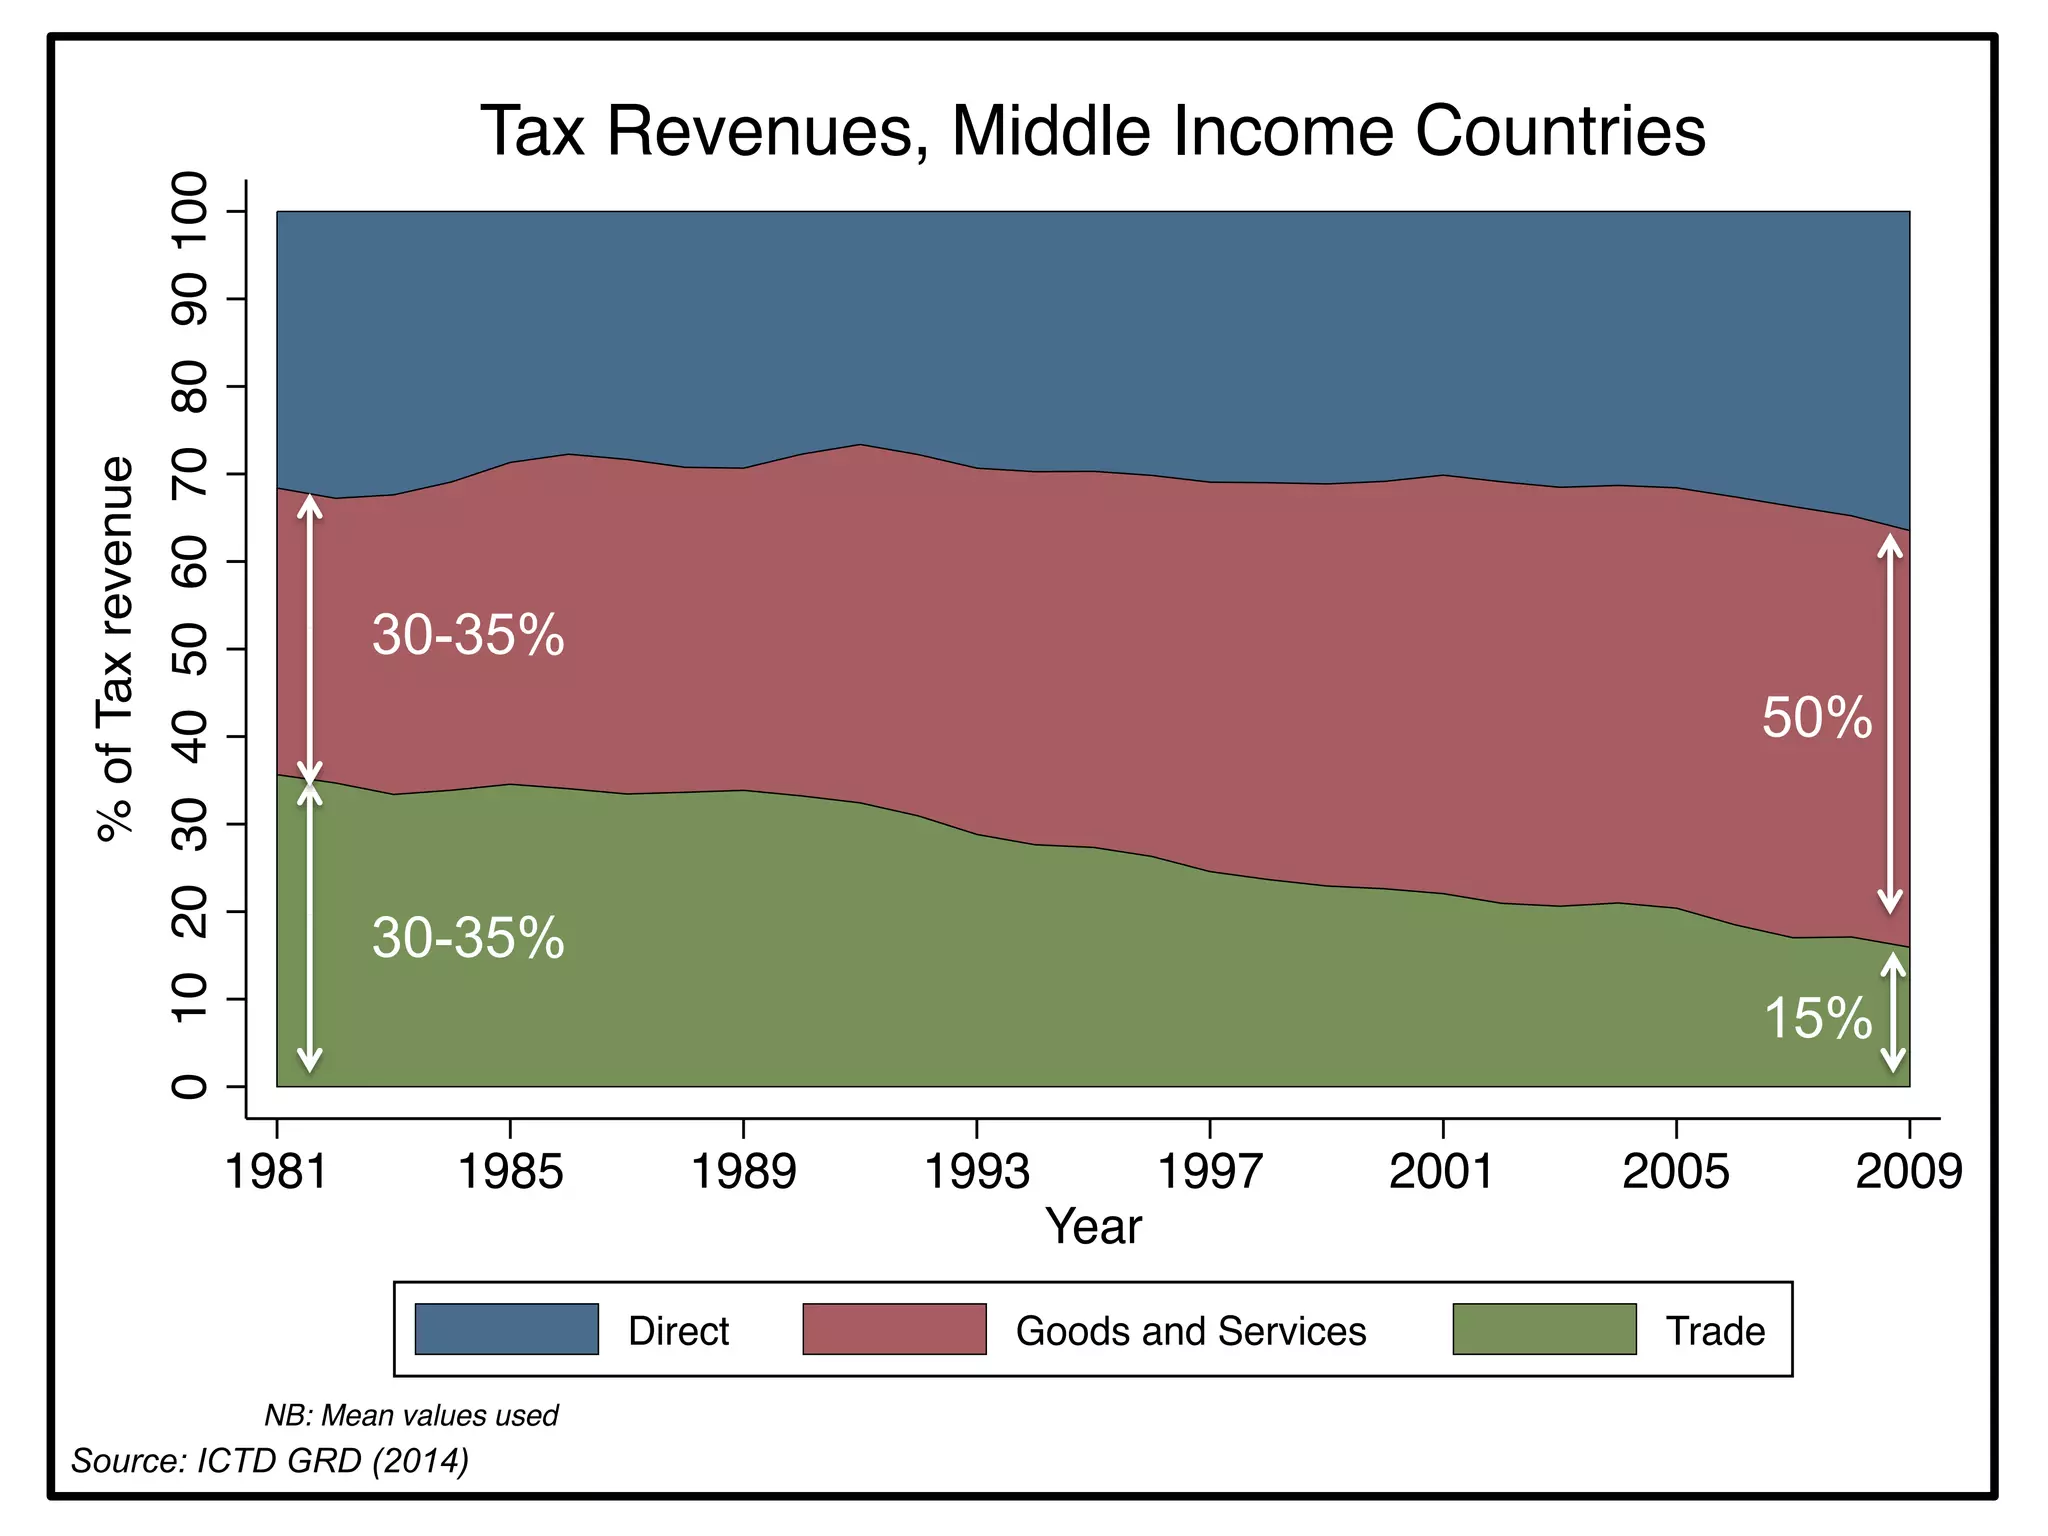
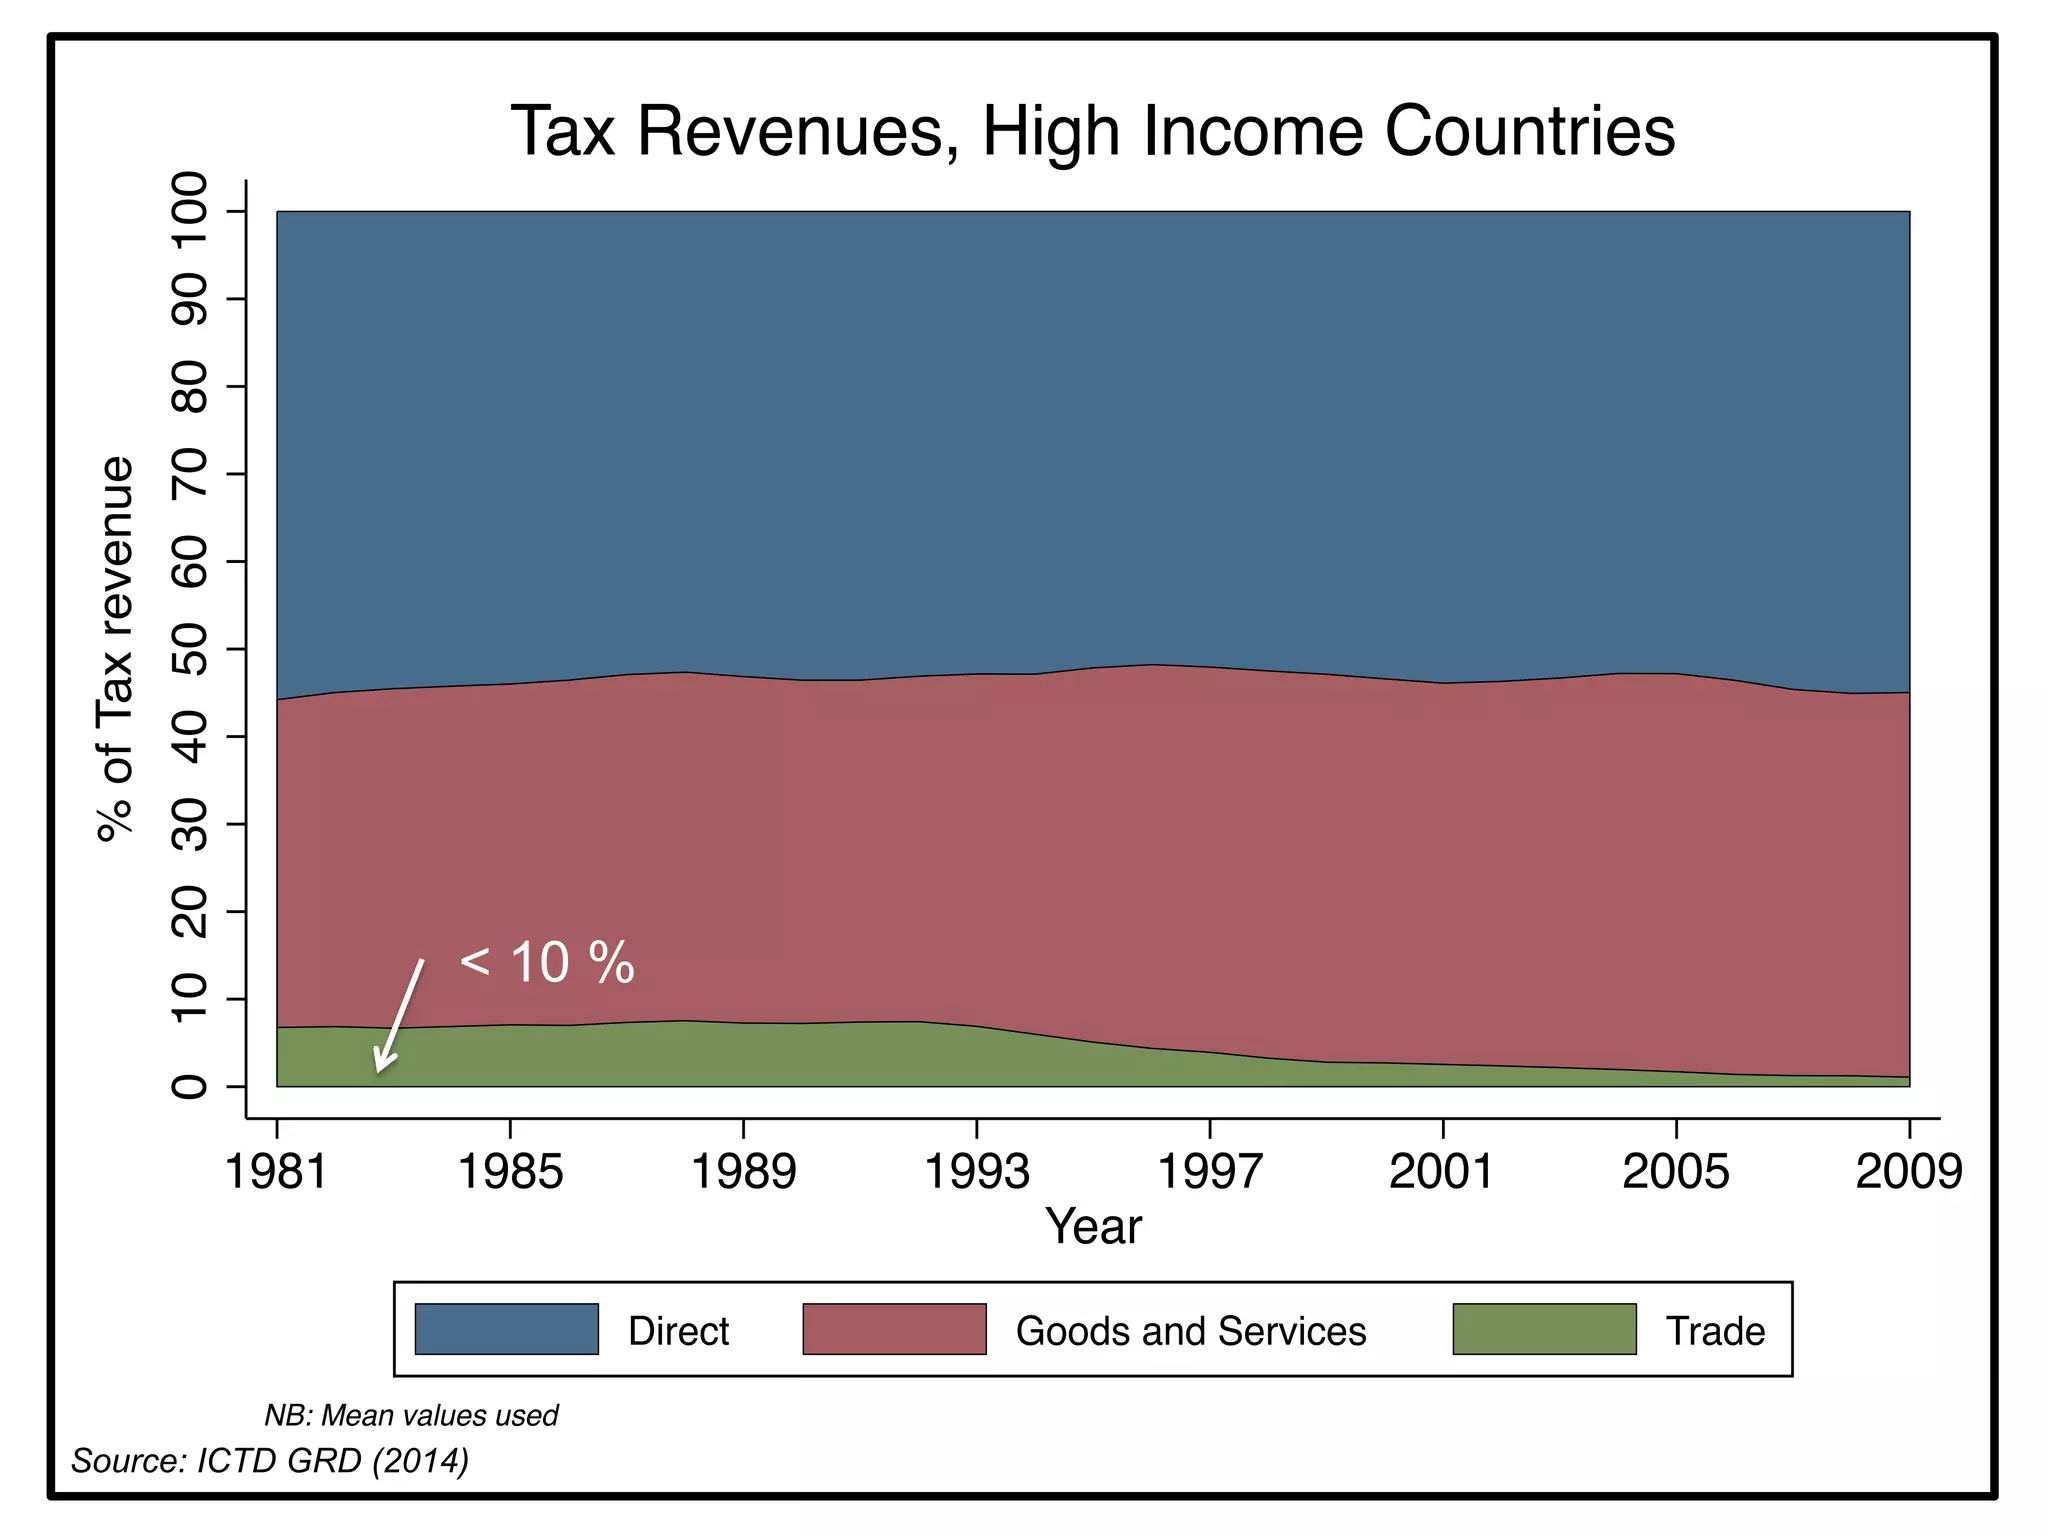
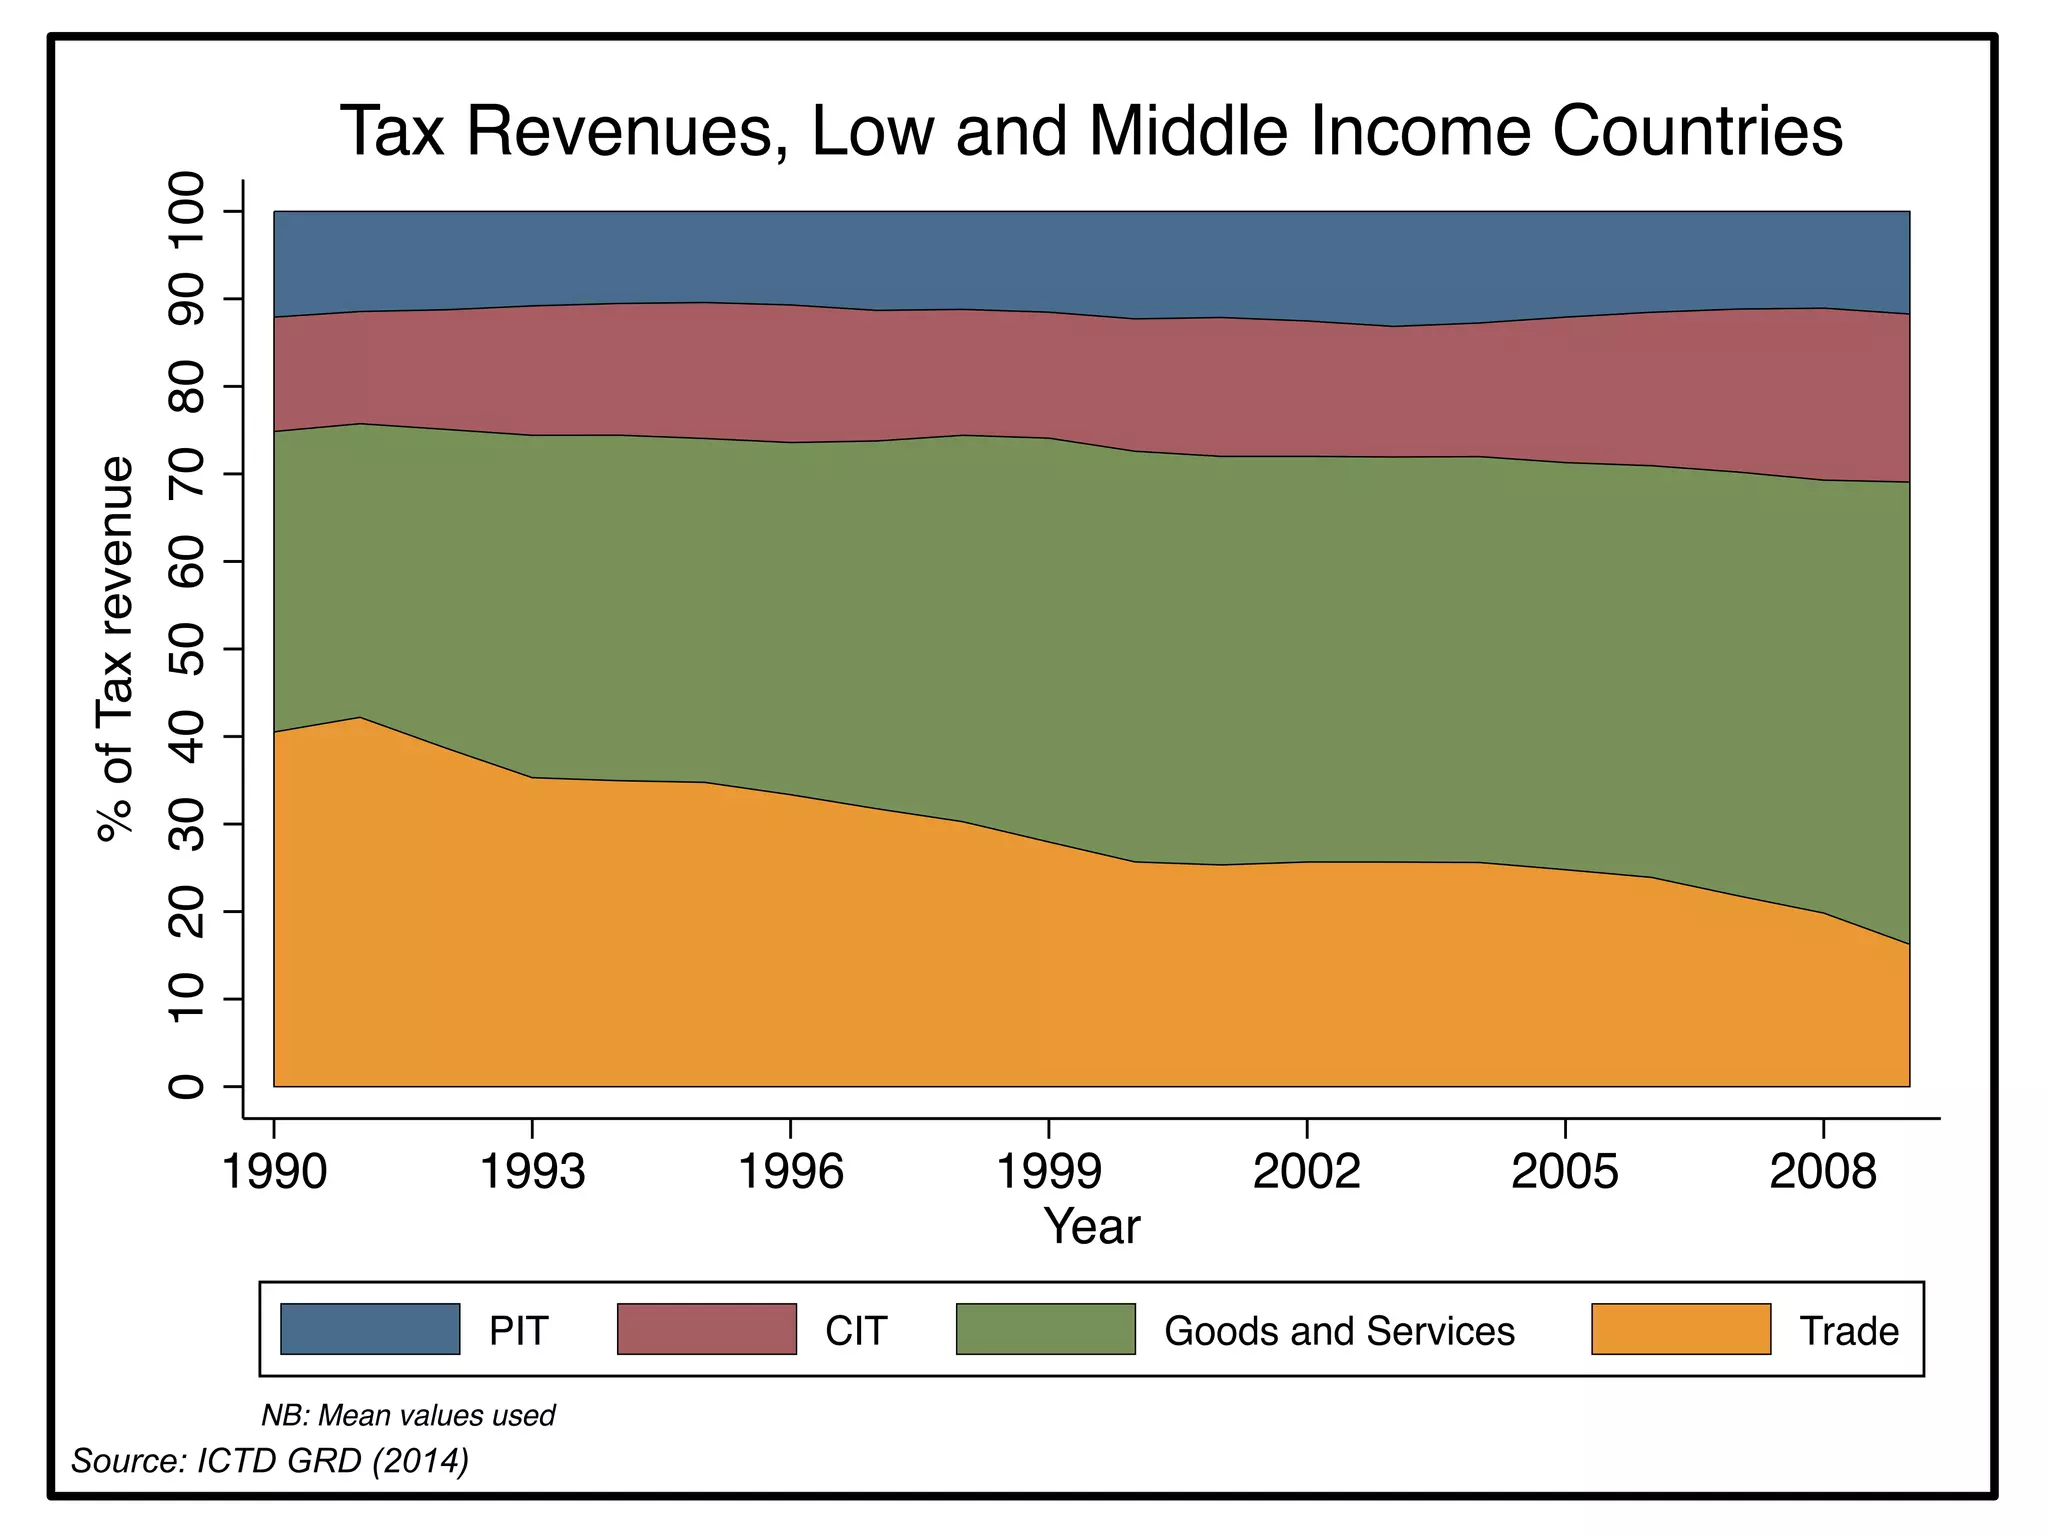
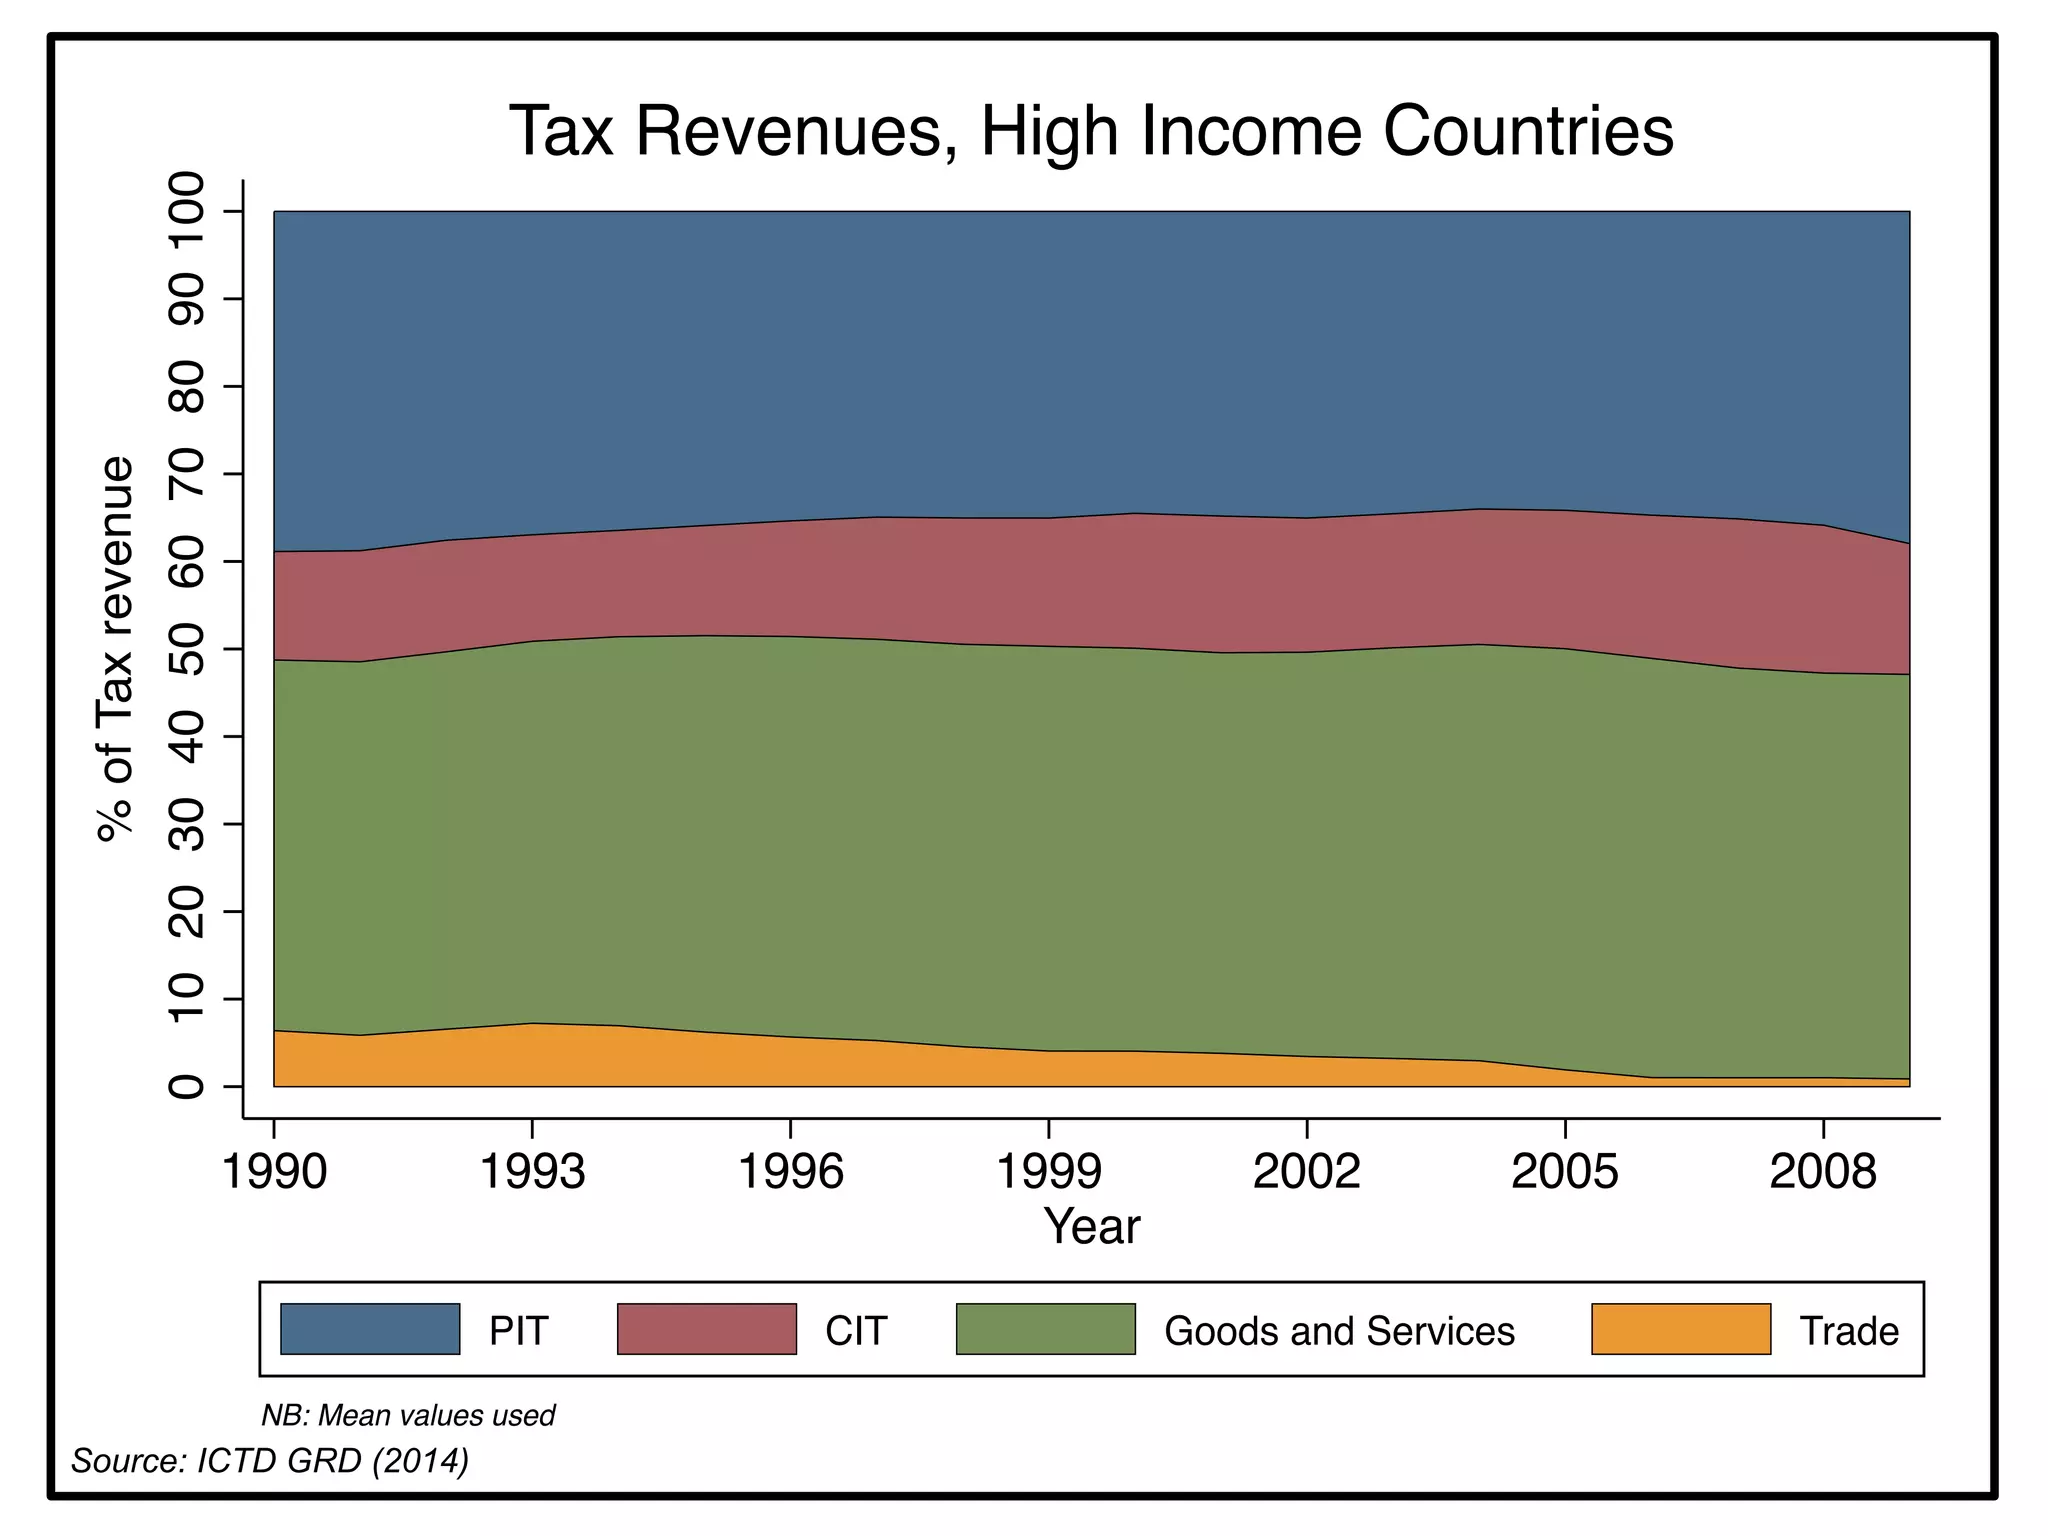
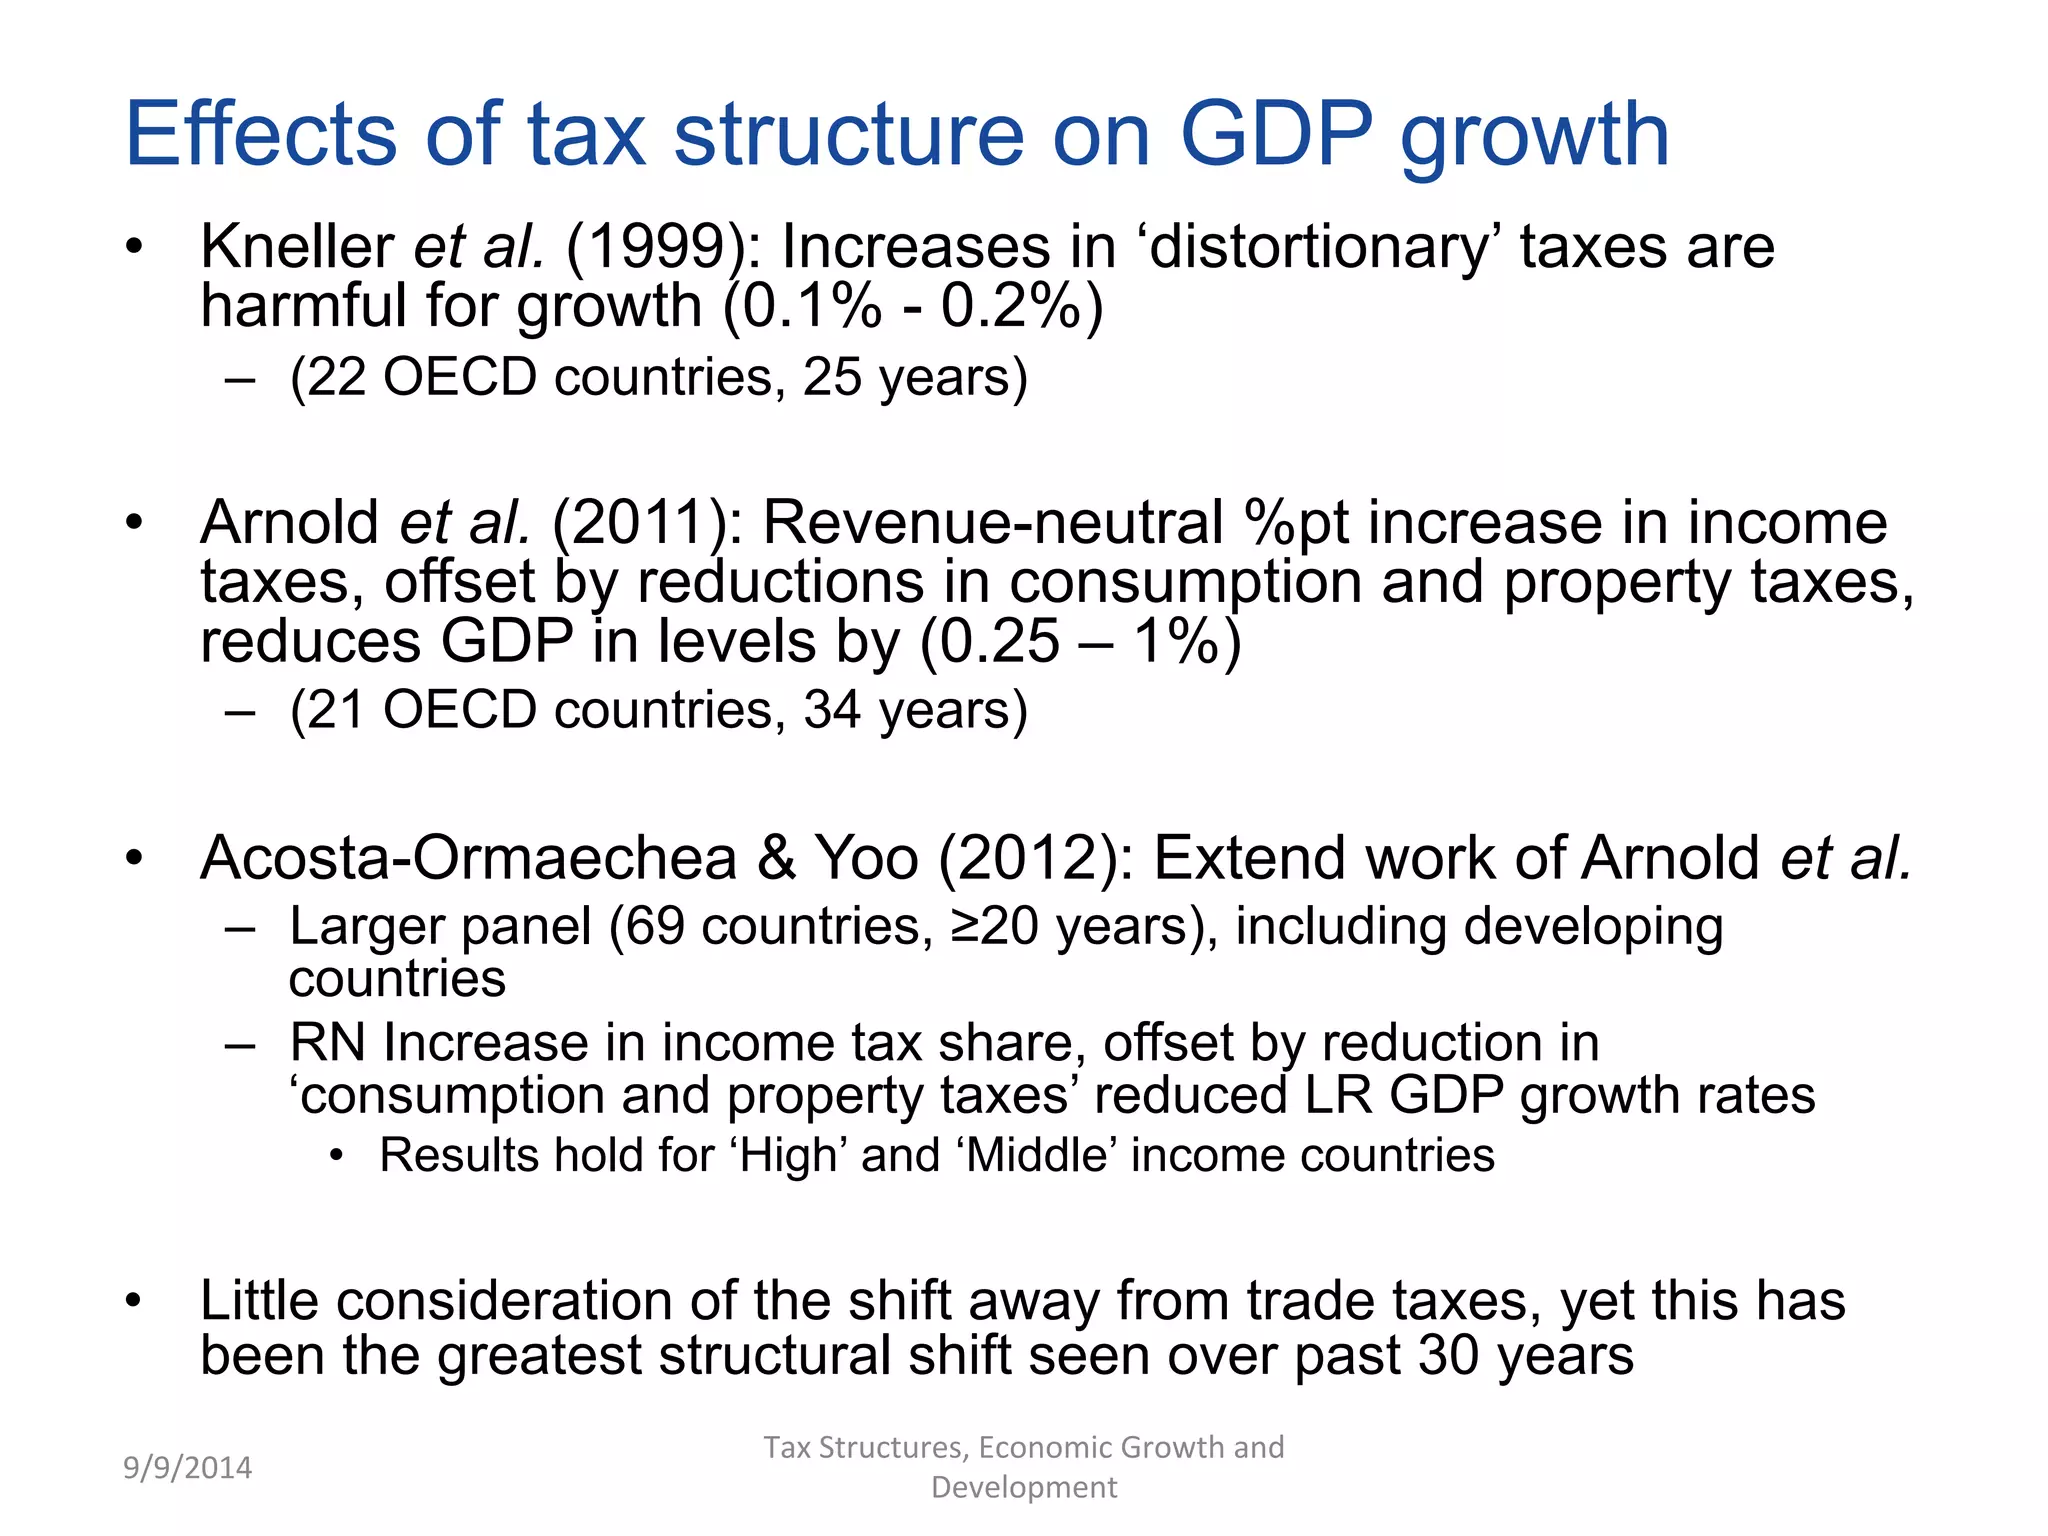
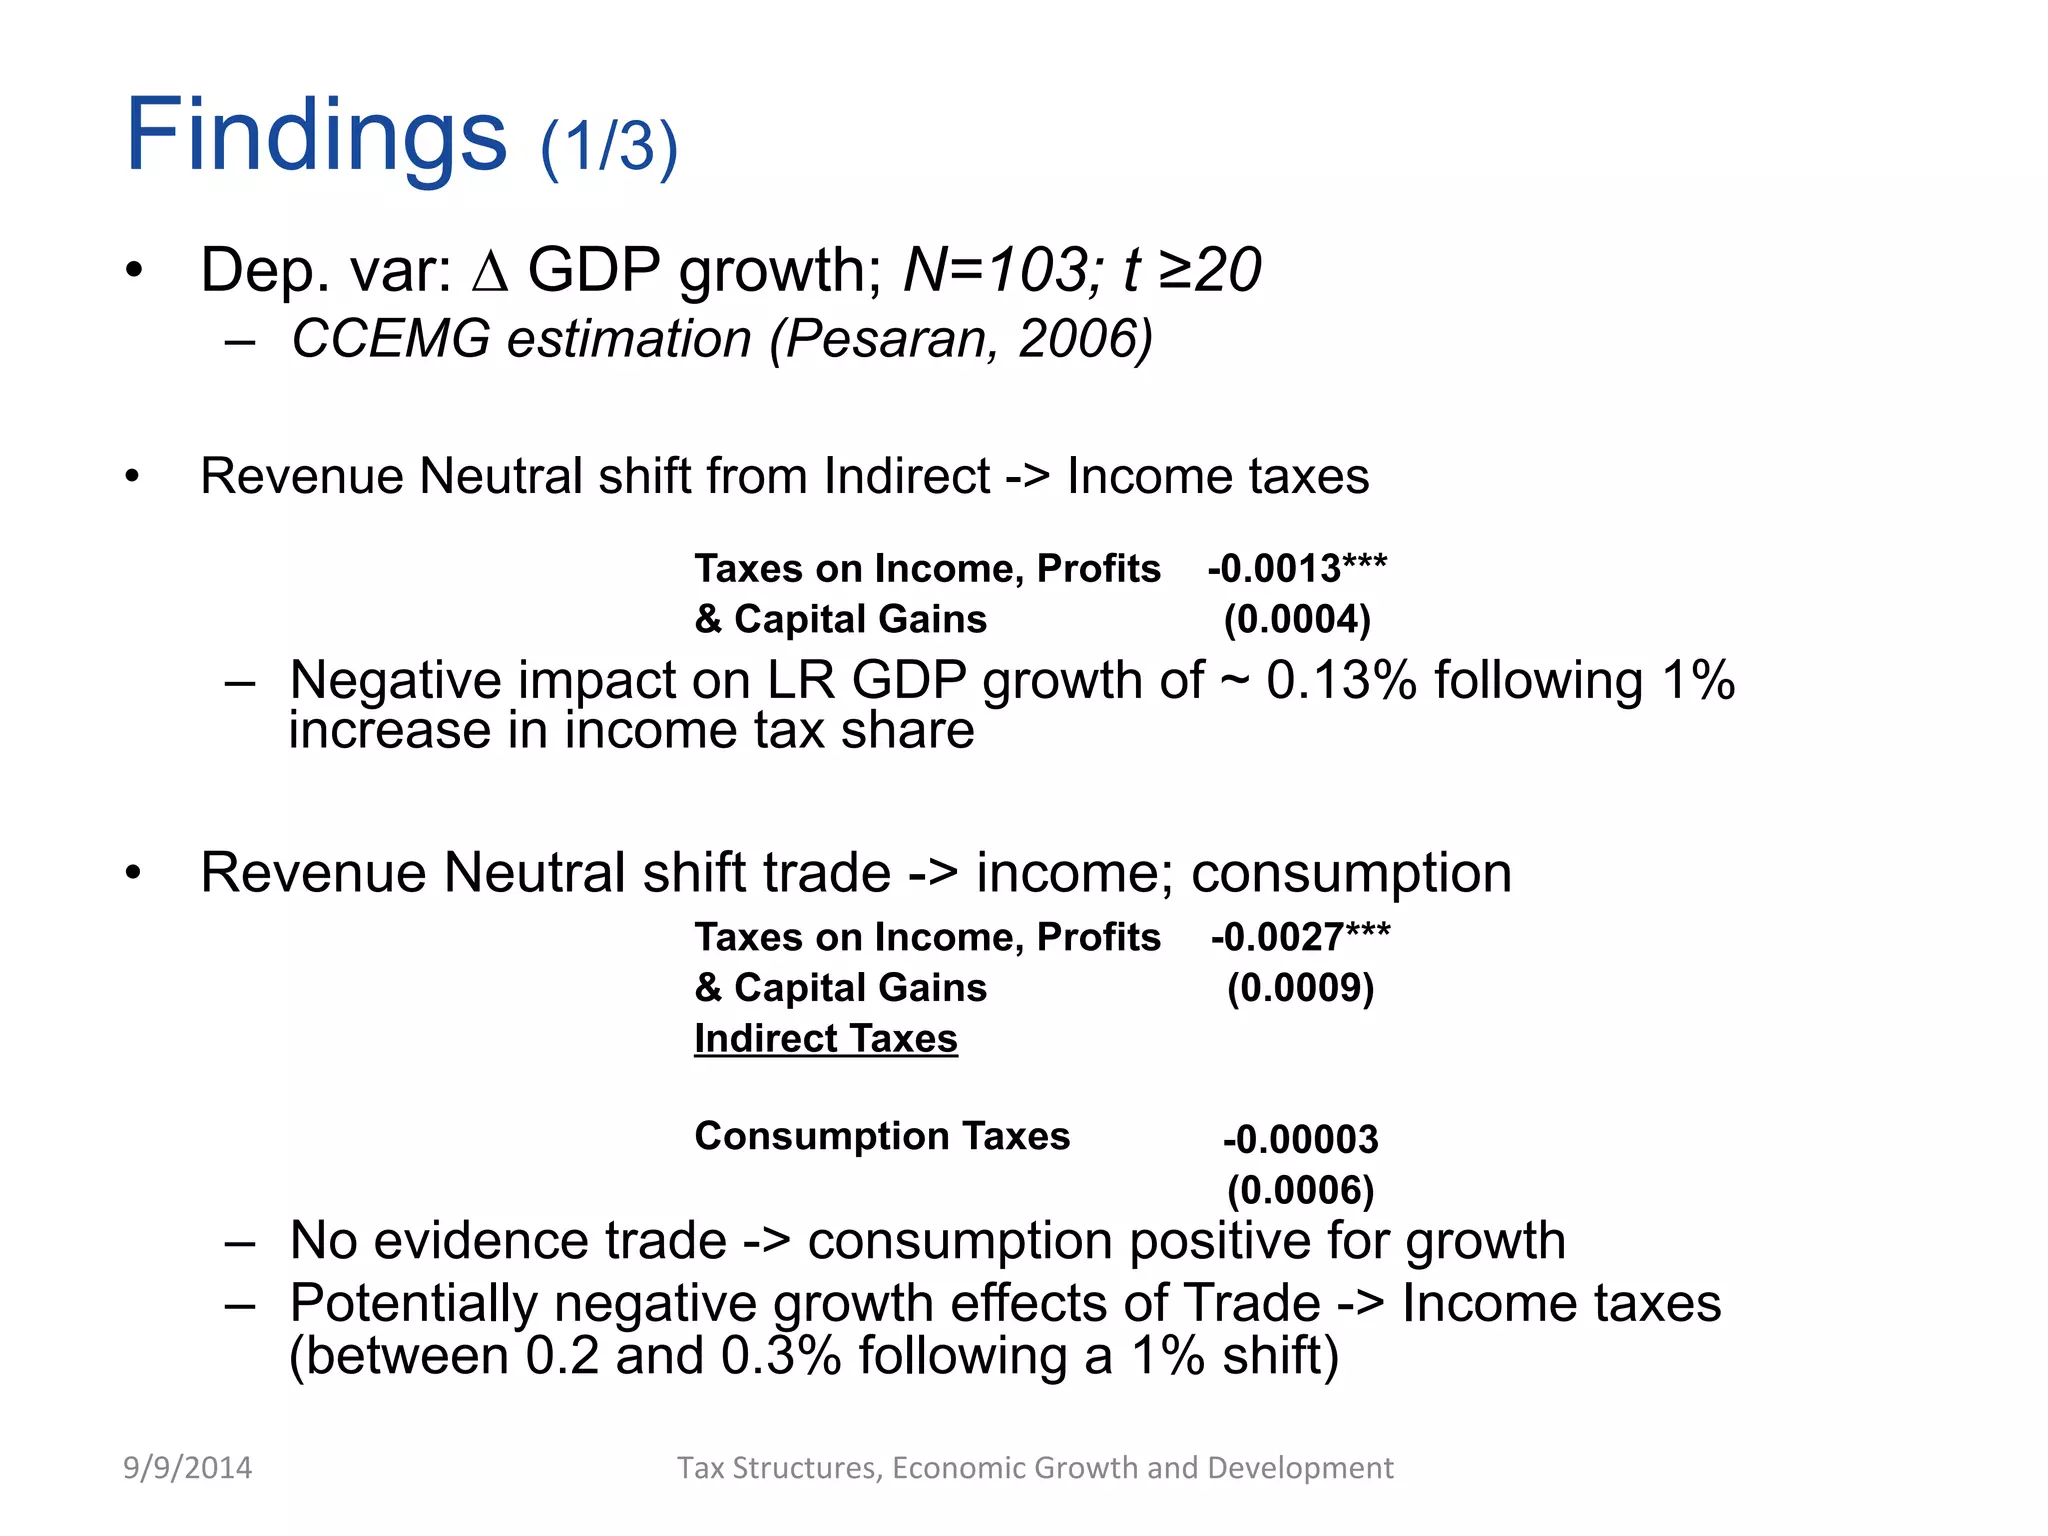
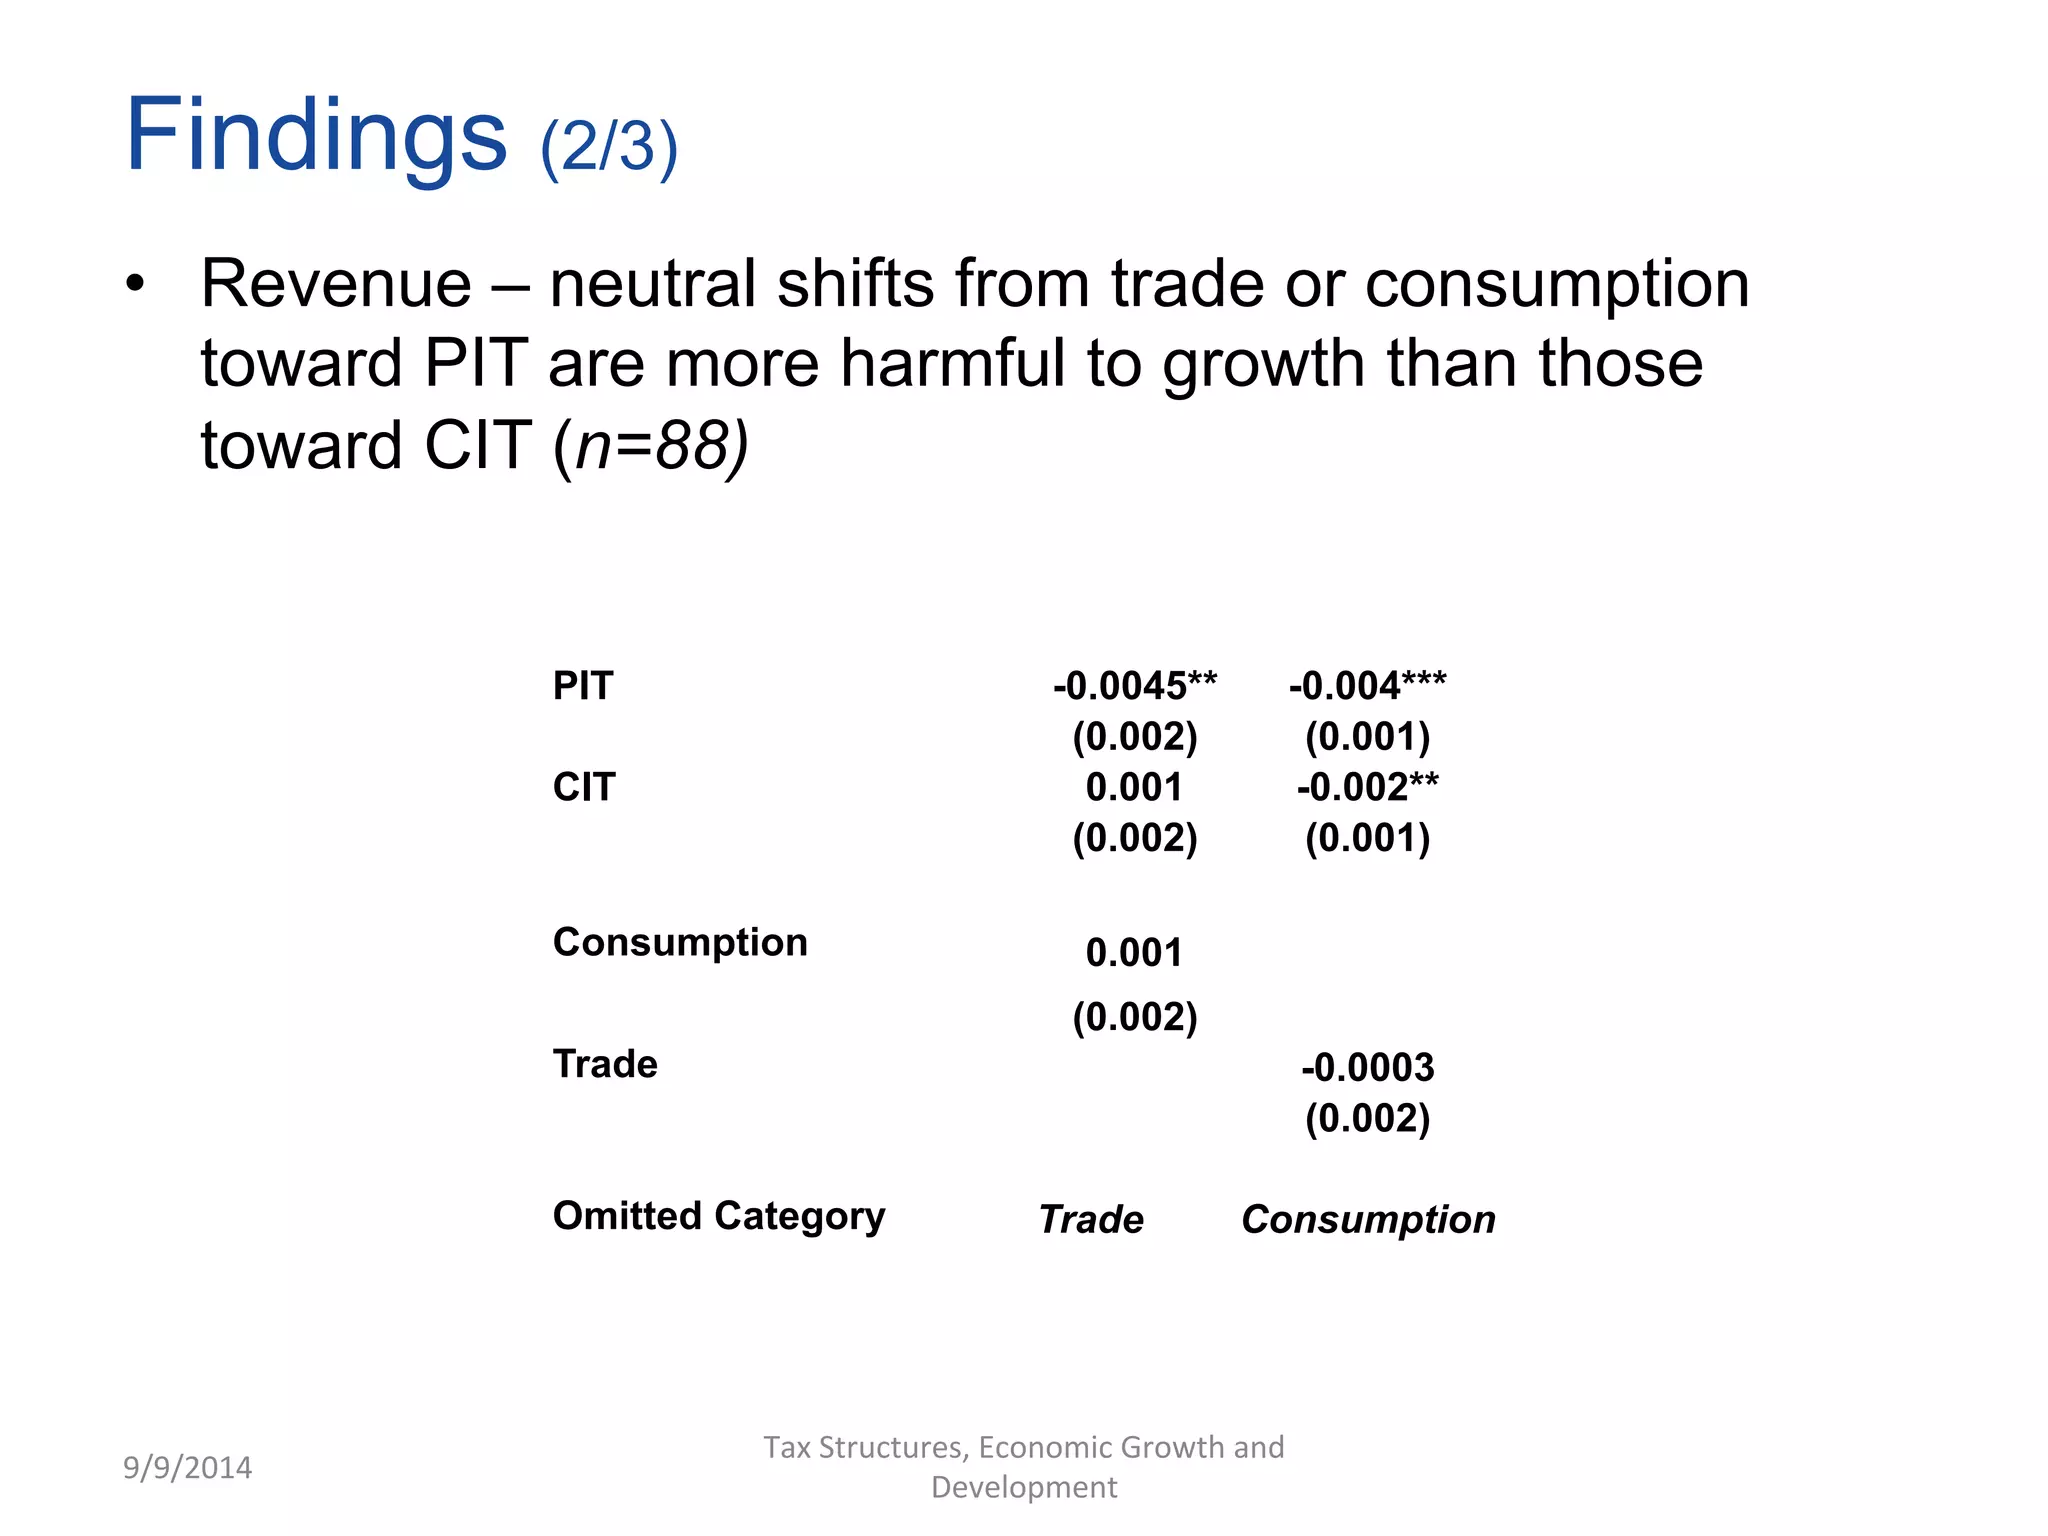
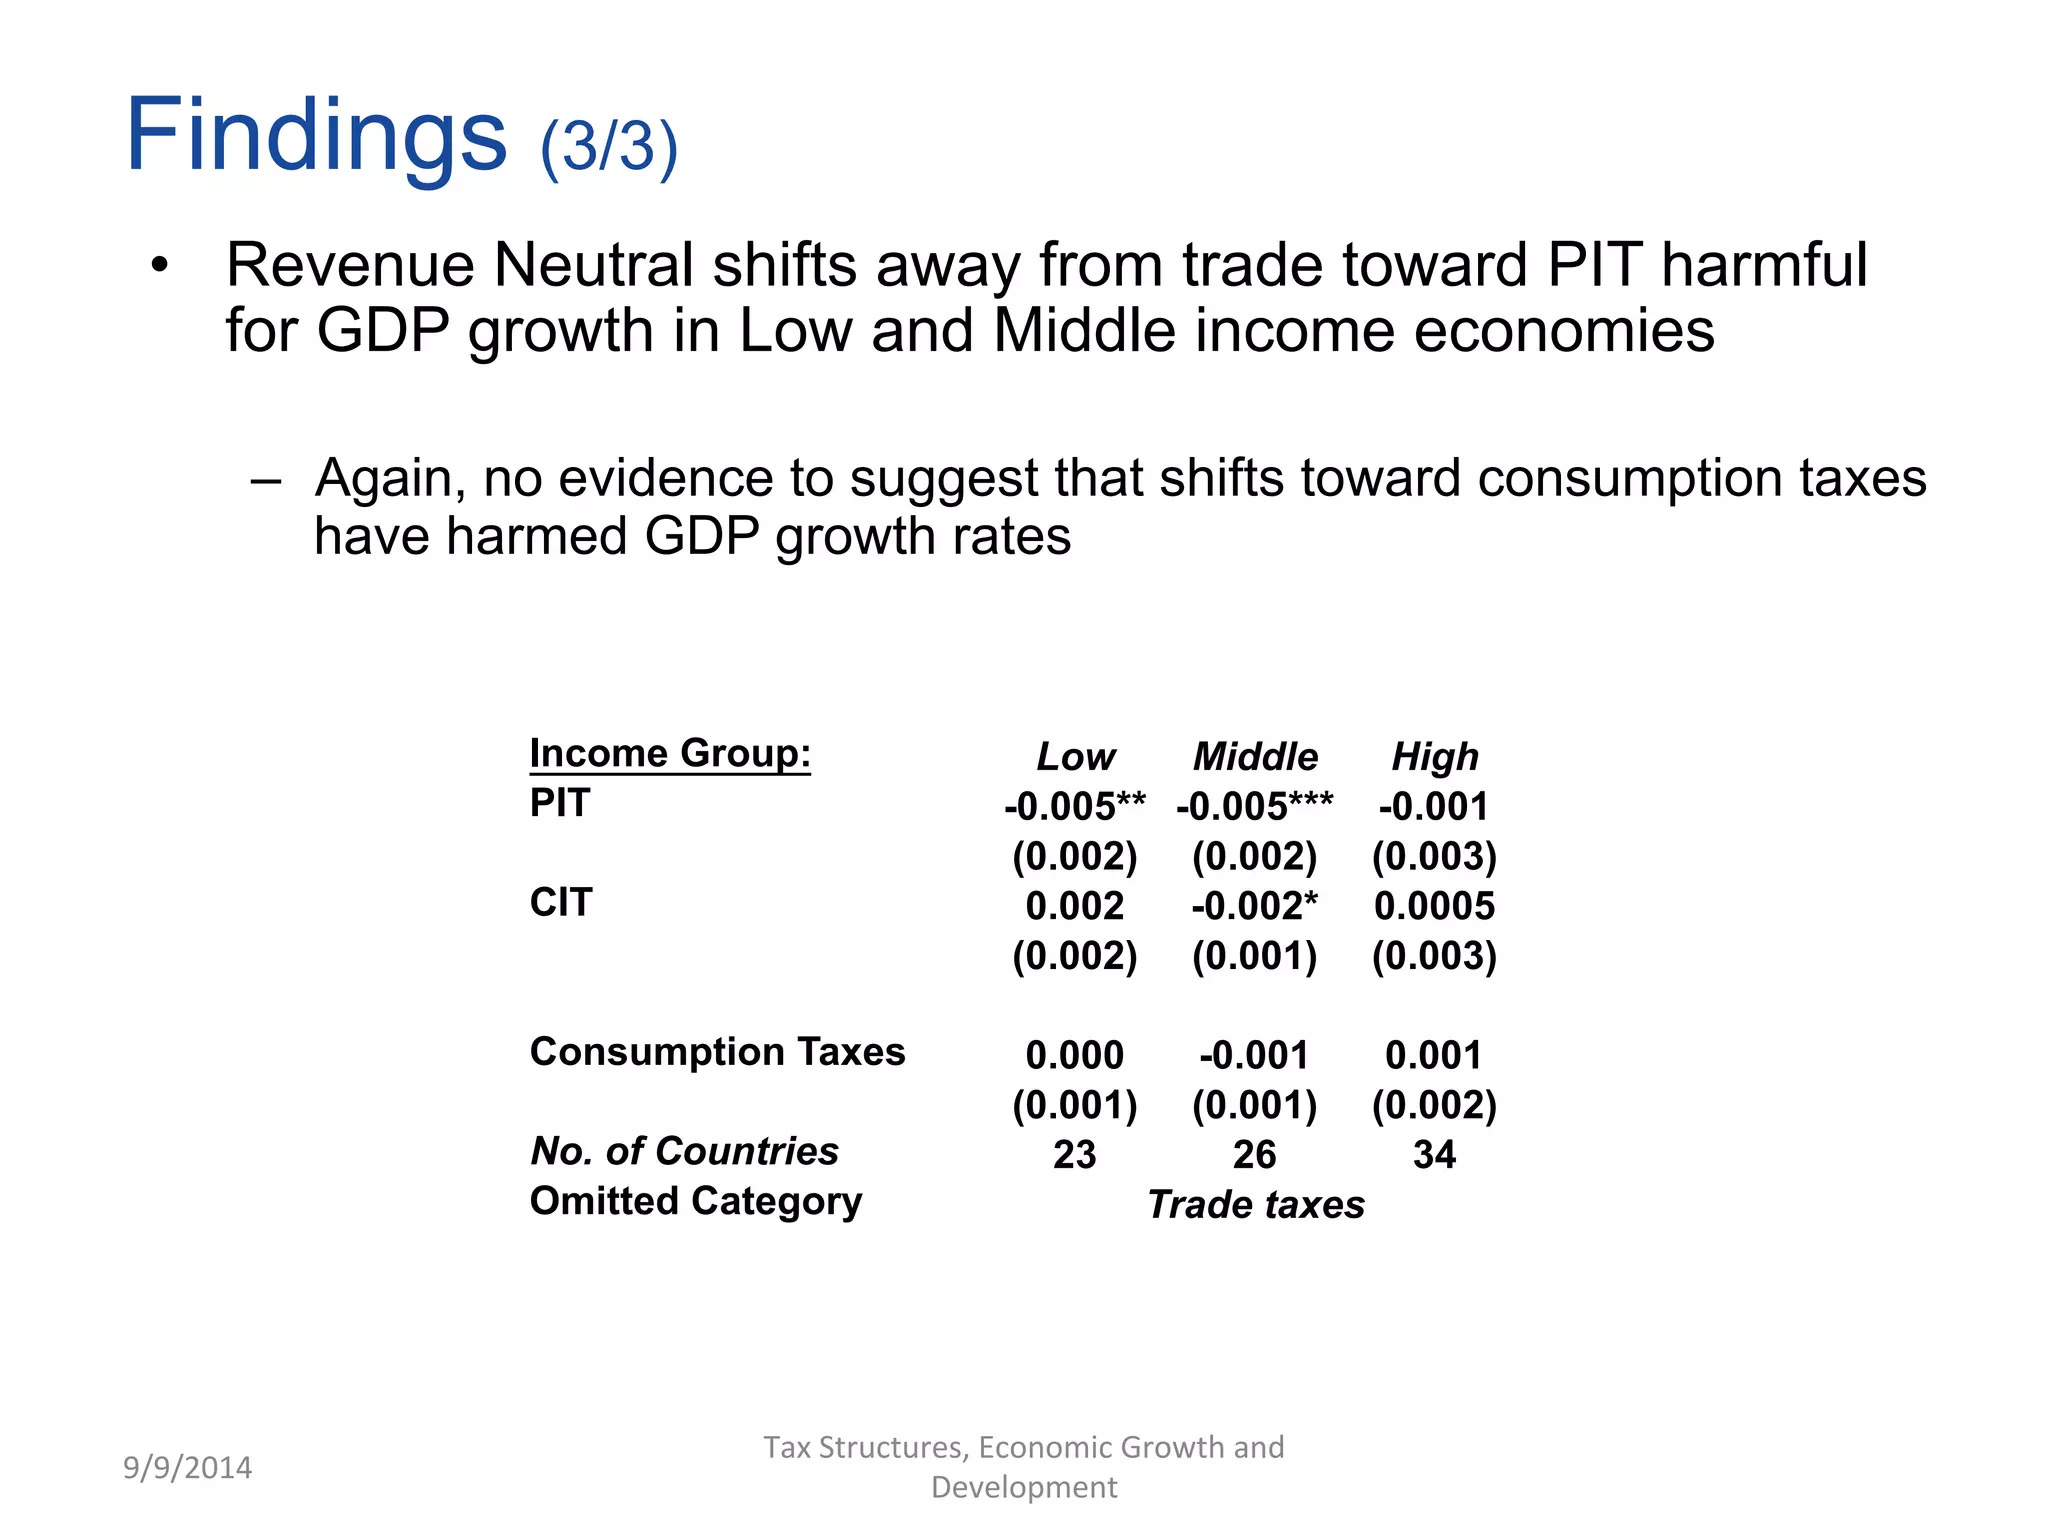
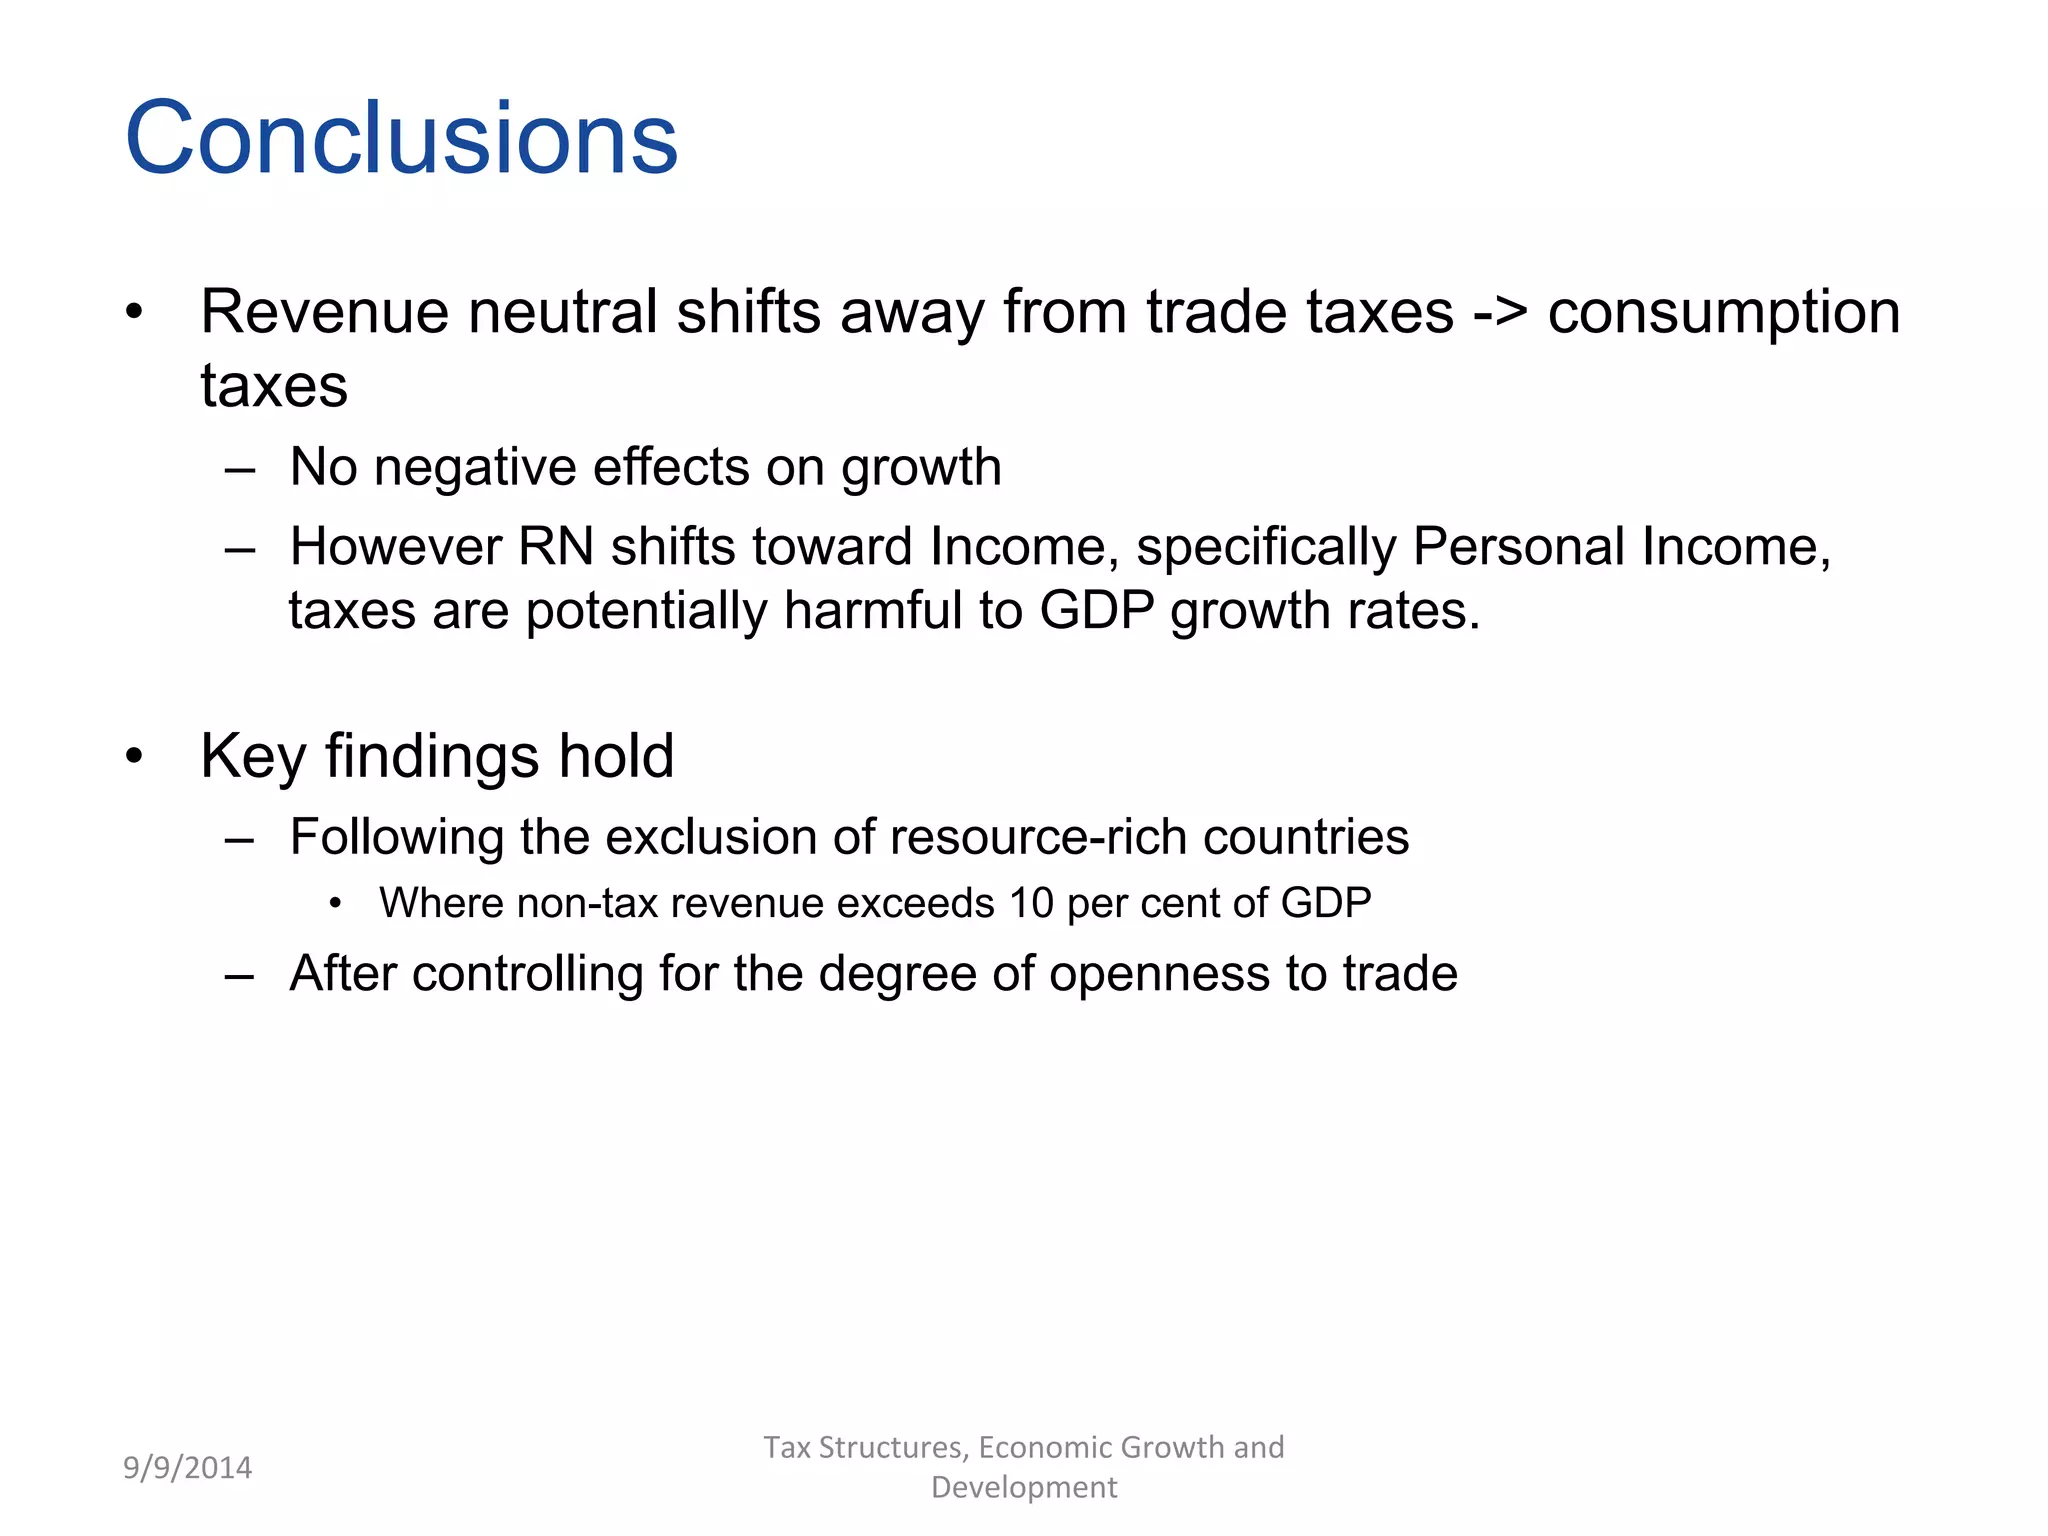
Tax Structures, 
Economic Growth and Development: 
ICTD working paper No. 22 
9 / 9 / 2014 
Kyle McNabb (km133@hw.ac.uk) 
& Philippe LeMay-Boucher 
Heriot-Watt University Edinburgh 
9/9/2014 
Tax 
Structures, 
Economic 
Growth 
and 
Development
Motivation (1/2) 
• Ongoing shift away from reliance on trade taxes toward 
consumption taxes such as the VAT 
– IMF “Policy Prescription” (IMF, 2011) 
• What are the implications of such structural shifts? 
– Baunsgaard & Keen (2010): Revenue recovery following 
liberalisation has been poor in low- and middle- income 
countries. 
– Effects on GDP growth rates are as yet unclear 
• GRD allows us to consider the effect revenue – neutral 
shifts in tax structure 
9/9/2014 
Tax 
Structures, 
Economic 
Growth 
and 
Development
Motivation (2/2) 
• The picture in low income / developing 
countries 
– Low tax ratio 
– Reliance on indirect taxes 
9/9/2014 
Tax 
Structures, 
Economic 
Growth 
and 
Development 
Tax/GDP (%) 
’80 - ’89 ’90 -’99 ’00 -’09 
Low-Income 13.4 11.7 13.7 
Middle-Income 13.7 14.2 15.9 
High-Income 23.2 22.6 23.5 
OECD 25.7 25.1 25.5 
Source: ICTD GRD (2014)
Trends in the data 
• Disaggregate tax components into shares of total 
revenue 
– Direct 
• Personal and Corporate income tax + Property tax 
– Indirect 
• Consumption 
• Trade 
• Divide countries into ‘Low’, ‘Middle’, ‘High’ income. 
• Figures 2 & 3: 1980-2009 
9/9/2014 
Tax 
Structures, 
Economic 
Growth 
and 
Development
0 10 20 30 40 50 60 70 80 90 100 
% of Tax revenue 
Tax Revenues, Low Income Countries 
35 - 40% 
45% 
1981 1985 1989 1993 1997 2001 2005 2009 
Year 
Direct Goods and Services Trade 
NB: Mean values used 
20% 
~33% 
Source: ICTD GRD (2014)
0 10 20 30 40 50 60 70 80 90 100 
% of Tax revenue 
Tax Revenues, Middle Income Countries 
30-35% 
1981 1985 1989 1993 1997 2001 2005 2009 
Year 
Direct Goods and Services Trade 
NB: Mean values used 
15% 
30-35% 
50% 
Source: ICTD GRD (2014)
0 10 20 30 40 50 60 70 80 90 100 
% of Tax revenue 
Tax Revenues, High Income Countries 
< 10 % 
1981 1985 1989 1993 1997 2001 2005 2009 
Year 
Direct Goods and Services Trade 
NB: Mean values used 
Source: ICTD GRD (2014)
0 10 20 30 40 50 60 70 80 90 100 
% of Tax revenue 
Tax Revenues, Low and Middle Income Countries 
1990 1993 1996 1999 2002 2005 2008 
Year 
PIT CIT Goods and Services Trade 
NB: Mean values used 
Source: ICTD GRD (2014)
0 10 20 30 40 50 60 70 80 90 100 
% of Tax revenue 
Tax Revenues, High Income Countries 
1990 1993 1996 1999 2002 2005 2008 
Year 
PIT CIT Goods and Services Trade 
NB: Mean values used 
Source: ICTD GRD (2014)
Effects of tax structure on GDP growth 
• Kneller et al. (1999): Increases in ‘distortionary’ taxes are 
harmful for growth (0.1% - 0.2%) 
– (22 OECD countries, 25 years) 
• Arnold et al. (2011): Revenue-neutral %pt increase in income 
taxes, offset by reductions in consumption and property taxes, 
reduces GDP in levels by (0.25 – 1%) 
– (21 OECD countries, 34 years) 
• Acosta-Ormaechea & Yoo (2012): Extend work of Arnold et al. 
– Larger panel (69 countries, ≥20 years), including developing 
countries 
– RN Increase in income tax share, offset by reduction in 
‘consumption and property taxes’ reduced LR GDP growth rates 
• Results hold for ‘High’ and ‘Middle’ income countries 
• Little consideration of the shift away from trade taxes, yet this has 
been the greatest structural shift seen over past 30 years 
9/9/2014 
Tax 
Structures, 
Economic 
Growth 
and 
Development
Findings (1/3) 
• Dep. var: Δ GDP growth; N=103; t ≥20 
– CCEMG estimation (Pesaran, 2006) 
• Revenue Neutral shift from Indirect -> Income taxes 
Taxes on Income, Profits -0.0013*** 
& Capital Gains (0.0004) 
– Negative impact on LR GDP growth of ~ 0.13% following 1% 
increase in income tax share 
• Revenue Neutral shift trade -> income; consumption 
Taxes on Income, Profits -0.0027*** 
& Capital Gains (0.0009) 
Indirect Taxes 
Consumption Taxes -0.00003 
(0.0006) 
– No evidence trade -> consumption positive for growth 
– Potentially negative growth effects of Trade -> Income taxes 
(between 0.2 and 0.3% following a 1% shift) 
9/9/2014 
Tax 
Structures, 
Economic 
Growth 
and 
Development
• Revenue – neutral shifts from trade or consumption 
toward PIT are more harmful to growth than those 
toward CIT (n=88) 
9/9/2014 
Tax 
Structures, 
Economic 
Growth 
and 
Development 
Findings (2/3) 
PIT -0.0045** -0.004*** 
(0.002) (0.001) 
CIT 0.001 -0.002** 
(0.002) (0.001) 
Consumption 0.001 
(0.002) 
Trade -0.0003 
(0.002) 
Omitted Category Trade Consumption
Findings (3/3) 
• Revenue Neutral shifts away from trade toward PIT harmful 
for GDP growth in Low and Middle income economies 
– Again, no evidence to suggest that shifts toward consumption taxes 
9/9/2014 
have harmed GDP growth rates 
Income Group: Low Middle High 
PIT -0.005** -0.005*** -0.001 
(0.002) (0.002) (0.003) 
CIT 0.002 -0.002* 0.0005 
(0.002) (0.001) (0.003) 
Consumption Taxes 0.000 -0.001 0.001 
(0.001) (0.001) (0.002) 
No. of Countries 23 26 34 
Omitted Category Trade taxes 
Tax 
Structures, 
Economic 
Growth 
and 
Development
Conclusions 
• Revenue neutral shifts away from trade taxes -> consumption 
taxes 
– No negative effects on growth 
– However RN shifts toward Income, specifically Personal Income, 
taxes are potentially harmful to GDP growth rates. 
• Key findings hold 
– Following the exclusion of resource-rich countries 
• Where non-tax revenue exceeds 10 per cent of GDP 
– After controlling for the degree of openness to trade 
9/9/2014 
Tax 
Structures, 
Economic 
Growth 
and 
Development
References 
• Acosta- Ormaechea, S.L.E, & Yoo, J (2012). ‘Tax Composition and Growth: A Broad 
Cross-Country Perspective’. No. 12-257. International Monetary Fund 
• Arnold, J. M., Brys, B., Heady, C., Johansson, Å., Schwellnus, C., & Vartia, L. (2011). 
‘Tax Policy for Economic Recovery and Growth’. The Economic Journal, 121(550), 
F59-F80. 
• Baunsgaard, T. and Keen, M. (2010) ‘Tax revenue and (or?) trade liberalization’, 
Journal of Public Economics 94(9): 563-577 
• IMF (2011), ‘Revenue Mobilization in Developing Countries’. International Monetary 
Fund. Available at http://www.imf.org/external/np/pp/eng/2011/030811.pdf, Accessed 
5/12/2013 
• Pesaran, M. H. (2006). Estimation and inference in large heterogeneous panels with 
a multifactor error structure. Econometrica, 74(4), 967-1012. 
• Tanzi, V., & Zee, H. H. (2000). Tax policy for emerging markets: developing countries. 
National tax journal, 299-322. 
9/9/2014 
Tax 
Structures, 
Economic 
Growth 
and 
Development

Tax structures, economic growth and development

  • 1.
    Tax Structures, EconomicGrowth and Development: ICTD working paper No. 22 9 / 9 / 2014 Kyle McNabb (km133@hw.ac.uk) & Philippe LeMay-Boucher Heriot-Watt University Edinburgh 9/9/2014 Tax Structures, Economic Growth and Development
  • 2.
    Motivation (1/2) •Ongoing shift away from reliance on trade taxes toward consumption taxes such as the VAT – IMF “Policy Prescription” (IMF, 2011) • What are the implications of such structural shifts? – Baunsgaard & Keen (2010): Revenue recovery following liberalisation has been poor in low- and middle- income countries. – Effects on GDP growth rates are as yet unclear • GRD allows us to consider the effect revenue – neutral shifts in tax structure 9/9/2014 Tax Structures, Economic Growth and Development
  • 3.
    Motivation (2/2) •The picture in low income / developing countries – Low tax ratio – Reliance on indirect taxes 9/9/2014 Tax Structures, Economic Growth and Development Tax/GDP (%) ’80 - ’89 ’90 -’99 ’00 -’09 Low-Income 13.4 11.7 13.7 Middle-Income 13.7 14.2 15.9 High-Income 23.2 22.6 23.5 OECD 25.7 25.1 25.5 Source: ICTD GRD (2014)
  • 4.
    Trends in thedata • Disaggregate tax components into shares of total revenue – Direct • Personal and Corporate income tax + Property tax – Indirect • Consumption • Trade • Divide countries into ‘Low’, ‘Middle’, ‘High’ income. • Figures 2 & 3: 1980-2009 9/9/2014 Tax Structures, Economic Growth and Development
  • 5.
    0 10 2030 40 50 60 70 80 90 100 % of Tax revenue Tax Revenues, Low Income Countries 35 - 40% 45% 1981 1985 1989 1993 1997 2001 2005 2009 Year Direct Goods and Services Trade NB: Mean values used 20% ~33% Source: ICTD GRD (2014)
  • 6.
    0 10 2030 40 50 60 70 80 90 100 % of Tax revenue Tax Revenues, Middle Income Countries 30-35% 1981 1985 1989 1993 1997 2001 2005 2009 Year Direct Goods and Services Trade NB: Mean values used 15% 30-35% 50% Source: ICTD GRD (2014)
  • 7.
    0 10 2030 40 50 60 70 80 90 100 % of Tax revenue Tax Revenues, High Income Countries < 10 % 1981 1985 1989 1993 1997 2001 2005 2009 Year Direct Goods and Services Trade NB: Mean values used Source: ICTD GRD (2014)
  • 8.
    0 10 2030 40 50 60 70 80 90 100 % of Tax revenue Tax Revenues, Low and Middle Income Countries 1990 1993 1996 1999 2002 2005 2008 Year PIT CIT Goods and Services Trade NB: Mean values used Source: ICTD GRD (2014)
  • 9.
    0 10 2030 40 50 60 70 80 90 100 % of Tax revenue Tax Revenues, High Income Countries 1990 1993 1996 1999 2002 2005 2008 Year PIT CIT Goods and Services Trade NB: Mean values used Source: ICTD GRD (2014)
  • 10.
    Effects of taxstructure on GDP growth • Kneller et al. (1999): Increases in ‘distortionary’ taxes are harmful for growth (0.1% - 0.2%) – (22 OECD countries, 25 years) • Arnold et al. (2011): Revenue-neutral %pt increase in income taxes, offset by reductions in consumption and property taxes, reduces GDP in levels by (0.25 – 1%) – (21 OECD countries, 34 years) • Acosta-Ormaechea & Yoo (2012): Extend work of Arnold et al. – Larger panel (69 countries, ≥20 years), including developing countries – RN Increase in income tax share, offset by reduction in ‘consumption and property taxes’ reduced LR GDP growth rates • Results hold for ‘High’ and ‘Middle’ income countries • Little consideration of the shift away from trade taxes, yet this has been the greatest structural shift seen over past 30 years 9/9/2014 Tax Structures, Economic Growth and Development
  • 11.
    Findings (1/3) •Dep. var: Δ GDP growth; N=103; t ≥20 – CCEMG estimation (Pesaran, 2006) • Revenue Neutral shift from Indirect -> Income taxes Taxes on Income, Profits -0.0013*** & Capital Gains (0.0004) – Negative impact on LR GDP growth of ~ 0.13% following 1% increase in income tax share • Revenue Neutral shift trade -> income; consumption Taxes on Income, Profits -0.0027*** & Capital Gains (0.0009) Indirect Taxes Consumption Taxes -0.00003 (0.0006) – No evidence trade -> consumption positive for growth – Potentially negative growth effects of Trade -> Income taxes (between 0.2 and 0.3% following a 1% shift) 9/9/2014 Tax Structures, Economic Growth and Development
  • 12.
    • Revenue –neutral shifts from trade or consumption toward PIT are more harmful to growth than those toward CIT (n=88) 9/9/2014 Tax Structures, Economic Growth and Development Findings (2/3) PIT -0.0045** -0.004*** (0.002) (0.001) CIT 0.001 -0.002** (0.002) (0.001) Consumption 0.001 (0.002) Trade -0.0003 (0.002) Omitted Category Trade Consumption
  • 13.
    Findings (3/3) •Revenue Neutral shifts away from trade toward PIT harmful for GDP growth in Low and Middle income economies – Again, no evidence to suggest that shifts toward consumption taxes 9/9/2014 have harmed GDP growth rates Income Group: Low Middle High PIT -0.005** -0.005*** -0.001 (0.002) (0.002) (0.003) CIT 0.002 -0.002* 0.0005 (0.002) (0.001) (0.003) Consumption Taxes 0.000 -0.001 0.001 (0.001) (0.001) (0.002) No. of Countries 23 26 34 Omitted Category Trade taxes Tax Structures, Economic Growth and Development
  • 14.
    Conclusions • Revenueneutral shifts away from trade taxes -> consumption taxes – No negative effects on growth – However RN shifts toward Income, specifically Personal Income, taxes are potentially harmful to GDP growth rates. • Key findings hold – Following the exclusion of resource-rich countries • Where non-tax revenue exceeds 10 per cent of GDP – After controlling for the degree of openness to trade 9/9/2014 Tax Structures, Economic Growth and Development
  • 15.
    References • Acosta-Ormaechea, S.L.E, & Yoo, J (2012). ‘Tax Composition and Growth: A Broad Cross-Country Perspective’. No. 12-257. International Monetary Fund • Arnold, J. M., Brys, B., Heady, C., Johansson, Å., Schwellnus, C., & Vartia, L. (2011). ‘Tax Policy for Economic Recovery and Growth’. The Economic Journal, 121(550), F59-F80. • Baunsgaard, T. and Keen, M. (2010) ‘Tax revenue and (or?) trade liberalization’, Journal of Public Economics 94(9): 563-577 • IMF (2011), ‘Revenue Mobilization in Developing Countries’. International Monetary Fund. Available at http://www.imf.org/external/np/pp/eng/2011/030811.pdf, Accessed 5/12/2013 • Pesaran, M. H. (2006). Estimation and inference in large heterogeneous panels with a multifactor error structure. Econometrica, 74(4), 967-1012. • Tanzi, V., & Zee, H. H. (2000). Tax policy for emerging markets: developing countries. National tax journal, 299-322. 9/9/2014 Tax Structures, Economic Growth and Development