Download to read offline
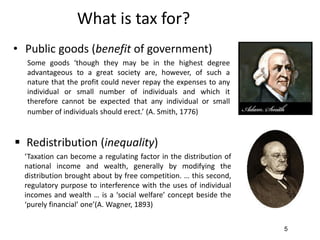

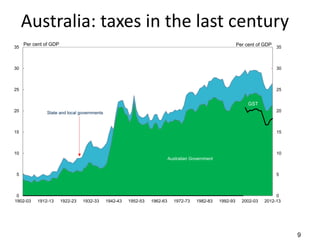

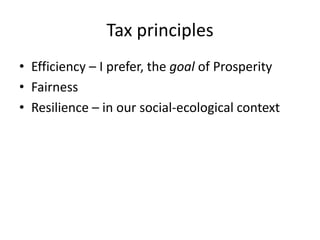


The document discusses the essential role of taxation in creating a prosperous society, highlighting its functions in providing public goods and redistributing wealth. It examines historical and contemporary perspectives on tax principles, including efficiency, fairness, and resilience, while analyzing various tax structures and trends in Australia. The document emphasizes the need for a stable and adaptive tax system to meet changing economic and social needs.


