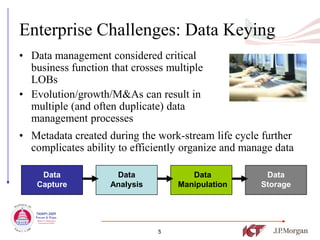
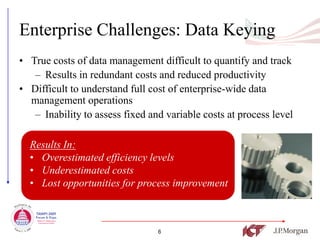
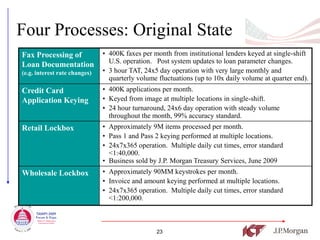
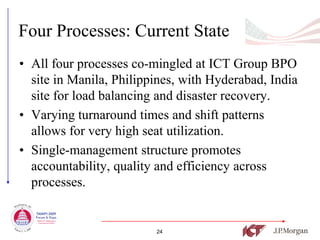
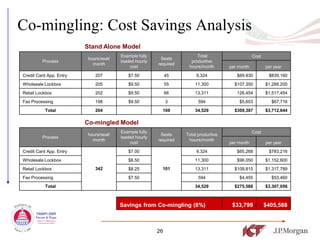
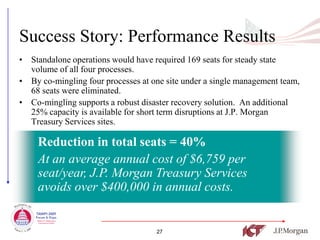
A Model for Optimizing Process
    Efficiency in a Multi-stream Data
           Keying Environment
                              Presented by:
         Arun Jain, SVP/GM, Data Management Services, ICT Group
Candice Blom, VP, National Wholesale Lockbox, J.P. Morgan Treasury Services
                Dan Hillman, VP, BPO Services, ICT Group


                                   1
Summary
• Data Keying Challenges
• Root Causes and Obstacles to Change
• Co-mingling – The Key to Optimizing Processes
• Identifying the Best Strategy for Your Organization
• Case Study – Data Keying Co-mingling at J.P.
  Morgan Treasury Services
• Question and Answer


                          2
ICT Group: Overview
• Leading global provider of outsourced
  customer care and related technology &
  business processing services
• $428.1 million revenue (2008)
   – Publicly traded (NASDAQ: ICTG)
• Deep vertical expertise
• 40+ onshore/near-shore/offshore centers,
  including India and the Philippines
• 18,000 employees worldwide
• ISO- and Six Sigma-guided operational best practices

                           3
Best Practices for BPO Projects
•   Rapid start-up and accelerated turn-around
•   Single domestic point-of-contact
•   Dedicated project management
•   Consistent, quality performance standards
•   Secure, redundant global IT/data network
•   Superior systems availability/uptime
                    Typical Outsourced Services:
    • Data entry/management            • Remittance processing
    • E-mail response management       • Loan Modification
    • Mailroom/Imaging                 • Claims/application processing


                                   4
Enterprise Challenges: Data Keying
• Data management considered critical
  business function that crosses multiple
  LOBs
• Evolution/growth/M&As can result in
  multiple (and often duplicate) data
  management processes
• Metadata created during the work-stream life cycle further
  complicates ability to efficiently organize and manage data

    Data             Data             Data            Data
   Capture          Analysis       Manipulation      Storage


                               5
Enterprise Challenges: Data Keying
• True costs of data management difficult to quantify and track
   – Results in redundant costs and reduced productivity
• Difficult to understand full cost of enterprise-wide data
  management operations
   – Inability to assess fixed and variable costs at process level

  Results In:
  • Overestimated efficiency levels
  • Underestimated costs
  • Lost opportunities for process improvement


                                 6
Data Keying Inefficiencies: Root Causes

• Similar or identical processes performed in multiple
  locations by separate management teams
• Decentralized processes tend to multiply over time:
• New products/services launched by multiple LOBs
• Varying turnaround times lead to over-segregation
  of duties and inefficient resource utilization


                          7
Obstacles to Change
 Stay out of        Different management structures (by different
                    LOB or geography) wish to maintain direct
 my sandbox.        control of data and its use.


 We don’t know      Without a top-down or cross-functional
                    inventory of data management processes,
 what we don’t      difficult to identify and leverage opportunities
     know.          for process improvements.


 We’ve always       Ad-hoc process evolution to meet dynamic
                    business rules leads to less effective ways of
done it this way.   doing work.


                              8
Process View of Back-Office Work


     Continuous         Batch Mode


                  9
The Ideal Scenario
  Goal: Utilize fewest workstations; maximize seat utilization
  rate (SUR)

 • Monitor overall SUR as key indicator of process efficiency
 Theoretical maximum monthly SUR = 585 hours (3 shifts, 7 day/week)
   • Continuous processes rarely effective due to staffing constraints and
      work availability limitations
 3 shift, 7 day/week operation SUR = 375 hours/month considered “best-in-
 class”
   • Difficult to achieve and sustain for a single process operation
   • Possible for some processes like lockbox and item processing that are
      amenable to co-mingling


                                     10
Co-mingling Work-streams Improves SUR
• SUR can increase significantly by integrating
  multiple work-streams into a single processing site.
• Fixed infrastructure costs can be leveraged across
  additional volumes, improving efficiency.

    Results:
    1. Total staffing requirements will decrease
    2. Added cost savings through:
        – Cross training
        – Reduced supervisory requirements


                                11
Developing Your Optimization/
Co-mingling Strategy


                   Analyze the                    Document
   Assess the                      Evaluate
                   Processes in                   Expected
   Current State                   Alternatives
                   Detail                         Results


                              12
Assess the
  Current State     Gap Analysis
                     Document
                                                             Develop              Refine
Pre-workshop         Current and
                                        Assess Gaps        Roadmap And         Recommended
Scope Review        Desired Future
                                                           Business Case         Solution
                        State

                                                                                 Define New
                                                            Identify Quick
 Clarify Business      Document          Identify Gaps                          Governance and
                                                            Wins and Long
      Scope           Current State        and Risks                              Operating
                                                            Term Initiatives
                                                                                   Models


                     Identify Current                       Create Business        Prepare
     Develop                                Define
                      Processes and                              Case           Migration Plan
 Participant List                       Opportunities to
                     Future Business                        Implementation       for Future
 and Project Plan                        Bridge Gaps
                          Needs                                Roadmap             Process


                                              13
Analyze the
  Processes in
  Detail         Analyze the Processes
• Once candidate processes are identified from
  gap analysis:
  – Review existing and proposed process flows,
  – Review quality and productivity goals, and
  – Analyze options and alternate operating models.


                           14
Analyze the
Processes in
Detail           Analyze the Processes

  Document existing and proposed process flows
               (Document all touch points with adjacent processes)


In                   3                  4                  7         Out


1                    2                  5                  6

                                        15
Analyze the
    Processes in
    Detail         Analyze the Processes
     Analyze options and alternate operating models

•   Centralized Processing?
•   Decentralized Processing?
•   Review potential technology constraints
•   Calculate seat requirements to maximize utilization


                              16
Analyze the
Processes in
Detail         Analyze the Processes
          Review cost, quality and output goals
                (Identify potential conflicts and tensions)


               Quality            Cost          Output


                                         17
Evaluate
    Alternatives
                   Evaluate Alternatives

• What other frictional costs will impact alternatives?
• Identify organizational impacts
• Prepare change management plan
• Alert stakeholders and develop new governance
  model
• Create implementation plan the selected optimal
  solution


                             18
Document
 Expected
 Results    Document Expected Results
• Baseline current fully loaded fixed and
  variable costs as well as projected cost savings
  from proposed solution.
• Plan for annual post-assessment/analysis after
  reaching steady state.
• Plan for year over year productivity
  improvement.


                        19
J.P. Morgan Overview:
• Global financial services firm with assets of $2.1 trillion
  and operations in more than 60 countries.
• Leader in investment banking, financial services for
  consumers, small business and commercial banking,
  financial transaction processing, asset management, and
  private equity.
• The Treasury Services business has more than 50,000
  clients, a presence in 39 countries, and is one of the
  world’s largest providers of treasury management
  services.


                              20
J.P. Morgan Receivables
Operations
• Originator of the first lockbox – offering the service for 60+ years, J.P.
  Morgan maintains one of the most extensive lockbox networks today
  anywhere in the world.
• Offers Receivables Edge that allow clients to consolidate all accounts
  receivable transaction data and images into a single, secure repository,
  that’s accessible 24/7 via the internet, which helps expedite exception
  resolution and improve straight-through processing.
• Receivables operations has an extensive geographic presence, with
  processing facilities in 16 sites domestically and 3 sites globally,
  representing 4,000 employees.
• Wholesale lockbox business process more than 162 million payments and 2
  trillion keystrokes annually, representing value in excess of $833 billion.
• ICT performs data key for 36% of Wholesale Lockbox volume.


                                     21
Data Keying Optimization Success Story
J.P. Morgan Treasury and Security Services
 Overview:
  Four complimentary processes consolidated from multiple sites into
  single co-mingled work-stream


 Processes owned by different LOBs


 Current seat utilization approximately = 340 hours/seat/month


                                     22
Four Processes: Original State
Fax Processing of              • 400K faxes per month from institutional lenders keyed at single-shift
                                 U.S. operation. Post system updates to loan parameter changes.
Loan Documentation
(e.g. interest rate changes)   • 3 hour TAT, 24x5 day operation with very large monthly and
                                 quarterly volume fluctuations (up to 10x daily volume at quarter end).
Credit Card                    • 400K applications per month.
Application Keying             • Keyed from image at multiple locations in single-shift.
                               • 24 hour turnaround, 24x6 day operation with steady volume
                                 throughout the month, 99% accuracy standard.
Retail Lockbox                 • Approximately 9M items processed per month.
                               • Pass 1 and Pass 2 keying performed at multiple locations.
                               • 24x7x365 operation. Multiple daily cut times, error standard
                                 <1:40,000.
                               • Business sold by J.P. Morgan Treasury Services, June 2009
Wholesale Lockbox              • Approximately 90MM keystrokes per month.
                               • Invoice and amount keying performed at multiple locations.
                               • 24x7x365 operation. Multiple daily cut times, error standard
                                 <1:200,000.


                                                 23
Four Processes: Current State
• All four processes co-mingled at ICT Group BPO
  site in Manila, Philippines, with Hyderabad, India
  site for load balancing and disaster recovery.
• Varying turnaround times and shift patterns
  allows for very high seat utilization.
• Single-management structure promotes
  accountability, quality and efficiency across
  processes.


                         24
Seat Optimization Model
                       180


                       160                                                168 seats
                                                                          required with no
                                                                          co-mingling
                       140
Total Seats Required


                       120

                                                                                             Data entry
                       100                                                                   Standalone Total
                             5,000 hrs per month unused capacity
                                                                                             Spare WLBX
                        80                                                                   WLBX
                                                                                             Spare RLBX
                        60                                                                   RLBX
                                              Application                                    Fax
                                              Data Entry
                        40


                                            WLBX
                        20                                              RLBX

                                                                                             Fax
                         0


                                   Local Time Manila, Philippines

                                                                   25
Co-mingling: Cost Savings Analysis
                         Stand Alone Model
                                       Example fully                   Total                     Cost
                         hours/seat/                    Seats
         Process                       loaded hourly                productive
                           month                       required
                                           cost                    hours/month       per month          per year
Credit Card App. Entry      207           $7.50             45         9,324            $69,930          $839,160
Wholesale Lockbox           205           $9.50             55        11,300           $107,350         $1,288,200
Retail Lockbox              202           $9.50             66        13,311            126,454         $1,517,454
Fax Processing              198           $9.50             3           594              $5,653            $67,716
           Total            204                          169          34,529           $309,387         $3,712,644

                         Co-mingled Model
                                       Example fully                                             Cost
                         hours/seat/                    Seats     Total productive
         Process                       loaded hourly
                           month                       required    hours/month
                                           cost                                      per month          per year
Credit Card App. Entry                    $7.00                        9,324            $65,268          $783,216
Wholesale Lockbox                         $8.50                       11,300            $96,050         $1,152,600
Retail Lockbox              342           $8.25          101          13,311           $109,815         $1,317,789
Fax Processing                            $7.50                         594              $4,455            $53,460
           Total                                                      34,529           $275,588         $3,307,056


                                       Savings from Co-mingling (8%)                  $33,799           $405,588


                                                       26
Success Story: Performance Results
• Standalone operations would have required 169 seats for steady state
  volume of all four processes.
• By co-mingling four processes at one site under a single management team,
  68 seats were eliminated.
• Co-mingling supports a robust disaster recovery solution. An additional
  25% capacity is available for short term disruptions at J.P. Morgan
  Treasury Services sites.

    Reduction in total seats = 40%
    At an average annual cost of $6,759 per
    seat/year, J.P. Morgan Treasury Services
    avoids over $400,000 in annual costs.


                                    27
Question & Answer


             Arun Jain                             Candice Blom
  SVP/GM, Data Management Services,
             ICT Group                       VP, National Wholesale Lockbox
                                              J.P. Morgan Treasury Services
           Dan Hillman
     VP, BPO Services, ICT Group
                                                  312-336-2829
           800-201-1085                    candice.blom@jpmchase.com
        info@ictgroup.com                      www.jpmchase.com
         www.ictgroup.com


                                      28

Outsourcing Best Practices - Process Efficiency

  • 1.
    A Model forOptimizing Process Efficiency in a Multi-stream Data Keying Environment Presented by: Arun Jain, SVP/GM, Data Management Services, ICT Group Candice Blom, VP, National Wholesale Lockbox, J.P. Morgan Treasury Services Dan Hillman, VP, BPO Services, ICT Group 1
  • 2.
    Summary • Data KeyingChallenges • Root Causes and Obstacles to Change • Co-mingling – The Key to Optimizing Processes • Identifying the Best Strategy for Your Organization • Case Study – Data Keying Co-mingling at J.P. Morgan Treasury Services • Question and Answer 2
  • 3.
    ICT Group: Overview •Leading global provider of outsourced customer care and related technology & business processing services • $428.1 million revenue (2008) – Publicly traded (NASDAQ: ICTG) • Deep vertical expertise • 40+ onshore/near-shore/offshore centers, including India and the Philippines • 18,000 employees worldwide • ISO- and Six Sigma-guided operational best practices 3
  • 4.
    Best Practices forBPO Projects • Rapid start-up and accelerated turn-around • Single domestic point-of-contact • Dedicated project management • Consistent, quality performance standards • Secure, redundant global IT/data network • Superior systems availability/uptime Typical Outsourced Services: • Data entry/management • Remittance processing • E-mail response management • Loan Modification • Mailroom/Imaging • Claims/application processing 4
  • 5.
    Enterprise Challenges: DataKeying • Data management considered critical business function that crosses multiple LOBs • Evolution/growth/M&As can result in multiple (and often duplicate) data management processes • Metadata created during the work-stream life cycle further complicates ability to efficiently organize and manage data Data Data Data Data Capture Analysis Manipulation Storage 5
  • 6.
    Enterprise Challenges: DataKeying • True costs of data management difficult to quantify and track – Results in redundant costs and reduced productivity • Difficult to understand full cost of enterprise-wide data management operations – Inability to assess fixed and variable costs at process level Results In: • Overestimated efficiency levels • Underestimated costs • Lost opportunities for process improvement 6
  • 7.
    Data Keying Inefficiencies:Root Causes • Similar or identical processes performed in multiple locations by separate management teams • Decentralized processes tend to multiply over time: • New products/services launched by multiple LOBs • Varying turnaround times lead to over-segregation of duties and inefficient resource utilization 7
  • 8.
    Obstacles to Change Stay out of Different management structures (by different LOB or geography) wish to maintain direct my sandbox. control of data and its use. We don’t know Without a top-down or cross-functional inventory of data management processes, what we don’t difficult to identify and leverage opportunities know. for process improvements. We’ve always Ad-hoc process evolution to meet dynamic business rules leads to less effective ways of done it this way. doing work. 8
  • 9.
    Process View ofBack-Office Work Continuous Batch Mode 9
  • 10.
    The Ideal Scenario Goal: Utilize fewest workstations; maximize seat utilization rate (SUR) • Monitor overall SUR as key indicator of process efficiency Theoretical maximum monthly SUR = 585 hours (3 shifts, 7 day/week) • Continuous processes rarely effective due to staffing constraints and work availability limitations 3 shift, 7 day/week operation SUR = 375 hours/month considered “best-in- class” • Difficult to achieve and sustain for a single process operation • Possible for some processes like lockbox and item processing that are amenable to co-mingling 10
  • 11.
    Co-mingling Work-streams ImprovesSUR • SUR can increase significantly by integrating multiple work-streams into a single processing site. • Fixed infrastructure costs can be leveraged across additional volumes, improving efficiency. Results: 1. Total staffing requirements will decrease 2. Added cost savings through: – Cross training – Reduced supervisory requirements 11
  • 12.
    Developing Your Optimization/ Co-minglingStrategy Analyze the Document Assess the Evaluate Processes in Expected Current State Alternatives Detail Results 12
  • 13.
    Assess the Current State Gap Analysis Document Develop Refine Pre-workshop Current and Assess Gaps Roadmap And Recommended Scope Review Desired Future Business Case Solution State Define New Identify Quick Clarify Business Document Identify Gaps Governance and Wins and Long Scope Current State and Risks Operating Term Initiatives Models Identify Current Create Business Prepare Develop Define Processes and Case Migration Plan Participant List Opportunities to Future Business Implementation for Future and Project Plan Bridge Gaps Needs Roadmap Process 13
  • 14.
    Analyze the Processes in Detail Analyze the Processes • Once candidate processes are identified from gap analysis: – Review existing and proposed process flows, – Review quality and productivity goals, and – Analyze options and alternate operating models. 14
  • 15.
    Analyze the Processes in Detail Analyze the Processes Document existing and proposed process flows (Document all touch points with adjacent processes) In 3 4 7 Out 1 2 5 6 15
  • 16.
    Analyze the Processes in Detail Analyze the Processes Analyze options and alternate operating models • Centralized Processing? • Decentralized Processing? • Review potential technology constraints • Calculate seat requirements to maximize utilization 16
  • 17.
    Analyze the Processes in Detail Analyze the Processes Review cost, quality and output goals (Identify potential conflicts and tensions) Quality Cost Output 17
  • 18.
    Evaluate Alternatives Evaluate Alternatives • What other frictional costs will impact alternatives? • Identify organizational impacts • Prepare change management plan • Alert stakeholders and develop new governance model • Create implementation plan the selected optimal solution 18
  • 19.
    Document Expected Results Document Expected Results • Baseline current fully loaded fixed and variable costs as well as projected cost savings from proposed solution. • Plan for annual post-assessment/analysis after reaching steady state. • Plan for year over year productivity improvement. 19
  • 20.
    J.P. Morgan Overview: •Global financial services firm with assets of $2.1 trillion and operations in more than 60 countries. • Leader in investment banking, financial services for consumers, small business and commercial banking, financial transaction processing, asset management, and private equity. • The Treasury Services business has more than 50,000 clients, a presence in 39 countries, and is one of the world’s largest providers of treasury management services. 20
  • 21.
    J.P. Morgan Receivables Operations •Originator of the first lockbox – offering the service for 60+ years, J.P. Morgan maintains one of the most extensive lockbox networks today anywhere in the world. • Offers Receivables Edge that allow clients to consolidate all accounts receivable transaction data and images into a single, secure repository, that’s accessible 24/7 via the internet, which helps expedite exception resolution and improve straight-through processing. • Receivables operations has an extensive geographic presence, with processing facilities in 16 sites domestically and 3 sites globally, representing 4,000 employees. • Wholesale lockbox business process more than 162 million payments and 2 trillion keystrokes annually, representing value in excess of $833 billion. • ICT performs data key for 36% of Wholesale Lockbox volume. 21
  • 22.
    Data Keying OptimizationSuccess Story J.P. Morgan Treasury and Security Services Overview: Four complimentary processes consolidated from multiple sites into single co-mingled work-stream Processes owned by different LOBs Current seat utilization approximately = 340 hours/seat/month 22
  • 23.
    Four Processes: OriginalState Fax Processing of • 400K faxes per month from institutional lenders keyed at single-shift U.S. operation. Post system updates to loan parameter changes. Loan Documentation (e.g. interest rate changes) • 3 hour TAT, 24x5 day operation with very large monthly and quarterly volume fluctuations (up to 10x daily volume at quarter end). Credit Card • 400K applications per month. Application Keying • Keyed from image at multiple locations in single-shift. • 24 hour turnaround, 24x6 day operation with steady volume throughout the month, 99% accuracy standard. Retail Lockbox • Approximately 9M items processed per month. • Pass 1 and Pass 2 keying performed at multiple locations. • 24x7x365 operation. Multiple daily cut times, error standard <1:40,000. • Business sold by J.P. Morgan Treasury Services, June 2009 Wholesale Lockbox • Approximately 90MM keystrokes per month. • Invoice and amount keying performed at multiple locations. • 24x7x365 operation. Multiple daily cut times, error standard <1:200,000. 23
  • 24.
    Four Processes: CurrentState • All four processes co-mingled at ICT Group BPO site in Manila, Philippines, with Hyderabad, India site for load balancing and disaster recovery. • Varying turnaround times and shift patterns allows for very high seat utilization. • Single-management structure promotes accountability, quality and efficiency across processes. 24
  • 25.
    Seat Optimization Model 180 160 168 seats required with no co-mingling 140 Total Seats Required 120 Data entry 100 Standalone Total 5,000 hrs per month unused capacity Spare WLBX 80 WLBX Spare RLBX 60 RLBX Application Fax Data Entry 40 WLBX 20 RLBX Fax 0 Local Time Manila, Philippines 25
  • 26.
    Co-mingling: Cost SavingsAnalysis Stand Alone Model Example fully Total Cost hours/seat/ Seats Process loaded hourly productive month required cost hours/month per month per year Credit Card App. Entry 207 $7.50 45 9,324 $69,930 $839,160 Wholesale Lockbox 205 $9.50 55 11,300 $107,350 $1,288,200 Retail Lockbox 202 $9.50 66 13,311 126,454 $1,517,454 Fax Processing 198 $9.50 3 594 $5,653 $67,716 Total 204 169 34,529 $309,387 $3,712,644 Co-mingled Model Example fully Cost hours/seat/ Seats Total productive Process loaded hourly month required hours/month cost per month per year Credit Card App. Entry $7.00 9,324 $65,268 $783,216 Wholesale Lockbox $8.50 11,300 $96,050 $1,152,600 Retail Lockbox 342 $8.25 101 13,311 $109,815 $1,317,789 Fax Processing $7.50 594 $4,455 $53,460 Total 34,529 $275,588 $3,307,056 Savings from Co-mingling (8%) $33,799 $405,588 26
  • 27.
    Success Story: PerformanceResults • Standalone operations would have required 169 seats for steady state volume of all four processes. • By co-mingling four processes at one site under a single management team, 68 seats were eliminated. • Co-mingling supports a robust disaster recovery solution. An additional 25% capacity is available for short term disruptions at J.P. Morgan Treasury Services sites. Reduction in total seats = 40% At an average annual cost of $6,759 per seat/year, J.P. Morgan Treasury Services avoids over $400,000 in annual costs. 27
  • 28.
    Question & Answer Arun Jain Candice Blom SVP/GM, Data Management Services, ICT Group VP, National Wholesale Lockbox J.P. Morgan Treasury Services Dan Hillman VP, BPO Services, ICT Group 312-336-2829 800-201-1085 candice.blom@jpmchase.com info@ictgroup.com www.jpmchase.com www.ictgroup.com 28