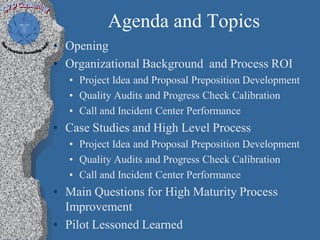
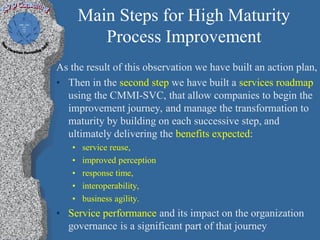
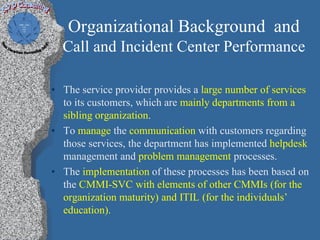
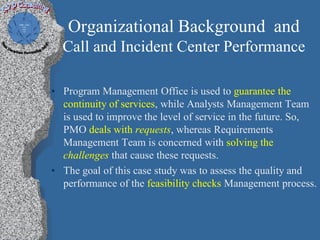
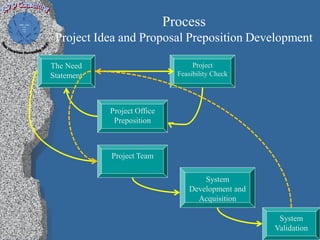
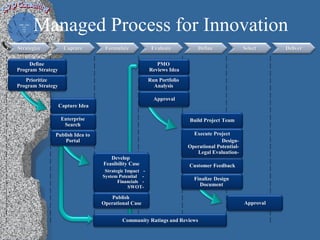
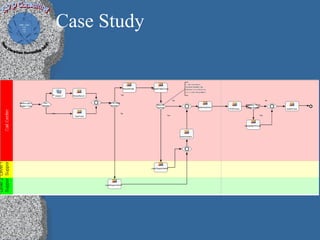
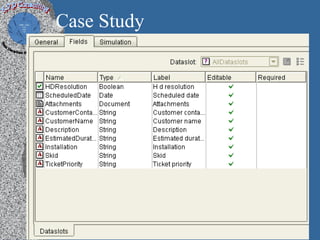
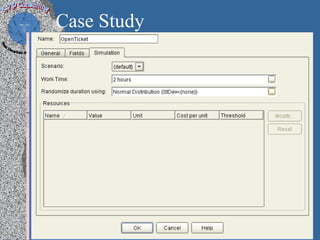
A Process Performance
  Models Case Study

Based on sample (from) 450 project
        feasibility checks

               and

Presented with practical usage and
       implementation tips
Agenda and Topics
• Opening
• Organizational Background and Process ROI
  • Project Idea and Proposal Preposition Development
  • Quality Audits and Progress Check Calibration
  • Call and Incident Center Performance
• Case Studies and High Level Process
  • Project Idea and Proposal Preposition Development
  • Quality Audits and Progress Check Calibration
  • Call and Incident Center Performance
• Main Questions for High Maturity Process
  Improvement
• Pilot Lessoned Learned
Definition of Process
• A set of interrelated activities, which
  transform inputs into outputs, to achieve a
  given purpose.
Process Control
Measuring Process Performance
• Key Questions
   •   What is the current performance?
   •   Is this value "good"?
   •   Is it changing?
   •   How can I make the value “better”?
• Candidate Attributes
   •   Definition (completeness, compatibility)
   •   Usage (compliance, consistency)
   •   Stability (repeatability, variability)
   •   Effectiveness (capability)
   •   Efficiency (productivity, affordability)
   •   Predictive Ability (accuracy, effects of tailoring and
       improvements)
Some Examples
        Goal                                     Measure
Completeness     The number of process elements added, changed, and deleted during
                 tailoring.
Compliance       Number of discrepancy reports generated by Quality Assurance audits
Stability        The number of process elements changed within a specified time
(volatility)     interval.
Effectiveness    Product quality
Effectiveness    Defect leakage to subsequent phases
Efficiency       Productivity (or production coefficient)
Efficiency       Rework as a fraction of total effort
Predictability   Probability distribution for an estimated quantity or related population
                 statistics
Opening

• Typically when one read the CMMI-SVC he may think
  on the classic service provider organization
• The model provides guidance for the application of
  CMMI best practices by the service provider organization.
• Best practices in the model focus on activities for
  providing quality services to the customer and end users.
• In this presentation the ‘services’ is a project feasibility
  checks provided by a dedicated group
Relationships
  for CoQ
Organizational Background and Process ROI
 Project Idea and Proposal Preposition
   Development
 •   If an average developer day cost is ~7000
 •   The total Program effort was 10220 day (100%)
 •   The testing phase was 1480 day (14.5%)
 •   Defect that are the result of documentation are 69% of all defects

 • If we will assume the to correct 69% of all defects will take around 40% of the
   testing duration;  means that:
      • that will be 740 day
      • With the overall cost of 518000
 • However to add 100 review days in the static tests and another 20 of code
   inspection will end with the cost of 2100000

 • And still we have saved at least 3080000 (440 days)
 • Means that we ware able to reduce 4.5% of the project time
Organizational Background and Process ROI

• Quality Audits and Progress Check
  Calibration
  • As for today most of major industries which runs and mange large and
    complex programs need to comply with more than just one quality
    standards in many disciplines (e.g. HW, optics, software) use large groups
    of internal and external assessors that perform implementation checks,
    progress checks, readiness reviews and formal appraisals.
  • These communities are typically composed from groups of very
    experienced and professional individuals that have the best knowledge in
    their professional domain but not necessarily on how to conduct an
    efficient and effective appraisal which provide meaningful results
  • The combination of the effort and expected resources increase the risks on
    qualification of auditors, domain knowledge, and calibration of results and
    findings effectiveness
Organizational Background and Process ROI

• Quality Audits and Progress Check
  Calibration
  • By measuring the following attributes, we were able to increase usability
    of the progress checks by 47%, and quality of deliverables by 37%
      • Role based profile and criteria
      • Calibration mechanism and criteria
      • Evaluation mechanism and criteria
      • Leveling the different quality engineers and ‘auditors’
      • Flowing specific trainings (on different levels) as personal development and
        qualification criteria
      • Listing specific performances as indicators for leveling justifications
      • Structuring the different audits and reporting guidelines in a single mandatory
        to follow process,
Main Steps for High Maturity
           Process Improvement
•   During our analysis and planning, we were able to identify
    improvement targets in main lifecycle areas such as
     • operations,
     • information,
     • governance,
     • people
     • organizational structure,
     • portfolios,
     • project execution,
     • finance.
•   And as in core process that are critical to the system success such as
    stakeholder management, technical interfaces and integration.
Main Steps for High Maturity
          Process Improvement
As the result of this observation we have built an action plan,
• Then in the second step we have built a services roadmap
  using the CMMI-SVC, that allow companies to begin the
  improvement journey, and manage the transformation to
  maturity by building on each successive step, and
  ultimately delivering the benefits expected:
   •   service reuse,
   •   improved perception
   •   response time,
   •   interoperability,
   •   business agility.
• Service performance and its impact on the organization
  governance is a significant part of that journey
Organizational Background and
  Call and Incident Center Performance

• The service provider provides a large number of services
  to its customers, which are mainly departments from a
  sibling organization.
• To manage the communication with customers regarding
  those services, the department has implemented helpdesk
  management and problem management processes.
• The implementation of these processes has been based on
  the CMMI-SVC with elements of other CMMIs (for the
  organization maturity) and ITIL (for the individuals’
  education).
Organizational Background and
  Call and Incident Center Performance

• Program Management Office is used to guarantee the
  continuity of services, while Analysts Management Team
  is used to improve the level of service in the future. So,
  PMO deals with requests, whereas Requirements
  Management Team is concerned with solving the
  challenges that cause these requests.
• The goal of this case study was to assess the quality and
  performance of the feasibility checks Management process.
Process
 Project Idea and Proposal Preposition Development

The Need                            Project
Statement                      Feasibility Check


            Project Office
             Preposition


            Project Team

                                      System
                                  Development and
                                    Acquisition

                                                     System
                                                    Validation
Managed Process for Innovation
Strategize           Capture       Formulate             Evaluate           Define               Select     Deliver

     Define                                                PMO
Program Strategy                                        Reviews Idea
   Prioritize                                           Run Portfolio
Program Strategy                                          Analysis

                                                          Approval
                   Capture Idea

                    Enterprise                                          Build Project Team
                     Search
               Publish Idea to                                            Execute Project
                   Portal                                                             Design-
                                                                        Operational Potential-
                                                                           Legal Evaluation-
                                     Develop
                                  Feasibility Case                      Customer Feedback
                                   Strategic Impact -
                                  System Potential -
                                                                          Finalize Design
                                         Financials -
                                              SWOT-                         Document

                                      Publish
                                  Operational Case                                               Approval


                                          Community Ratings and Reviews
Case Study
Case Study
Case Study
Case Study
Case Study
Process
Quality Audits and Progress Check Calibration

Plan Assessment

  Prepare for
  Assessment

  Gather Data


Consolidate Data
  Organize and
  Combine Data

  Determine Data           Review and Revise
    Sufficiency           Data Gathering Plans

 Make Rating
  Judgments


 Report Results
Process
     Quality Audits and Progress Check Calibration


                      Ratings

                      Findings
                   Observations
                       Notes

Interviews    Doc Review       Instruments   Presentations


                      Data
Center
min                            0%
max                           100%
ave                           50%
sample Projects                104
% From ORG                  100.00%
Sample Practices             19629
% From Sample               100.00%
is 0                          2649
% of is 0                   13.50%
>4                            9147
% of >4                     46.60%
<4                            7828
% of <4                     39.88%
is 4                          2654
% of is 4                   13.52%
>6                            4818
% of >6                     24.55%
mean                         #NUM!
median                          4
mode                            8
VAR                           7.279
Areas
                     A1       A2       A3       A4       A5       A6       A7
min                  0%       0%       0%       0%       0%       0%       0%
max                 100%     100%     100%     100%     100%     100%     100%
ave                 50%      50%     37.5%    62.5%     50%      50%      75%
sample Projects      22        6        3       13       23       13       24
% From ORG         21.15%   5.77%    2.88%    12.50%   22.12%   12.50%   23.08%
Sample Practices    3733      957      647     2069     4961     2914     4348
% From Sample      19.02%   4.88%    3.30%    10.54%   25.27%   14.85%   22.15%
is 0                 526      127      154      195      914      378      355
% of is 0          14.09%   13.27%   23.80%   9.42%    18.42%   12.97%   8.16%
>4                  1575      476      213     1092     1850     1413     2528
% of >4            42.19%   49.74%   32.92%   52.78%   37.29%   48.49%   58.14%
<4                  1626      347      322      705     2358     1165     1305
% of <4            43.56%   36.26%   49.77%   34.07%   47.53%   39.98%   30.01%
is 4                 532      134      112      272      753      336      515
% of is 4          14.25%   14.00%   17.31%   13.15%   15.18%   11.53%   11.84%
>6                   779      211      82       579      775      733     1659
% of >6            20.87%   22.05%   12.67%   27.98%   15.62%   25.15%   38.16%
mean               #NUM!    #NUM!    #NUM!    #NUM!    #NUM!    #NUM!    #NUM!
median                4        4        4        5        4        4        6
mode                  2        6        0        6        0        6        8
VAR                 7.058    6.898    6.750    6.853    6.654    7.142    7.265
Questions ?
Contact
      Kobi Vider
   K.V.P Consulting
Kobi.Vider@hotmail.com
   KobiVP@aol.com
 Phone: +972522946676

Process performance models case study

  • 1.
    A Process Performance Models Case Study Based on sample (from) 450 project feasibility checks and Presented with practical usage and implementation tips
  • 2.
    Agenda and Topics •Opening • Organizational Background and Process ROI • Project Idea and Proposal Preposition Development • Quality Audits and Progress Check Calibration • Call and Incident Center Performance • Case Studies and High Level Process • Project Idea and Proposal Preposition Development • Quality Audits and Progress Check Calibration • Call and Incident Center Performance • Main Questions for High Maturity Process Improvement • Pilot Lessoned Learned
  • 3.
    Definition of Process •A set of interrelated activities, which transform inputs into outputs, to achieve a given purpose.
  • 4.
  • 5.
    Measuring Process Performance •Key Questions • What is the current performance? • Is this value "good"? • Is it changing? • How can I make the value “better”? • Candidate Attributes • Definition (completeness, compatibility) • Usage (compliance, consistency) • Stability (repeatability, variability) • Effectiveness (capability) • Efficiency (productivity, affordability) • Predictive Ability (accuracy, effects of tailoring and improvements)
  • 6.
    Some Examples Goal Measure Completeness The number of process elements added, changed, and deleted during tailoring. Compliance Number of discrepancy reports generated by Quality Assurance audits Stability The number of process elements changed within a specified time (volatility) interval. Effectiveness Product quality Effectiveness Defect leakage to subsequent phases Efficiency Productivity (or production coefficient) Efficiency Rework as a fraction of total effort Predictability Probability distribution for an estimated quantity or related population statistics
  • 7.
    Opening • Typically whenone read the CMMI-SVC he may think on the classic service provider organization • The model provides guidance for the application of CMMI best practices by the service provider organization. • Best practices in the model focus on activities for providing quality services to the customer and end users. • In this presentation the ‘services’ is a project feasibility checks provided by a dedicated group
  • 8.
  • 9.
    Organizational Background andProcess ROI Project Idea and Proposal Preposition Development • If an average developer day cost is ~7000 • The total Program effort was 10220 day (100%) • The testing phase was 1480 day (14.5%) • Defect that are the result of documentation are 69% of all defects • If we will assume the to correct 69% of all defects will take around 40% of the testing duration;  means that: • that will be 740 day • With the overall cost of 518000 • However to add 100 review days in the static tests and another 20 of code inspection will end with the cost of 2100000 • And still we have saved at least 3080000 (440 days) • Means that we ware able to reduce 4.5% of the project time
  • 10.
    Organizational Background andProcess ROI • Quality Audits and Progress Check Calibration • As for today most of major industries which runs and mange large and complex programs need to comply with more than just one quality standards in many disciplines (e.g. HW, optics, software) use large groups of internal and external assessors that perform implementation checks, progress checks, readiness reviews and formal appraisals. • These communities are typically composed from groups of very experienced and professional individuals that have the best knowledge in their professional domain but not necessarily on how to conduct an efficient and effective appraisal which provide meaningful results • The combination of the effort and expected resources increase the risks on qualification of auditors, domain knowledge, and calibration of results and findings effectiveness
  • 11.
    Organizational Background andProcess ROI • Quality Audits and Progress Check Calibration • By measuring the following attributes, we were able to increase usability of the progress checks by 47%, and quality of deliverables by 37% • Role based profile and criteria • Calibration mechanism and criteria • Evaluation mechanism and criteria • Leveling the different quality engineers and ‘auditors’ • Flowing specific trainings (on different levels) as personal development and qualification criteria • Listing specific performances as indicators for leveling justifications • Structuring the different audits and reporting guidelines in a single mandatory to follow process,
  • 12.
    Main Steps forHigh Maturity Process Improvement • During our analysis and planning, we were able to identify improvement targets in main lifecycle areas such as • operations, • information, • governance, • people • organizational structure, • portfolios, • project execution, • finance. • And as in core process that are critical to the system success such as stakeholder management, technical interfaces and integration.
  • 13.
    Main Steps forHigh Maturity Process Improvement As the result of this observation we have built an action plan, • Then in the second step we have built a services roadmap using the CMMI-SVC, that allow companies to begin the improvement journey, and manage the transformation to maturity by building on each successive step, and ultimately delivering the benefits expected: • service reuse, • improved perception • response time, • interoperability, • business agility. • Service performance and its impact on the organization governance is a significant part of that journey
  • 14.
    Organizational Background and Call and Incident Center Performance • The service provider provides a large number of services to its customers, which are mainly departments from a sibling organization. • To manage the communication with customers regarding those services, the department has implemented helpdesk management and problem management processes. • The implementation of these processes has been based on the CMMI-SVC with elements of other CMMIs (for the organization maturity) and ITIL (for the individuals’ education).
  • 15.
    Organizational Background and Call and Incident Center Performance • Program Management Office is used to guarantee the continuity of services, while Analysts Management Team is used to improve the level of service in the future. So, PMO deals with requests, whereas Requirements Management Team is concerned with solving the challenges that cause these requests. • The goal of this case study was to assess the quality and performance of the feasibility checks Management process.
  • 16.
    Process Project Ideaand Proposal Preposition Development The Need Project Statement Feasibility Check Project Office Preposition Project Team System Development and Acquisition System Validation
  • 17.
    Managed Process forInnovation Strategize Capture Formulate Evaluate Define Select Deliver Define PMO Program Strategy Reviews Idea Prioritize Run Portfolio Program Strategy Analysis Approval Capture Idea Enterprise Build Project Team Search Publish Idea to Execute Project Portal Design- Operational Potential- Legal Evaluation- Develop Feasibility Case Customer Feedback Strategic Impact - System Potential - Finalize Design Financials - SWOT- Document Publish Operational Case Approval Community Ratings and Reviews
  • 18.
  • 19.
  • 20.
  • 21.
  • 22.
  • 25.
    Process Quality Audits andProgress Check Calibration Plan Assessment Prepare for Assessment Gather Data Consolidate Data Organize and Combine Data Determine Data Review and Revise Sufficiency Data Gathering Plans Make Rating Judgments Report Results
  • 26.
    Process Quality Audits and Progress Check Calibration Ratings Findings Observations Notes Interviews Doc Review Instruments Presentations Data
  • 27.
    Center min 0% max 100% ave 50% sample Projects 104 % From ORG 100.00% Sample Practices 19629 % From Sample 100.00% is 0 2649 % of is 0 13.50% >4 9147 % of >4 46.60% <4 7828 % of <4 39.88% is 4 2654 % of is 4 13.52% >6 4818 % of >6 24.55% mean #NUM! median 4 mode 8 VAR 7.279
  • 28.
    Areas A1 A2 A3 A4 A5 A6 A7 min 0% 0% 0% 0% 0% 0% 0% max 100% 100% 100% 100% 100% 100% 100% ave 50% 50% 37.5% 62.5% 50% 50% 75% sample Projects 22 6 3 13 23 13 24 % From ORG 21.15% 5.77% 2.88% 12.50% 22.12% 12.50% 23.08% Sample Practices 3733 957 647 2069 4961 2914 4348 % From Sample 19.02% 4.88% 3.30% 10.54% 25.27% 14.85% 22.15% is 0 526 127 154 195 914 378 355 % of is 0 14.09% 13.27% 23.80% 9.42% 18.42% 12.97% 8.16% >4 1575 476 213 1092 1850 1413 2528 % of >4 42.19% 49.74% 32.92% 52.78% 37.29% 48.49% 58.14% <4 1626 347 322 705 2358 1165 1305 % of <4 43.56% 36.26% 49.77% 34.07% 47.53% 39.98% 30.01% is 4 532 134 112 272 753 336 515 % of is 4 14.25% 14.00% 17.31% 13.15% 15.18% 11.53% 11.84% >6 779 211 82 579 775 733 1659 % of >6 20.87% 22.05% 12.67% 27.98% 15.62% 25.15% 38.16% mean #NUM! #NUM! #NUM! #NUM! #NUM! #NUM! #NUM! median 4 4 4 5 4 4 6 mode 2 6 0 6 0 6 8 VAR 7.058 6.898 6.750 6.853 6.654 7.142 7.265
  • 29.
  • 30.
    Contact Kobi Vider K.V.P Consulting Kobi.Vider@hotmail.com KobiVP@aol.com Phone: +972522946676