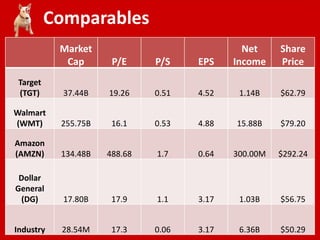
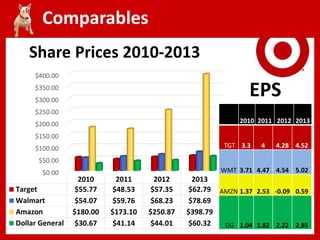
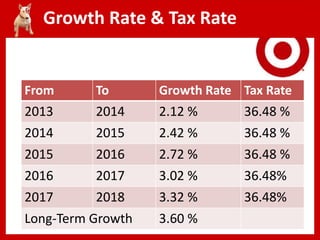
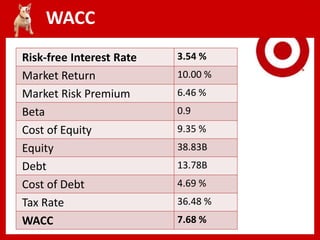
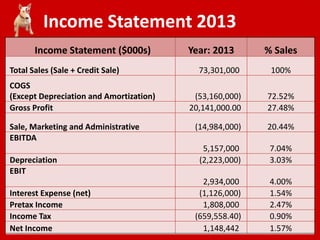
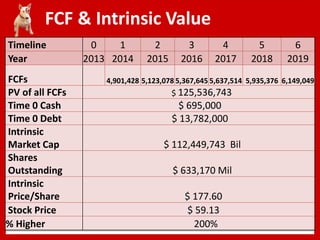
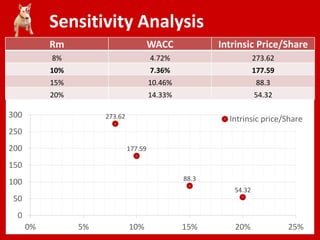
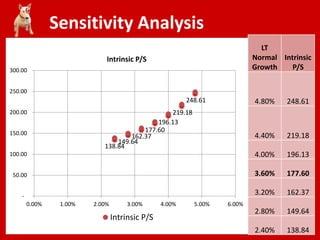
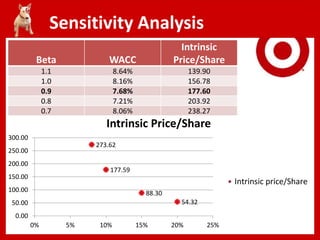
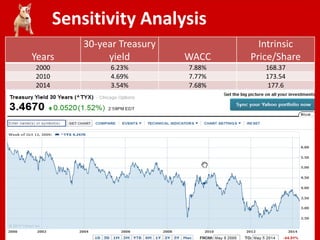
11. Income Statement 2013
Income Statement ($000s) Year: 2013 % Sales
Total Sales (Sale + Credit Sale) 73,301,000 100%
COGS
(Except Depreciation and Amortization) (53,160,000) 72.52%
Gross Profit 20,141,000.00 27.48%
Sale, Marketing and Administrative (14,984,000) 20.44%
EBITDA
5,157,000 7.04%
Depreciation (2,223,000) 3.03%
EBIT
2,934,000 4.00%
Interest Expense (net) (1,126,000) 1.54%
Pretax Income 1,808,000 2.47%
Income Tax (659,558.40) 0.90%
Net Income 1,148,442 1.57%
12. Balance Sheet 2013
Balance Sheet ($000s) Year:2013 % Sales
Assets
Cash and Equivalents 695,000 0.95%
Accounts Receivable - 0.00%
Inventories 8,766,000 11.96%
Other CA
2,112,000 2.88%
Total Current Assets 11,573,000 15.79%
Prop, Plant & Equip 31,378,000 42.81%
Other LT Assets 1,602,000 2.19%
Total Assets 44,553,000 60.78%
Liabilities & Stockholders' Equity
Accounts Payable 11,617,000 15.85%
Other ST or LT Liabilities 2,923,000 3.99%
Debt 13,782,000 18.80%
Total Liabilities 28,322,000 38.64%
Stockholders' Equity 16,231,000 22.14%
Total Liabilities & Equity 44,553,000 60.78%
13. Plug
Year 2013 2014 2015 2016 2017 2018
Total
Assets 44,553,000 45,497,524 46,598,564 47,866,045 49,311,599 50,948,744
Total Liab. & Shares
before Plug 45,592,670 46,610,798 47,792,136 49,147,361 50,688,998
Plug (95,103) (12,234) 73,909 164,238 259,746
After 45,497,567 46,598,564 47,866,045 49,311,599 50,948,744
14. NI and Div in next 5 years
Year 2013 2014 2015 2016 2017 2018
Net
Income 1,453,099 1,492,609 1,538,666 1,591,685 1,652,154 1,720,636
Dividends 741,080 761,231 784,720 811,759 842,599 877,524
Pay out Ratio: 51%
15. FCF & Intrinsic Value
Timeline 0 1 2 3 4 5 6
Year 2013 2014 2015 2016 2017 2018 2019
FCFs 4,901,428 5,123,078 5,367,645 5,637,514 5,935,376 6,149,049
PV of all FCFs $ 125,536,743
Time 0 Cash $ 695,000
Time 0 Debt $ 13,782,000
Intrinsic
Market Cap $ 112,449,743 Bil
Shares
Outstanding $ 633,170 Mil
Intrinsic
Price/Share $ 177.60
Stock Price $ 59.13
% Higher 200%