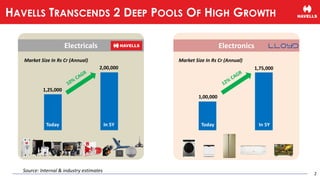
Electricals
Market Size InRs Cr (Annual)
Today In 5Y
1,25,000
2,00,000
Electronics
Market Size In Rs Cr (Annual)
Today In 5Y
1,00,000
1,75,000
Source: Internal & industry estimates
2
HAVELLS TRANSCENDS 2 DEEP POOLS OF HIGH GROWTH
3.
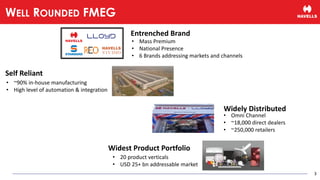
• Mass Premium
•National Presence
• 6 Brands addressing markets and channels
Entrenched Brand
Self Reliant
• ~90% in-house manufacturing
• High level of automation & integration
• 20 product verticals
• USD 25+ bn addressable market
Widest Product Portfolio
Widely Distributed
• Omni Channel
• ~18,000 direct dealers
• ~250,000 retailers
3
WELL ROUNDED FMEG
4.
1993
1958 2007
2003
1971 2017
20152019 2023
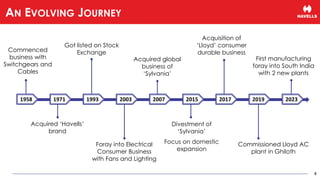
Commenced
business with
Switchgears and
Cables
Acquired ‘Havells’
brand
Got listed on Stock
Exchange
Foray into Electrical
Consumer Business
with Fans and Lighting
Acquired global
business of
‘Sylvania’
Divestment of
‘Sylvania’
Focus on domestic
expansion
Acquisition of
‘Lloyd’ consumer
durable business
Commissioned Lloyd AC
plant in Ghiloth
First manufacturing
foray into South India
with 2 new plants
4
AN EVOLVING JOURNEY
5.
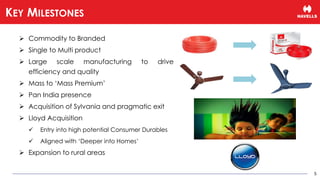
➢ Commodity toBranded
➢ Single to Multi product
➢ Large scale manufacturing to drive
efficiency and quality
➢ Mass to ‘Mass Premium’
➢ Pan India presence
➢ Acquisition of Sylvania and pragmatic exit
➢ Lloyd Acquisition
✓ Entry into high potential Consumer Durables
✓ Aligned with ‘Deeper into Homes’
➢ Expansion to rural areas
5
KEY MILESTONES
6.
6
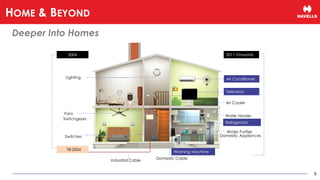
Lighting
Air Cooler
Switches
Fans
Water Heater
DomesticAppliances
Industrial Cable
Switchgears
Domestic Cable
2004
Till 2004
2011 Onwards
Washing Machine
Air Conditioner
Television
Refrigerator
Water Purifier
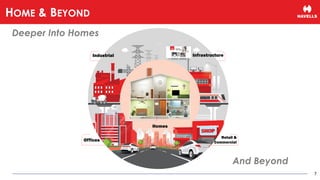
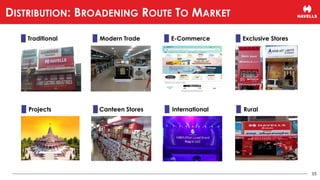
HOME & BEYOND
Deeper Into Homes
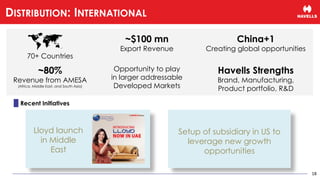
70+ Countries
~80%
Revenue fromAMESA
(Africa, Middle East, and South Asia)
Opportunity to play
in larger addressable
Developed Markets
~$100 mn
Export Revenue
China+1
Creating global opportunities
Havells Strengths
Brand, Manufacturing,
Product portfolio, R&D
Recent Initiatives
Lloyd launch
in Middle
East
Setup of subsidiary in US to
leverage new growth
opportunities
18
DISTRIBUTION: INTERNATIONAL
19.
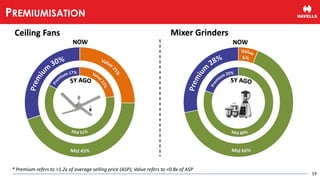
Ceiling Fans MixerGrinders
* Premium refers to >1.2x of average selling price (ASP); Value refers to <0.8x of ASP
19
PREMIUMISATION
20.
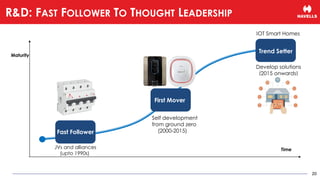
Trend Setter
Fast Follower
Maturity
Time
FirstMover
First Mover
Trend Setter
JVs and alliances
(upto 1990s)
Self development
from ground zero
(2000-2015)
Develop solutions
(2015 onwards)
IOT Smart Homes
20
R&D: FAST FOLLOWER TO THOUGHT LEADERSHIP
21.
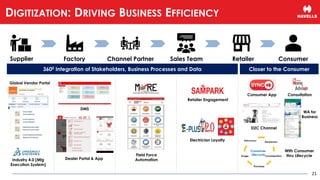
Factory Channel PartnerSales Team Retailer Consumer
Industry 4.0 (Mfg
Execution System)
Retailer Engagement
Electrician Loyalty
Field Force
Automation
DMS
Dealer Portal & App
3600 Integration of Stakeholders, Business Processes and Data Closer to the Consumer
Consumer App
D2C Channel
Consultation
WA for
Business
With Consumer
thru Lifecycle
Supplier
Global Vendor Portal
21
DIGITIZATION: DRIVING BUSINESS EFFICIENCY
22.
22
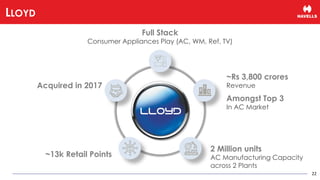
LLOYD
Acquired in 2017
FullStack
Consumer Appliances Play (AC, WM, Ref, TV)
~Rs 3,800 crores
Revenue
Amongst Top 3
In AC Market
2 Million units
AC Manufacturing Capacity
across 2 Plants
~13k Retail Points
23.
Source: CEAMA andFrost and Sullivan
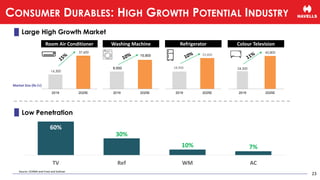
Large High Growth Market
24,500
45,800
2019 2025E
Washing Machine Refrigerator Colour Television
9,500
15,900
2019 2025E
18,900
33,600
2019 2025E
Market Size (Rs Cr)
Room Air Conditioner
16,300
37,600
2019 2025E
Low Penetration
60%
30%
10% 7%
TV Ref WM AC
23
CONSUMER DURABLES: HIGH GROWTH POTENTIAL INDUSTRY
24.
24
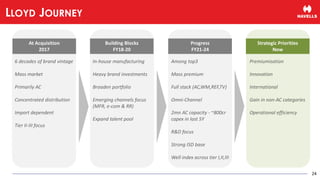
LLOYD JOURNEY
At Acquisition
2017
6decades of brand vintage
Mass market
Primarily AC
Concentrated distribution
Import dependent
Tier II-III focus
Building Blocks
FY18-20
In-house manufacturing
Heavy brand investments
Broaden portfolio
Emerging channels focus
(MFR, e-com & RR)
Expand talent pool
Progress
FY21-24
Among top3
Mass premium
Full stack (AC,WM,REF,TV)
Omni-Channel
2mn AC capacity - ~800cr
capex in last 5Y
R&D focus
Strong ISD base
Well index across tier I,II,III
Strategic Priorities
Now
Premiumisation
Innovation
International
Gain in non-AC categories
Operational efficiency
25.
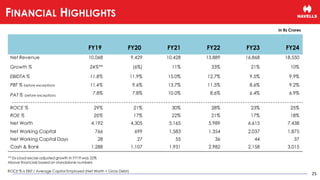
FY19 FY20 FY21FY22 FY23 FY24
Net Revenue 10,068 9,429 10,428 13,889 16,868 18,550
Growth % 24%** (6%) 11% 33% 21% 10%
EBIDTA % 11.8% 11.9% 15.0% 12.7% 9.5% 9.9%
PBT % before exceptions 11.4% 9.6% 13.7% 11.5% 8.6% 9.2%
PAT % before exceptions
7.8% 7.8% 10.0% 8.6% 6.4% 6.9%
ROCE % 29% 21% 30% 28% 23% 25%
ROE % 20% 17% 22% 21% 17% 18%
Net Worth 4,192 4,305 5,165 5,989 6,615 7,438
Net Working Capital 766 699 1,583 1,354 2,037 1,875
Net Working Capital Days 28 27 55 36 44 37
Cash & Bank 1,288 1,107 1,931 2,982 2,158 3,015
** Ex-Lloyd excise adjusted growth in FY19 was 22%
Above financials based on standalone numbers
ROCE % is EBIT / Average Capital Employed (Net Worth + Gross Debt)
In Rs Crores
25
FINANCIAL HIGHLIGHTS
26.
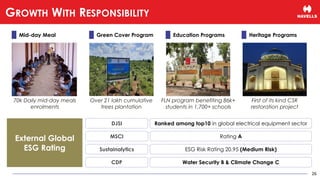
70k Daily mid-daymeals
enrolments
FLN program benefiting 86k+
students in 1,700+ schools
First of its kind CSR
restoration project
Over 21 lakh cumulative
trees plantation
Rating A
Ranked among top10 in global electrical equipment sector
DJSI
MSCI
External Global
ESG Rating
Mid-day Meal Green Cover Program Education Programs Heritage Programs
Water Security B & Climate Change C
ESG Risk Rating 20.95 (Medium Risk)
Sustainalytics
CDP
26
GROWTH WITH RESPONSIBILITY
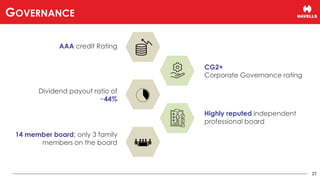
27.
AAA credit Rating
CG2+
CorporateGovernance rating
Dividend payout ratio of
~44%
Highly reputed independent
professional board
14 member board; only 3 family
members on the board
27
GOVERNANCE
29
SUMMARY
An Indian brandborn, survived and thrived
amidst fierce competition
Value creation for all its
stakeholders
Entrepreneurship with guts, integrity
and humility
Excited with opportunities ahead
Uniquely positioned to serve the
aspiring nation and build lasting
legacy