Downloaded 514 times


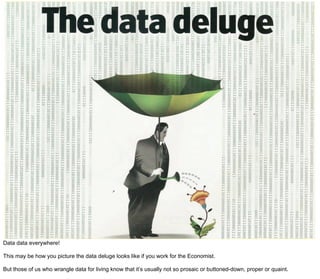
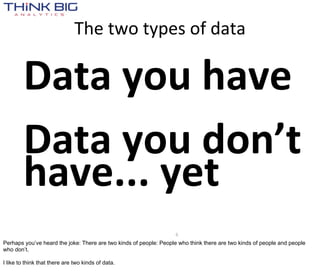
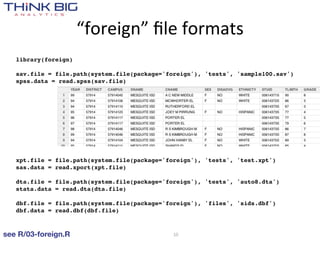

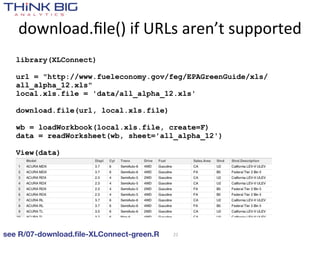
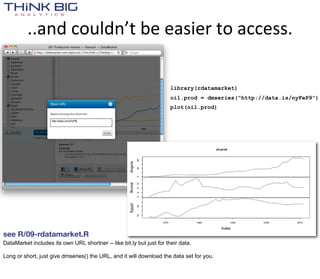
![Non-‐relaMonal databases too
> library(rhbase)
> hb.init(serialize='raw')
> x = hb.get(tablename='tweets', rows='221325531868692480')
> str(x)
List of 1
$ :List of 3
..$ : chr "221325531868692480"
..$ : chr [1:10] "created:" "favorited:" "id:" "replyToSID:" ...
..$ :List of 10
.. ..$ : chr "2012-07-06 19:31:33"
.. ..$ : chr "FALSE"
.. ..$ : chr "221325531868692480"
.. ..$ : chr "NA"
.. ..$ : chr "NA"
.. ..$ : chr "NA"
.. ..$ : chr "arnicas"
.. ..$ : chr "<a href="http://www.tweetdeck.com"
rel="nofollow">TweetDeck</a>"
.. ..$ : chr "RT @bycoffe: From @DrewLinzer, an #Rstats function for querying
the HuffPost Pollster API. http://t.co/fXnG32JX cc @thewhyaxis"
.. ..$ : chr "FALSE"
12](https://image.slidesharecdn.com/tappingthedatadeluge-121002103232-phpapp01/85/Tapping-the-Data-Deluge-with-R-12-320.jpg)
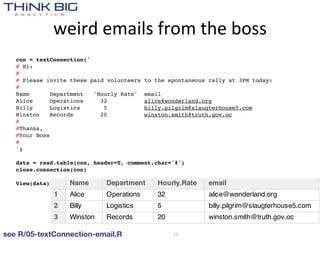
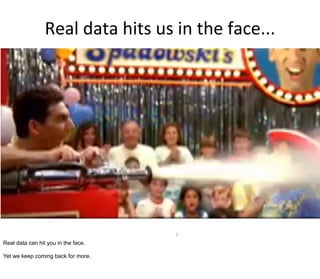
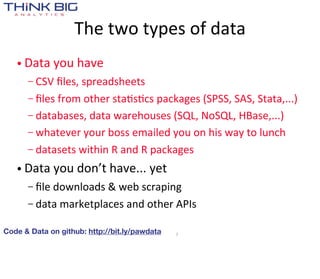
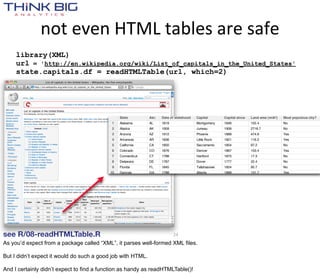
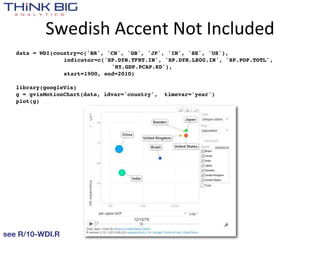
![> data()
Data sets in package ‘datasets’:
AirPassengers Monthly Airline Passenger Numbers 1949-1960
BJsales Sales Data with Leading Indicator
BJsales.lead (BJsales)
Sales Data with Leading Indicator
BOD Biochemical Oxygen Demand
CO2 Carbon Dioxide Uptake in Grass Plants
ChickWeight Weight versus age of chicks on different diets
DNase Elisa assay of DNase
EuStockMarkets Daily Closing Prices of Major European Stock
Indices, 1991-1998
Formaldehyde Determination of Formaldehyde
HairEyeColor Hair and Eye Color of Statistics Students
Harman23.cor Harman Example 2.3
Harman74.cor Harman Example 7.4
Indometh Pharmacokinetics of Indomethacin
InsectSprays Effectiveness of Insect Sprays
JohnsonJohnson Quarterly Earnings per Johnson & Johnson Share
LakeHuron Level of Lake Huron 1875-1972
LifeCycleSavings Intercountry Life-Cycle Savings Data
Loblolly Growth of Loblolly pine trees
Nile Flow of the River Nile
Orange Growth of Orange Trees
OrchardSprays Potency of Orchard Sprays
PlantGrowth Results from an Experiment on Plant Growth
Puromycin Reaction Velocity of an Enzymatic Reaction
Seatbelts Road Casualties in Great Britain 1969-84
Theoph Pharmacokinetics of Theophylline
Titanic Survival of passengers on the Titanic
ToothGrowth The Effect of Vitamin C on Tooth Growth in
Guinea Pigs
UCBAdmissions Student Admissions at UC Berkeley
UKDriverDeaths Road Casualties in Great Britain 1969-84
UKgas UK Quarterly Gas Consumption
USAccDeaths Accidental Deaths in the US 1973-1978
USArrests Violent Crime Rates by US State
USJudgeRatings Lawyers' Ratings of State Judges in the US
Superior Court
USPersonalExpenditure Personal Expenditure Data
VADeaths Death Rates in Virginia (1940)
WWWusage Internet Usage per Minute
WorldPhones The World's Telephones
ability.cov Ability and Intelligence Tests
airmiles Passenger Miles on Commercial US Airlines,
1937-1960
airquality New York Air Quality Measurements
[...]](https://image.slidesharecdn.com/tappingthedatadeluge-121002103232-phpapp01/85/Tapping-the-Data-Deluge-with-R-14-320.jpg)
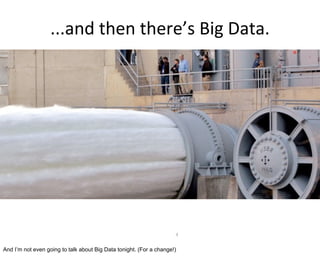
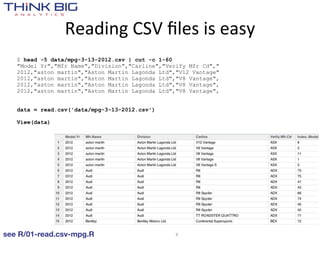
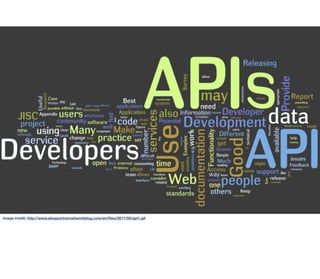
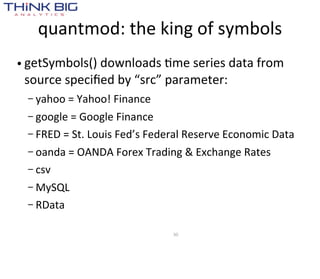
![> library(zipcode)
> data(zipcode)
> str(zipcode)
'data.frame': 44336 obs. of 5 variables:
$ zip : chr "00210" "00211" "00212" "00213" ...
$ city : chr "Portsmouth" "Portsmouth" "Portsmouth" "Portsmouth" ...
$ state : chr "NH" "NH" "NH" "NH" ...
$ latitude : num 43 43 43 43 43 ...
$ longitude: num -71 -71 -71 -71 -71 ...
> subset(zipcode, city=='Boston' & state=='MA')
zip city state latitude longitude
664 02101 Boston MA 42.37057 -71.02696
665 02102 Boston MA 42.33895 -70.91963
666 02103 Boston MA 42.33895 -70.91963
667 02104 Boston MA 42.33895 -70.91963
668 02105 Boston MA 42.33895 -70.91963
669 02106 Boston MA 42.35432 -71.07345
670 02107 Boston MA 42.33895 -70.91963
671 02108 Boston MA 42.35790 -71.06408
672 02109 Boston MA 42.36148 -71.05417
673 02110 Boston MA 42.35653 -71.05365
674 02111 Boston MA 42.34984 -71.06101
675 02112 Boston MA 42.33895 -70.91963
676 02113 Boston MA 42.36503 -71.05636
677 02114 Boston MA 42.36179 -71.06774
678 02115 Boston MA 42.34308 -71.09268
679 02116 Boston MA 42.34962 -71.07372
680 02117 Boston MA 42.33895 -70.91963
681 02118 Boston MA 42.33872 -71.07276
682 02119 Boston MA 42.32451 -71.08455
683 02120 Boston MA 42.33210 -71.09651
684 02121 Boston MA 42.30745 -71.08127
685 02122 Boston MA 42.29630 -71.05454
686 02123 Boston MA 42.33895 -70.91963
687 02124 Boston MA 42.28713 -71.07156
688 02125 Boston MA 42.31685 -71.05811
690 02127 Boston MA 42.33499 -71.04562
691 02128 Boston MA 42.37830 -71.02550
696 02133 Boston MA 42.33895 -70.91963
726 02163 Boston MA 42.36795 -71.12056
757 02196 Boston MA 42.33895 -70.91963
[...]](https://image.slidesharecdn.com/tappingthedatadeluge-121002103232-phpapp01/85/Tapping-the-Data-Deluge-with-R-15-320.jpg)
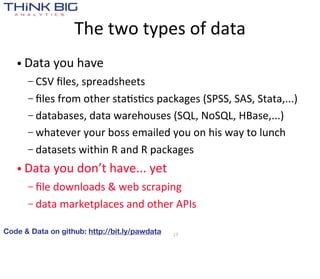
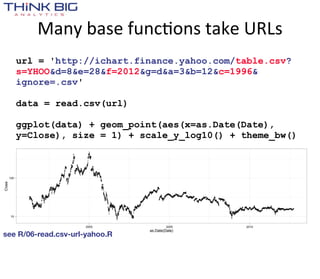

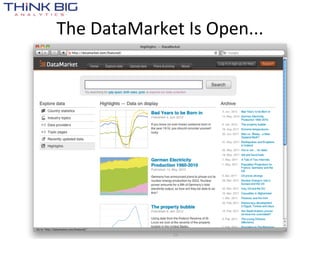
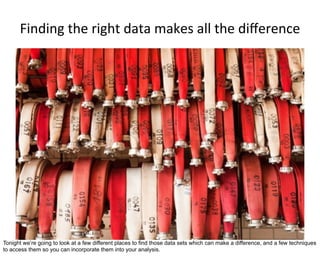
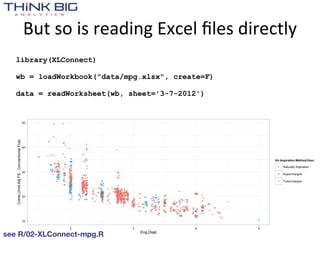
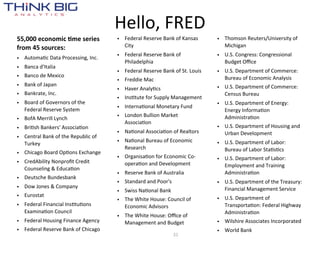
![Make a withdrawal from the World Bank
> library(WDI)
> WDIsearch('population, total')
indicator name
"SP.POP.TOTL" "Population, total"
> WDIsearch('fertility .*total')
indicator name
"SP.DYN.TFRT.IN" "Fertility rate, total (births per woman)"
> WDIsearch('life expectancy .*birth.*total')
indicator name
"SP.DYN.LE00.IN" "Life expectancy at birth, total (years)"
> WDIsearch('GDP per capita .*constant')
indicator name
[1,] "NY.GDP.PCAP.KD" "GDP per capita (constant 2000 US$)"
[2,] "NY.GDP.PCAP.KN" "GDP per capita (constant LCU)"
> WDIsearch('population, total')
indicator name
"SP.POP.TOTL" "Population, total"
see R/10-WDI.R 28](https://image.slidesharecdn.com/tappingthedatadeluge-121002103232-phpapp01/85/Tapping-the-Data-Deluge-with-R-28-320.jpg)


The document discusses the versatility and accessibility of various data sources, emphasizing the importance of utilizing both available and supplementary data for analysis. It outlines methods for importing data from different file formats and databases, along with techniques for web scraping and accessing data APIs. Additionally, it mentions specific libraries in R for working with different data types and provides examples of code to demonstrate these processes.