Download as PDF, PPTX
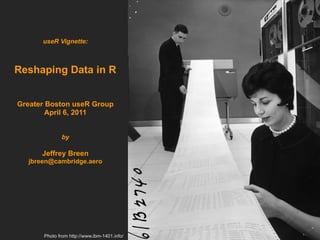

![Sample data: U.S. Census 2010
Read the data:
> pop = read.csv('http://2010.census.gov/2010census/data/pop_density.csv', skip=3)
Just keep the first few columns (total state populations by year):
> pop = pop[,1:12]
Clean up column names:
> colnames(pop)
[1] "STATE_OR_REGION" "X1910_POPULATION" "X1920_POPULATION" "X1930_POPULATION"
"X1940_POPULATION" "X1950_POPULATION"
[7] "X1960_POPULATION" "X1970_POPULATION" "X1980_POPULATION" "X1990_POPULATION"
"X2000_POPULATION" "X2010_POPULATION"
> colnames(pop) = c('state', seq(1910, 2010, 10))
> colnames(pop)
[1] "state" "1910" "1920" "1930" "1940" "1950" "1960" "1970" "1980" "1990" "2000"
"2010"
useR Vignette: Reshaping Data in R Greater Boston useR Meeting, April 2011 Slide 3](https://image.slidesharecdn.com/reshapingdata20110406-110506090255-phpapp02/85/Reshaping-Data-in-R-3-320.jpg)


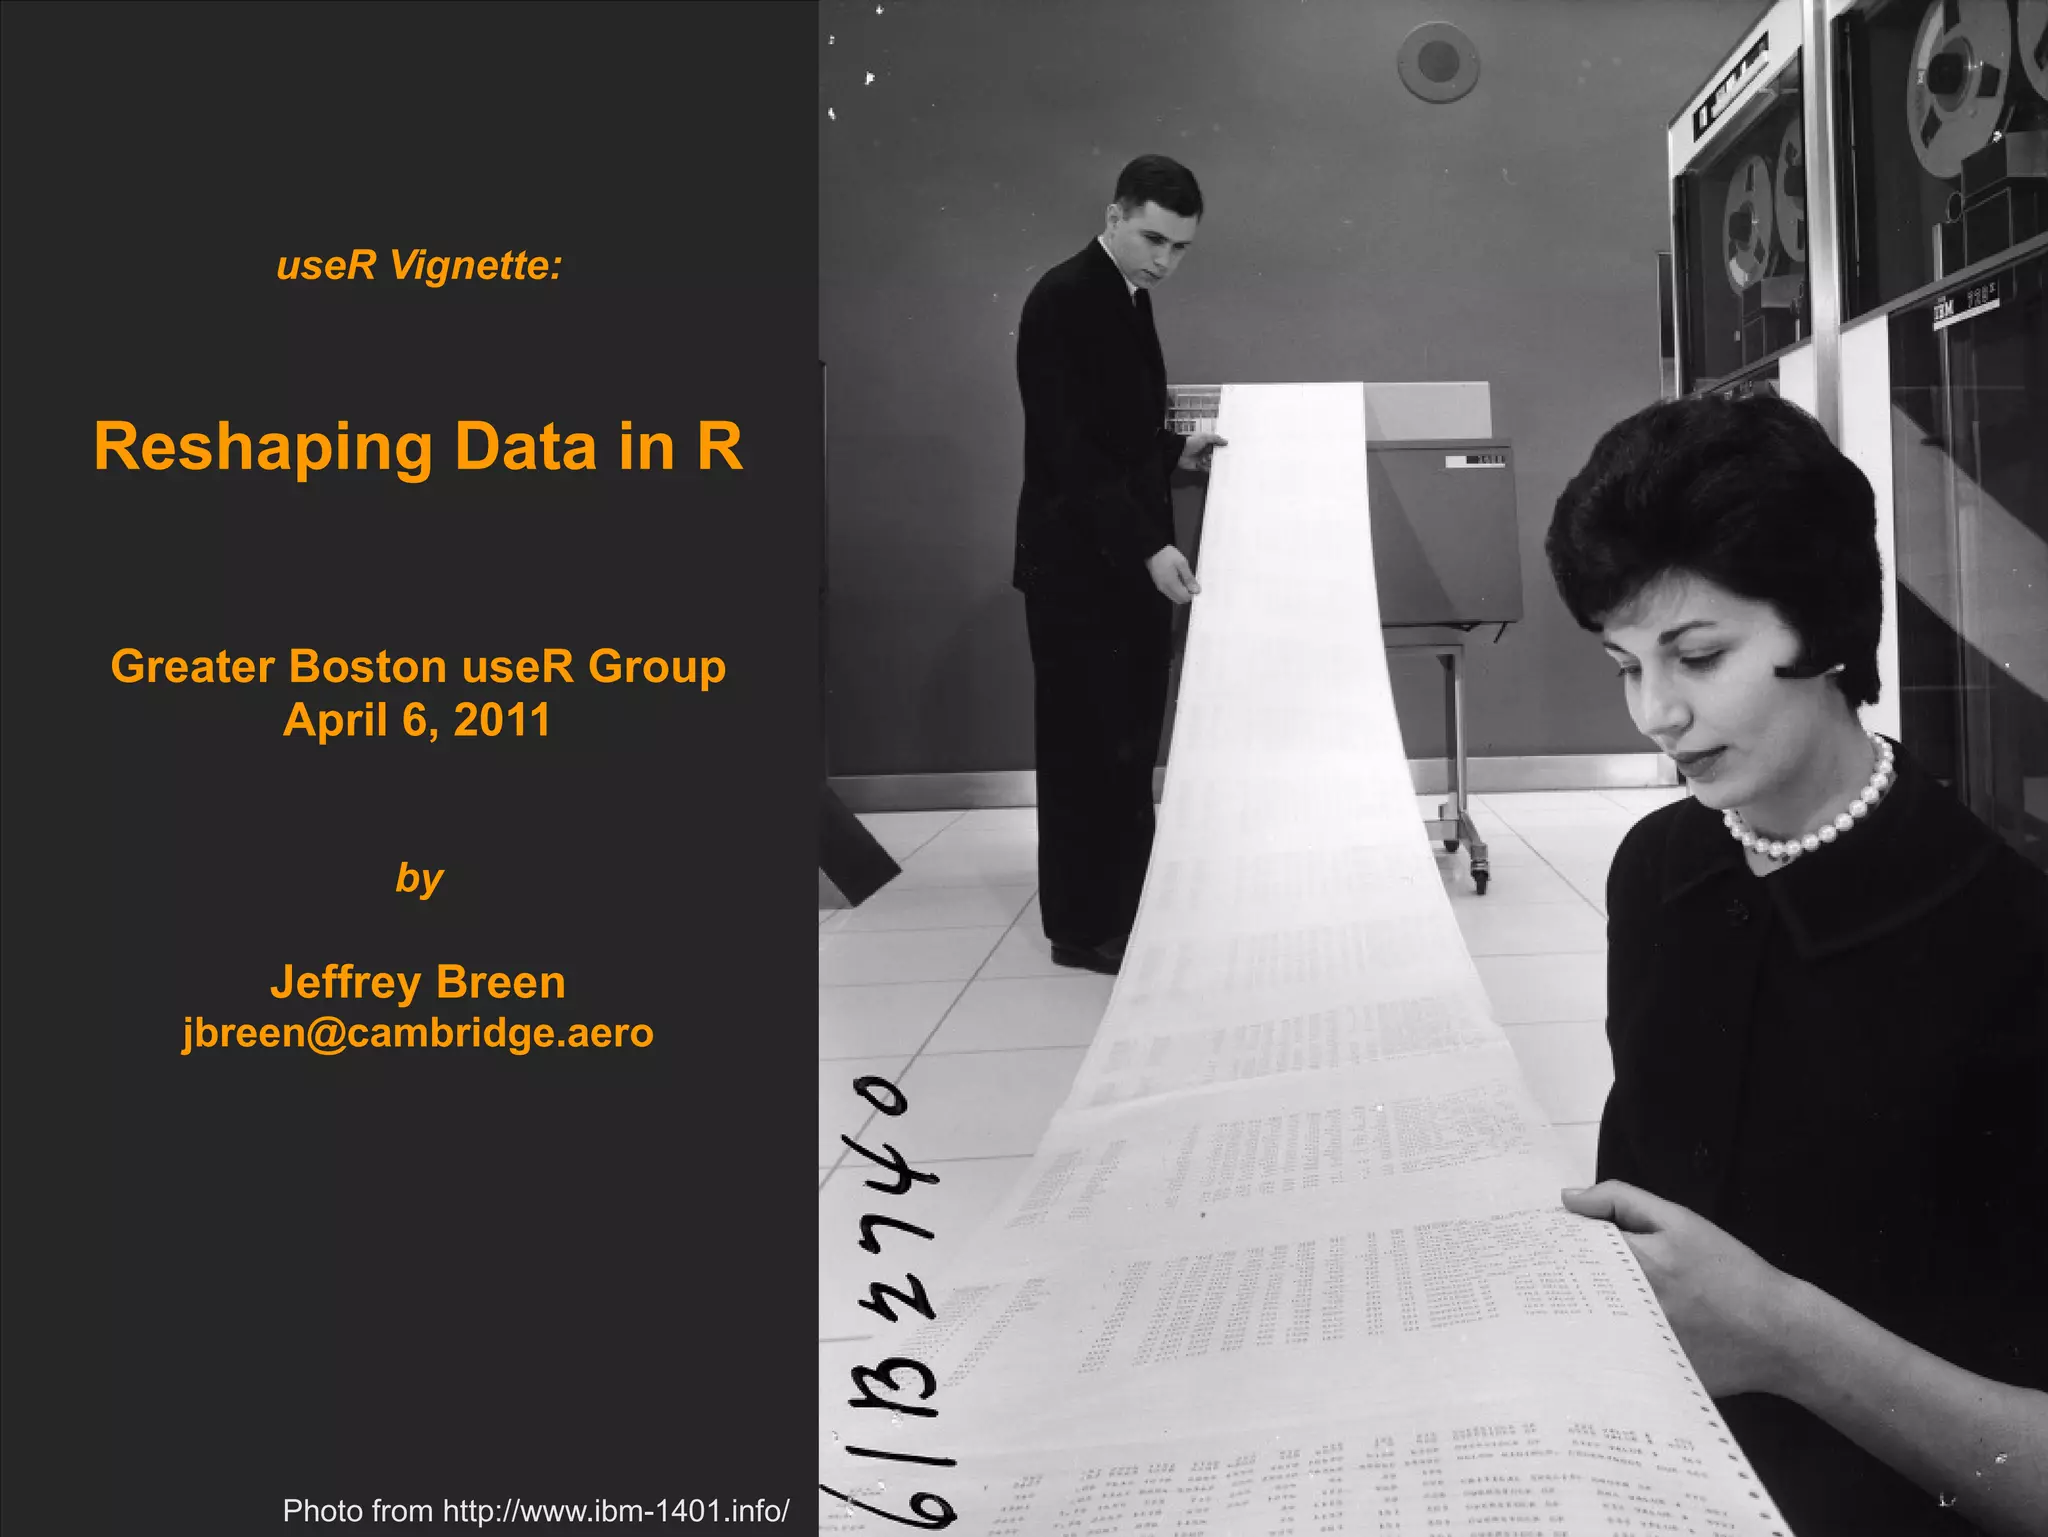
![reshape2 package
● Hadley Wickham's “reboot of the reshape
package”
● Like “plyr”, naming convention denotes output data
type: acast() → arrays, dcast() → data.frames
– Beware conflict between reshape::melt() and
reshape2::melt()
● Announced September 2010 on [R-pkgs]:
● http://r.789695.n4.nabble.com/R-pkgs-reshape2-a-reboot-
● Similar functions in Base R
● utils::stack(), utils::unstack(), stats::reshape()
useR Vignette: Reshaping Data in R Greater Boston useR Meeting, April 2011 Slide 7](https://image.slidesharecdn.com/reshapingdata20110406-110506090255-phpapp02/85/Reshaping-Data-in-R-7-320.jpg)

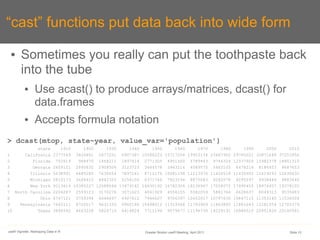
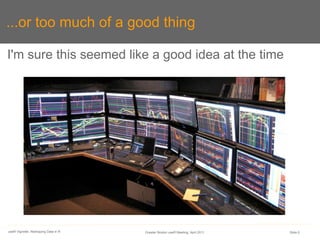
![Extra credit: *cast functions for BI
● Disclaimer on http://had.co.nz/reshape/ warns not
a “fully fledged OLAP solution”
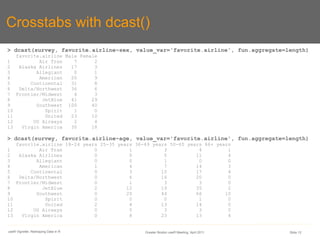
● But *cast() can replace table() for computing
frequency/contingency tables and crosstabs
● Formula notation allows you to pick out specific
columns so wide data can look molten
● Here's some (fake) consumer survey data:
> head(survey)
ResponseID sex age favorite.airline
1 R_51JpA6GecA0SRcU Female 36-49 years Virgin America
2 R_0N77P8pZyPnjctm Male 50-65 years Southwest
3 R_eFoGuGRSuzqnHgM Male 50-65 years Southwest
4 R_9KXgybRXPiDG3LS Male 36-49 years Continental
5 R_cCH0fRZmc0zwGkk Male 50-65 years Delta/Northwest
6 R_ba8ujmCV5OnBNxW Male 36-49 years Southwest
[...]
useR Vignette: Reshaping Data in R Greater Boston useR Meeting, April 2011 Slide 11](https://image.slidesharecdn.com/reshapingdata20110406-110506090255-phpapp02/85/Reshaping-Data-in-R-11-320.jpg)
![Further reading
● reshape2 package on CRAN
● http://cran.r-project.org/web/packages/reshape2/
● Hadley's github (bleeding edge)
● https://github.com/hadley/reshape
● Decision Stats: “Using Reshape2 for transposing datasets
in R”
● http://decisionstats.com/2010/11/06/using-reshape2-for-transposin
● Recology: “Good riddance to Excel pivot tables”
● http://r-ecology.blogspot.com/2011/01/good-riddance-to-excel-pivo
● Stack Overflow discussions: “[r] reshape2”
● http://stackoverflow.com/search?tab=votes&q=[r]%20reshape2
useR Vignette: Reshaping Data in R Greater Boston useR Meeting, April 2011 Slide 13](https://image.slidesharecdn.com/reshapingdata20110406-110506090255-phpapp02/85/Reshaping-Data-in-R-13-320.jpg)

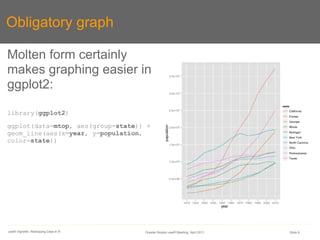
The document discusses reshaping data in R using the 'reshape2' package, focusing on converting wide data formats to long formats with functions like 'melt()' and back to wide using 'dcast()'. It includes practical examples with U.S. Census population data and emphasizes the feasibility of data manipulation for analysis and visualization. The document also highlights the importance of the reshaping process for effective data management and plotting in R.