Download to read offline

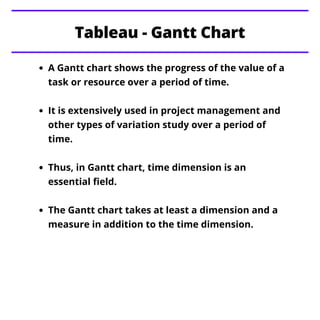
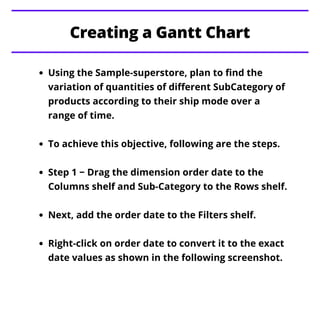
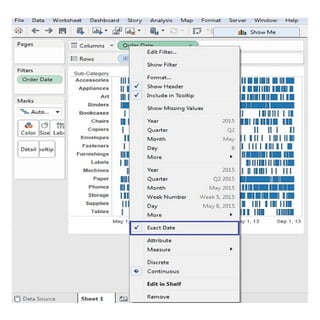
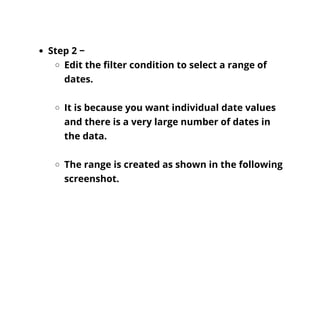


The document explains how to create a Gantt chart using Tableau, which is useful for visualizing the progress of tasks over time in project management. It outlines specific steps such as dragging dimensions to the appropriate shelves, filtering date ranges, and customizing the chart with ship mode and quantity. The document also briefly mentions other types of charts that will be covered in future posts.


![GanttChartGantt Chart© 2008 Vertex42 LLC0HELP[Project Name][Compan.docx](https://cdn.slidesharecdn.com/ss_thumbnails/ganttchartganttchart2008vertex42llc0helpprojectnamecompan-221101070955-4e6ea5dc-thumbnail.jpg?width=640&height=640&fit=bounds)

![Wk 3 - Market Penetration Plan [due Mon]Top of FormBottom of F.docx](https://cdn.slidesharecdn.com/ss_thumbnails/wk3-marketpenetrationplanduemontopofformbottomoff-221014054953-6ae1f510-thumbnail.jpg?width=640&height=640&fit=bounds)