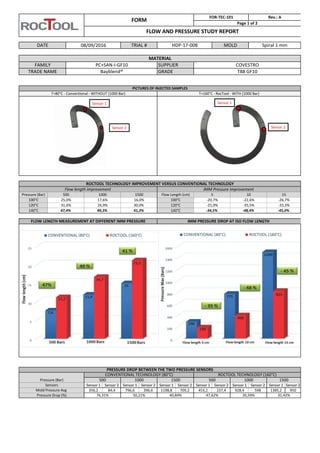
This document summarizes test results comparing conventional injection molding to Roctool technology at different temperatures. Key findings include:
1. Roctool technology at 140°C provided a 98% improvement in surface replication quality over conventional molding at 80°C, with glass fibers covered and defects removed.
2. Gloss was improved 81% with Roctool, achieving a perfect piano black finish. Color depth was not significantly impacted.
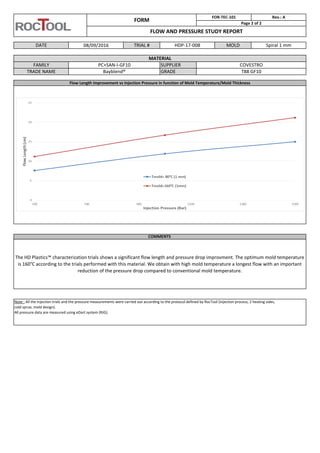
3. Flow length increased over 40% and pressure drop decreased around 35% with Roctool at 140°C compared to conventional molding at lower temperatures.