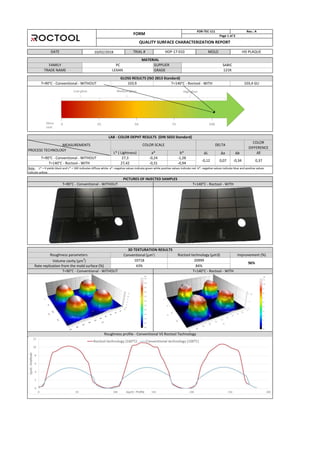
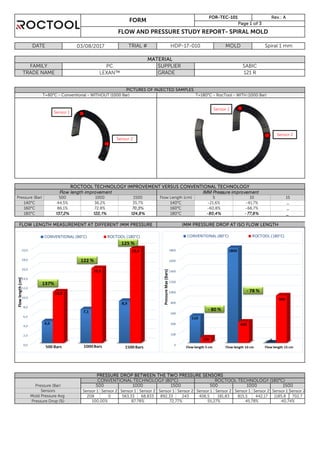
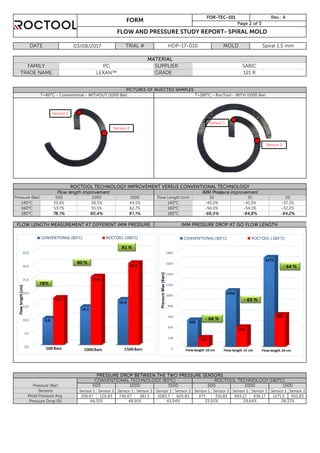
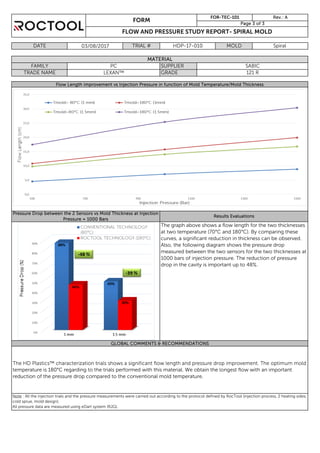
FULL HD PLASTIC ™ REPORT
ΔL Δa Δ
20999
43% 84%
96%
Volume cavity (µm3
)
Note: L* = 0 yields black and L* = 100 indicates diffuse white. a*: negative values indicate green while positive values indicate red. b*: negative values indicate blue and positive values
indicate yellow.
Roughness profile - Conventional VS Roctool Technology
T=140°C - Roctool - WITHT=90°C - Conventional - WITHOUT
PICTURES OF INJECTED SAMPLES
3D TEXTURATION RESULTS
T=90°C - Conventional - WITHOUT T=140°C - Roctool - WITH
Conventional (µm3
) Roctool technology (µm3) Improvement (%)Roughness parameters
10718
0,07
T=140°C - Roctool - WITH
SUPPLIER SABIC
0,37
ΔE
COLOR
DIFFERENCE
LAB - COLOR DEPHT RESULTS (DIN 5033 Standard)
-0,34
T=90°C - Conventional - WITHOUT
27,42 -0,31 -0,94
27,3
a*
-0,24
b*
-1,28
QUALITY SURFACE CHARACTERIZATION REPORT
LEXAN GRADE 121R
DATE
DELTACOLOR SCALE
L* ( Lightness)
MEASUREMENTS
PROCESS TECHNOLOGY
Rev.: A
GLOSS RESULTS (ISO 2813 Standard)
T=90°C - Conventional - WITHOUT 103,9 103,4 GUT=140°C - Roctool - WITH
TRADE NAME
-0,12
10/02/2018 TRIAL # HDP-17-010 MOLD HD PLAQUE
MATERIAL
FAMILY PC
FORM
FOR-TEC-111
Page 1 of 3
Rate replication from the mold surface (%)
CIM H&C CIM H&C CIM H&C
0,88 0,94 1,4 1,82 2,43 2,67
0,40 0,83 0,72 1,16 1,46 1,74
0,73 0,91 0,79 1,10 1,94 2,6
Rev.: A
Page 2 of 3
QUALITY SURFACE CHARACTERIZATION REPORT
%
VDI 27 (Ra=±2.20 µm)
10%7%
VDI 22 (Ra=±1.26 µm)
%
30%
Sa (µm)
Sa (µm)
LASER
19%
34%
108%
25% 39%
61%EDM
CHEMICAL
TEXTURE RESULTS - Ra (Amplitude roughnes parameter)
FORM
FOR-TEC-111
COMMENTS
Sa (µm)
VDI 18 (Ra=±0.80 µm)
%
Quality surface characterization:
1) Visible improvements using Roctool technology are observed: weld line are removed.
2) No significant improvement on the gloss value. However, we measured a small impact of the mold temperature on the color perception and
Roctool technology allows a darker color with a perfect surface finish compared to conventional process.
3) The different textured areas hightlight the positive impact on the replication using Roctool technology. Also, the different roughness are well
felt when touched. The roughness measurement carrie out using optical rugosimeter confirms the above with repliction rate of up to 84% : an
improvement of 96% with Roctool compared to conventional technology (CIM).
Note: CIM: Conventional Injection Molding.
Gloss is an optical property which indicates how well a surface reflects light
in a specular direction. It is one of important parameters that are used to
describe the visual appearance of an object. The factors that affect gloss are
the refractive index of the material, the angle of incident light and the
surface topography.
In the onte t of HD Plasti s™, a glossmeter is used to carried out the gloss
value with a incident angle of 60° : spectro-guide 45/0 gloss (BYK). HD
Plasti s™ is follo ing the ISO 8 Standard.
The graph shows the gloss scale using glossmeter following 60° angle in the
gloss unit. Low Gloss corresponds to a textured surface, Semi Gloss and
High Gloss to high polished surface.
MEASUREMENT AREAS
1) The high gloss area framed in blue is the measurement area for the gloss,
color and specific roughness Rz* .
2) The red rectangle define the nano-replication area.
3) The green box correspond to the multi-textured (VDI) area were the
roughness is measured.
*Rz: Maximal amplitude roughness mesured for filled materials
ROUGHNESS MEASUREMENT PRINCIPLE
Optical rugosimeter is a measuring instrument used to measure a surface's
profile, in order to quantify its roughness.
In the context of HD Plastics™, two information are carried out using
Alicona equipment according to the standard ISO 4287:
- Replication rate : volume of the specific texture defined versus the one
textured on the mold surface quavity
- The surface roughness parameters : Arithmetical mean deviation (Ra)
which evaluate the roughness amplitude on a profile and Mean roughness
depth (Rz) which measure the maximal amplitude roughness average of the
profile.
GLOSS PRINCIPLE
FORM
FOR-TEC-111 Rev.: A
Page 3 of 3
QUALITY SURFACE CHARACTERIZATION REPORT
ANNEXES
LAB COLOR PRINCIPLE
The Lab color space describes all perceivable colors in the three dimensions
L for lightness and a and for the olor opponents green–red and
lue– ello .
In the context of HD Plastics™, a spectrophotometer is used to carried out
the LAB alue : spe tro-guide / gloss BYK . HD Plasti s™ is follo ing the
DIN 5033 Standard.
The graph shows the LAB color scale. The lightness, L*, represents the
darkest black at L* = 0, and the brightest white at L* = 100. The a* and b*
value represent the color channels. a*: negative values indicate green while
positive values indicate red. b*: negative values indicate blue and positive
values indicate yellow
White
L* = 100
Black
L* = 0
Sensor 1 Sensor 2 Sensor 1 Sensor 2 Sensor 1 Sensor 2 Sensor 1 Sensor 2 Sensor 1 Sensor 2 Sensor 1 Sensor 2
208 0 563,33 68,833 892,33 243 406,5 181,83 815,5 442,17 1185,8 702,7
FORM
FOR-TEC-101 Rev.: A
Page 1 of 3
FLOW AND PRESSURE STUDY REPORT- SPIRAL MOLD
ROCTOOL TECHNOLOGY IMPROVEMENT VERSUS CONVENTIONAL TECHNOLOGY
TRADE NAME GRADE 121 R
PICTURES OF INJECTED SAMPLES
TRIAL # HDP-17-010 MOLD Spiral 1 mm
MATERIAL
FAMILY
03/08/2017DATE
180°C 137,2% 122,1% 124,8% 180°C - 80,4% - 77,8% _
FLOW LENGTH MEASUREMENT AT DIFFERENT IMM PRESSURE IMM PRESSURE DROP AT ISO FLOW LENGTH
SUPPLIER
15
SABIC
35,7% 140°C
500 1000 1500 Flow Length (cm) 5 10
Flow length improvement IMM Pressure improvement
T=80°C - Conventional - WITHOUT (1000 Bar)
PC
Pressure (Bar)
T=180°C - RocTool - WITH (1000 Bar)
160°C
140°C 44,5% 36,2% -21,6% -41,7% _
86,1% 72,8% 70,3% 160°C -60,8% -66,7% _
Mold Pressure Avg
Pressure Drop (%)
PRESSURE DROP BETWEEN THE TWO PRESSURE SENSORS
CONVENTIONAL TECHNOLOGY (80°C) ROCTOOL TECHNOLOGY (180°C)
Pressure (Bar) 500 1000 1500 500 1000 1500
100,00% 87,78% 72,77% 55,27% 45,78% 40,74%
Sensors
Sensor 1
Sensor 2
Sensor 1
Sensor 2
Sensor 1 Sensor 2 Sensor 1 Sensor 2 Sensor 1 Sensor 2 Sensor 1 Sensor 2 Sensor 1 Sensor 2 Sensor 1 Sensor 2
358,67 120,83 746,67 381,5 1080,7 605,83 473 316,83 904,17 636,17 1271,5 910,83
500 1000
66,31% 48,91% 43,94% 33,02%
FLOW LENGTH MEASUREMENT AT DIFFERENT IMM PRESSURE
FORM
T=180°C - RocTool - WITH (1000 Bar)
MATERIAL
FAMILY PC SABIC
TRADE NAME GRADE 121 R
FOR-TEC-101 Rev.: A
Page 2 of 3
FLOW AND PRESSURE STUDY REPORT- SPIRAL MOLD
DATE 03/08/2017
140°C -40,0% -41,0%
Pressure (Bar)
PICTURES OF INJECTED SAMPLES
62,7% 160°C
140°C
HDP-17-010 MOLD Spiral 1.5 mm
SUPPLIER
TRIAL #
PRESSURE DROP BETWEEN THE TWO PRESSURE SENSORS
-56,0%
15
-54,3% -52,2%
- 64,2%180°C 78,1% 80,4% 81,1% 180°C
55,5%53,7%160°C
- 66,0% - 64,8%
28,37%Pressure Drop (%)
Mold Pressure Avg
29,64%
Sensors
Pressure (Bar) 500 1000 1500
10
T=80°C - Conventional - WITHOUT (1000 Bar)
1500
ROCTOOL TECHNOLOGY (180°C)CONVENTIONAL TECHNOLOGY (80°C)
IMM PRESSURE DROP AT ISO FLOW LENGTH
33,6% 36,3%
1500
ROCTOOL TECHNOLOGY IMPROVEMENT VERSUS CONVENTIONAL TECHNOLOGY
Flow length improvement IMM Pressure improvement
20
-37,3%
500 1000 Flow Length (cm)
44,5%
Sensor 1
Sensor 2
Sensor 1
Sensor 2
FLOW AND PRESSURE STUDY REPORT- SPIRAL MOLD
DATE 03/08/2017 TRIAL # HDP-17-010 MOLD Spiral
FORM
FOR-TEC-101
Flow Length improvement vs Injection Pressure in function of Mold Temperature/Mold Thickness
MATERIAL
FAMILY PC SUPPLIER SABIC
TRADE NAME GRADE 121 R
Rev.: A
Page 3 of 3
Note : All the injection trials and the pressure measurements were carried out according to the protocol defined by RocTool (injection process, 2 heating sides,
cold sprue, mold design).
All pressure data are measured using eDart system (RJG).
Pressure Drop between the 2 Sensors vs Mold Thickness at Injection
Pressure = 1000 Bars
Results Evaluations
The graph above shows a flow length for the two thicknesses
at two temperature (70°C and 180°C). By comparing these
curves, a significant reduction in thickness can be observed.
Also, the following diagram shows the pressure drop
measured between the two sensors for the two thicknesses at
1000 bars of injection pressure. The reduction of pressure
drop in the cavity is important up to 48%.
GLOBAL COMMENTS & RECOMMENDATIONS
temperature is 180°C regarding to the trials performed with this material. We obtain the longest flow with an important
reduction of the pressure drop compared to the conventional mold temperature.

LEXAN121R

  • 1.
    FULL HD PLASTIC™ REPORT
  • 2.
    ΔL Δa Δ 20999 43%84% 96% Volume cavity (µm3 ) Note: L* = 0 yields black and L* = 100 indicates diffuse white. a*: negative values indicate green while positive values indicate red. b*: negative values indicate blue and positive values indicate yellow. Roughness profile - Conventional VS Roctool Technology T=140°C - Roctool - WITHT=90°C - Conventional - WITHOUT PICTURES OF INJECTED SAMPLES 3D TEXTURATION RESULTS T=90°C - Conventional - WITHOUT T=140°C - Roctool - WITH Conventional (µm3 ) Roctool technology (µm3) Improvement (%)Roughness parameters 10718 0,07 T=140°C - Roctool - WITH SUPPLIER SABIC 0,37 ΔE COLOR DIFFERENCE LAB - COLOR DEPHT RESULTS (DIN 5033 Standard) -0,34 T=90°C - Conventional - WITHOUT 27,42 -0,31 -0,94 27,3 a* -0,24 b* -1,28 QUALITY SURFACE CHARACTERIZATION REPORT LEXAN GRADE 121R DATE DELTACOLOR SCALE L* ( Lightness) MEASUREMENTS PROCESS TECHNOLOGY Rev.: A GLOSS RESULTS (ISO 2813 Standard) T=90°C - Conventional - WITHOUT 103,9 103,4 GUT=140°C - Roctool - WITH TRADE NAME -0,12 10/02/2018 TRIAL # HDP-17-010 MOLD HD PLAQUE MATERIAL FAMILY PC FORM FOR-TEC-111 Page 1 of 3 Rate replication from the mold surface (%)
  • 3.
    CIM H&C CIMH&C CIM H&C 0,88 0,94 1,4 1,82 2,43 2,67 0,40 0,83 0,72 1,16 1,46 1,74 0,73 0,91 0,79 1,10 1,94 2,6 Rev.: A Page 2 of 3 QUALITY SURFACE CHARACTERIZATION REPORT % VDI 27 (Ra=±2.20 µm) 10%7% VDI 22 (Ra=±1.26 µm) % 30% Sa (µm) Sa (µm) LASER 19% 34% 108% 25% 39% 61%EDM CHEMICAL TEXTURE RESULTS - Ra (Amplitude roughnes parameter) FORM FOR-TEC-111 COMMENTS Sa (µm) VDI 18 (Ra=±0.80 µm) % Quality surface characterization: 1) Visible improvements using Roctool technology are observed: weld line are removed. 2) No significant improvement on the gloss value. However, we measured a small impact of the mold temperature on the color perception and Roctool technology allows a darker color with a perfect surface finish compared to conventional process. 3) The different textured areas hightlight the positive impact on the replication using Roctool technology. Also, the different roughness are well felt when touched. The roughness measurement carrie out using optical rugosimeter confirms the above with repliction rate of up to 84% : an improvement of 96% with Roctool compared to conventional technology (CIM). Note: CIM: Conventional Injection Molding.
  • 4.
    Gloss is anoptical property which indicates how well a surface reflects light in a specular direction. It is one of important parameters that are used to describe the visual appearance of an object. The factors that affect gloss are the refractive index of the material, the angle of incident light and the surface topography. In the onte t of HD Plasti s™, a glossmeter is used to carried out the gloss value with a incident angle of 60° : spectro-guide 45/0 gloss (BYK). HD Plasti s™ is follo ing the ISO 8 Standard. The graph shows the gloss scale using glossmeter following 60° angle in the gloss unit. Low Gloss corresponds to a textured surface, Semi Gloss and High Gloss to high polished surface. MEASUREMENT AREAS 1) The high gloss area framed in blue is the measurement area for the gloss, color and specific roughness Rz* . 2) The red rectangle define the nano-replication area. 3) The green box correspond to the multi-textured (VDI) area were the roughness is measured. *Rz: Maximal amplitude roughness mesured for filled materials ROUGHNESS MEASUREMENT PRINCIPLE Optical rugosimeter is a measuring instrument used to measure a surface's profile, in order to quantify its roughness. In the context of HD Plastics™, two information are carried out using Alicona equipment according to the standard ISO 4287: - Replication rate : volume of the specific texture defined versus the one textured on the mold surface quavity - The surface roughness parameters : Arithmetical mean deviation (Ra) which evaluate the roughness amplitude on a profile and Mean roughness depth (Rz) which measure the maximal amplitude roughness average of the profile. GLOSS PRINCIPLE FORM FOR-TEC-111 Rev.: A Page 3 of 3 QUALITY SURFACE CHARACTERIZATION REPORT ANNEXES LAB COLOR PRINCIPLE The Lab color space describes all perceivable colors in the three dimensions L for lightness and a and for the olor opponents green–red and lue– ello . In the context of HD Plastics™, a spectrophotometer is used to carried out the LAB alue : spe tro-guide / gloss BYK . HD Plasti s™ is follo ing the DIN 5033 Standard. The graph shows the LAB color scale. The lightness, L*, represents the darkest black at L* = 0, and the brightest white at L* = 100. The a* and b* value represent the color channels. a*: negative values indicate green while positive values indicate red. b*: negative values indicate blue and positive values indicate yellow White L* = 100 Black L* = 0
  • 5.
    Sensor 1 Sensor2 Sensor 1 Sensor 2 Sensor 1 Sensor 2 Sensor 1 Sensor 2 Sensor 1 Sensor 2 Sensor 1 Sensor 2 208 0 563,33 68,833 892,33 243 406,5 181,83 815,5 442,17 1185,8 702,7 FORM FOR-TEC-101 Rev.: A Page 1 of 3 FLOW AND PRESSURE STUDY REPORT- SPIRAL MOLD ROCTOOL TECHNOLOGY IMPROVEMENT VERSUS CONVENTIONAL TECHNOLOGY TRADE NAME GRADE 121 R PICTURES OF INJECTED SAMPLES TRIAL # HDP-17-010 MOLD Spiral 1 mm MATERIAL FAMILY 03/08/2017DATE 180°C 137,2% 122,1% 124,8% 180°C - 80,4% - 77,8% _ FLOW LENGTH MEASUREMENT AT DIFFERENT IMM PRESSURE IMM PRESSURE DROP AT ISO FLOW LENGTH SUPPLIER 15 SABIC 35,7% 140°C 500 1000 1500 Flow Length (cm) 5 10 Flow length improvement IMM Pressure improvement T=80°C - Conventional - WITHOUT (1000 Bar) PC Pressure (Bar) T=180°C - RocTool - WITH (1000 Bar) 160°C 140°C 44,5% 36,2% -21,6% -41,7% _ 86,1% 72,8% 70,3% 160°C -60,8% -66,7% _ Mold Pressure Avg Pressure Drop (%) PRESSURE DROP BETWEEN THE TWO PRESSURE SENSORS CONVENTIONAL TECHNOLOGY (80°C) ROCTOOL TECHNOLOGY (180°C) Pressure (Bar) 500 1000 1500 500 1000 1500 100,00% 87,78% 72,77% 55,27% 45,78% 40,74% Sensors Sensor 1 Sensor 2 Sensor 1 Sensor 2
  • 6.
    Sensor 1 Sensor2 Sensor 1 Sensor 2 Sensor 1 Sensor 2 Sensor 1 Sensor 2 Sensor 1 Sensor 2 Sensor 1 Sensor 2 358,67 120,83 746,67 381,5 1080,7 605,83 473 316,83 904,17 636,17 1271,5 910,83 500 1000 66,31% 48,91% 43,94% 33,02% FLOW LENGTH MEASUREMENT AT DIFFERENT IMM PRESSURE FORM T=180°C - RocTool - WITH (1000 Bar) MATERIAL FAMILY PC SABIC TRADE NAME GRADE 121 R FOR-TEC-101 Rev.: A Page 2 of 3 FLOW AND PRESSURE STUDY REPORT- SPIRAL MOLD DATE 03/08/2017 140°C -40,0% -41,0% Pressure (Bar) PICTURES OF INJECTED SAMPLES 62,7% 160°C 140°C HDP-17-010 MOLD Spiral 1.5 mm SUPPLIER TRIAL # PRESSURE DROP BETWEEN THE TWO PRESSURE SENSORS -56,0% 15 -54,3% -52,2% - 64,2%180°C 78,1% 80,4% 81,1% 180°C 55,5%53,7%160°C - 66,0% - 64,8% 28,37%Pressure Drop (%) Mold Pressure Avg 29,64% Sensors Pressure (Bar) 500 1000 1500 10 T=80°C - Conventional - WITHOUT (1000 Bar) 1500 ROCTOOL TECHNOLOGY (180°C)CONVENTIONAL TECHNOLOGY (80°C) IMM PRESSURE DROP AT ISO FLOW LENGTH 33,6% 36,3% 1500 ROCTOOL TECHNOLOGY IMPROVEMENT VERSUS CONVENTIONAL TECHNOLOGY Flow length improvement IMM Pressure improvement 20 -37,3% 500 1000 Flow Length (cm) 44,5% Sensor 1 Sensor 2 Sensor 1 Sensor 2
  • 7.
    FLOW AND PRESSURESTUDY REPORT- SPIRAL MOLD DATE 03/08/2017 TRIAL # HDP-17-010 MOLD Spiral FORM FOR-TEC-101 Flow Length improvement vs Injection Pressure in function of Mold Temperature/Mold Thickness MATERIAL FAMILY PC SUPPLIER SABIC TRADE NAME GRADE 121 R Rev.: A Page 3 of 3 Note : All the injection trials and the pressure measurements were carried out according to the protocol defined by RocTool (injection process, 2 heating sides, cold sprue, mold design). All pressure data are measured using eDart system (RJG). Pressure Drop between the 2 Sensors vs Mold Thickness at Injection Pressure = 1000 Bars Results Evaluations The graph above shows a flow length for the two thicknesses at two temperature (70°C and 180°C). By comparing these curves, a significant reduction in thickness can be observed. Also, the following diagram shows the pressure drop measured between the two sensors for the two thicknesses at 1000 bars of injection pressure. The reduction of pressure drop in the cavity is important up to 48%. GLOBAL COMMENTS & RECOMMENDATIONS temperature is 180°C regarding to the trials performed with this material. We obtain the longest flow with an important reduction of the pressure drop compared to the conventional mold temperature.