Download as PDF, PPTX

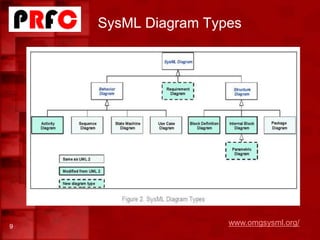
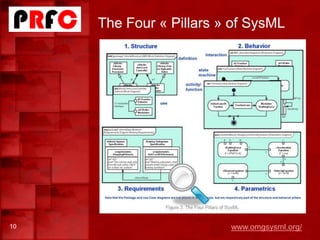
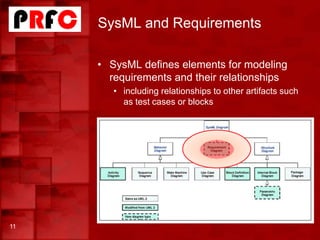
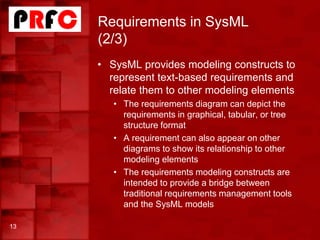
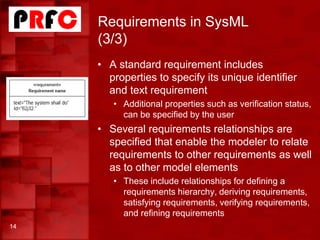
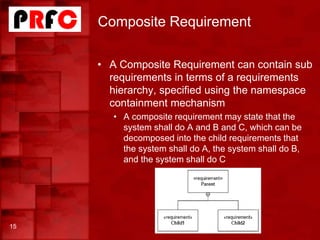
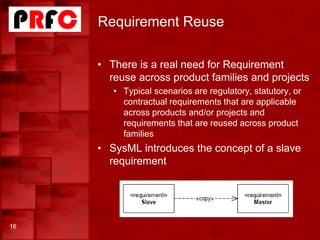
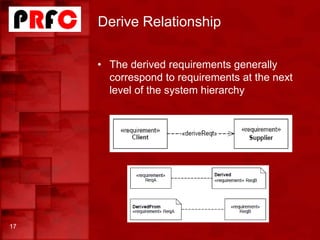
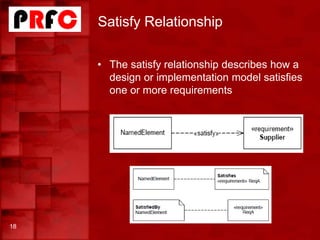
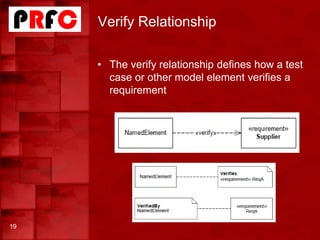
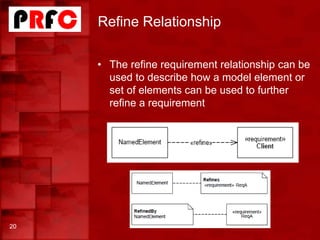
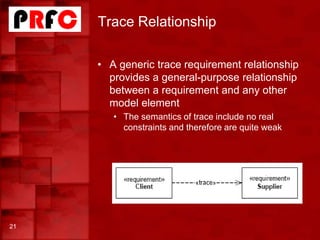
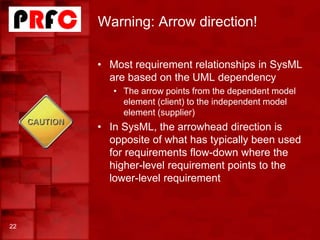
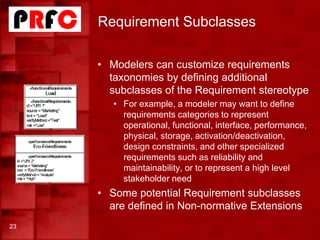
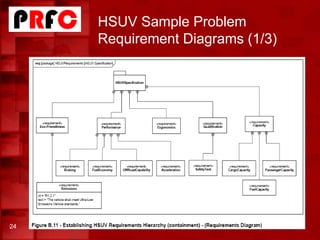

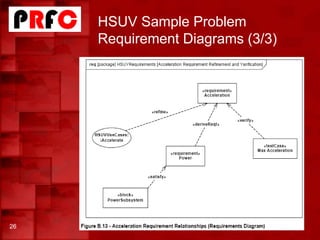
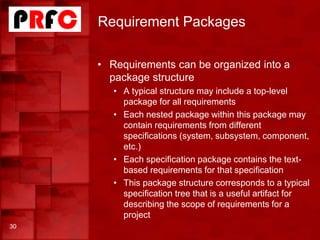
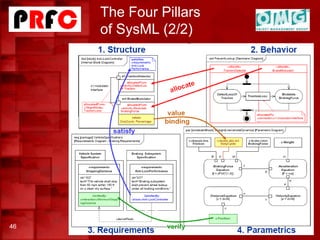
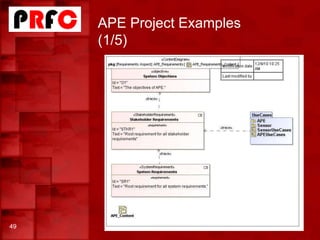
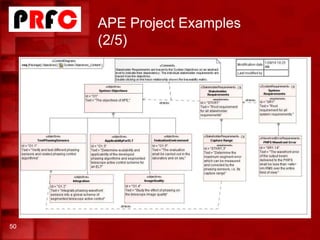
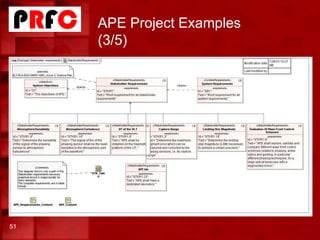
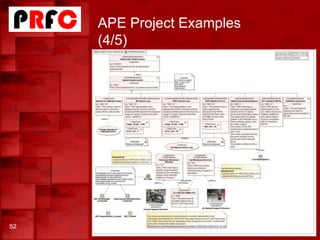
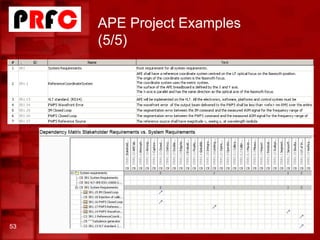
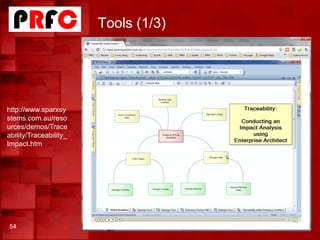
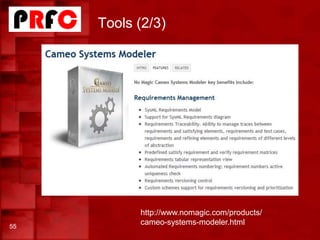
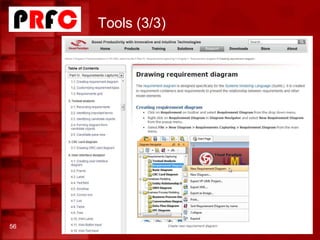
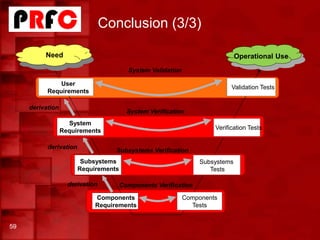

Pascal Roques gave a tutorial on requirements modeling with SysML. SysML is a graphical modeling language for specifying, analyzing, designing, and verifying complex systems. It provides constructs for modeling requirements and relating them to other system elements. Requirements can be organized hierarchically and related to other artifacts through trace, derive, satisfy, verify, and refine relationships. Industrial examples demonstrated how SysML enables improved collaboration, traceability, and management of requirements.


![Getting Started with Apache Spark: Big Data Made Simple [Free Meetup]](https://cdn.slidesharecdn.com/ss_thumbnails/apachesparkgettingstarted-260203175547-8361bcc3-thumbnail.jpg?width=640&height=640&fit=bounds)


