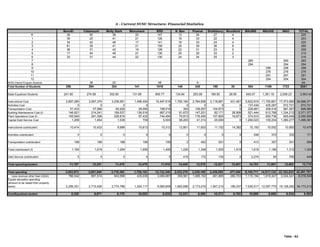
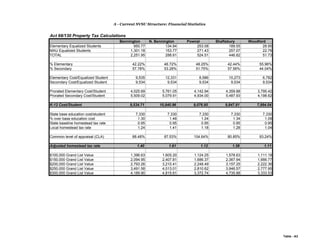
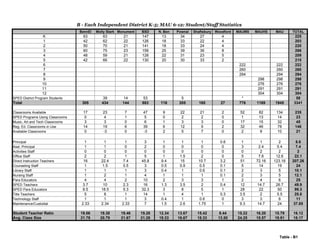
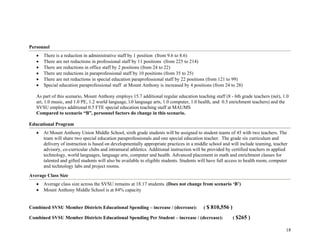
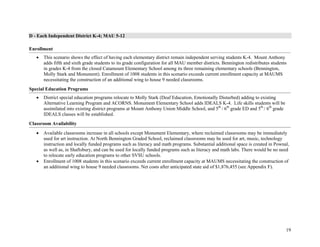
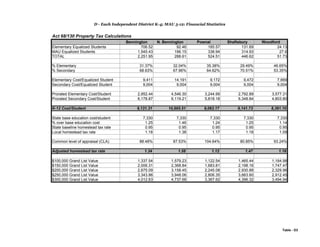
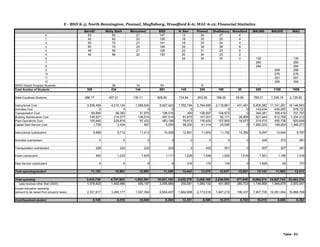
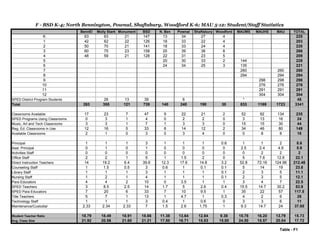
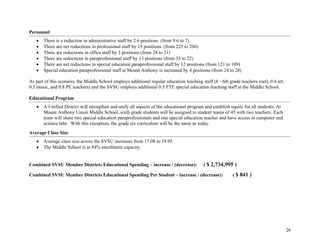
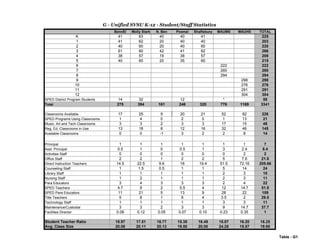
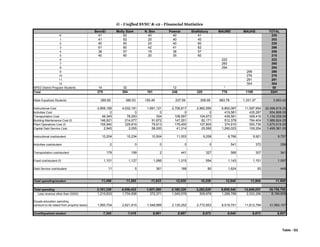
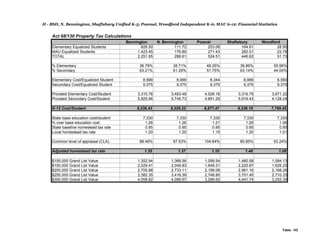
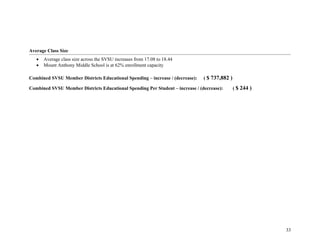
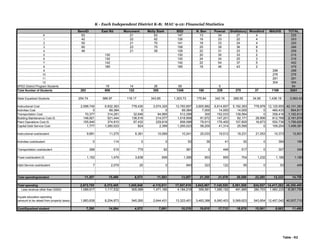
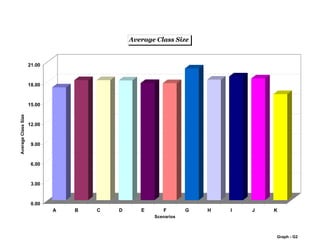
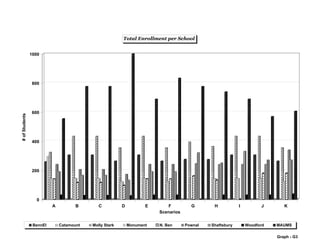
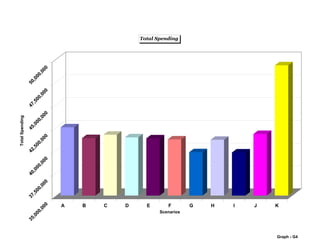
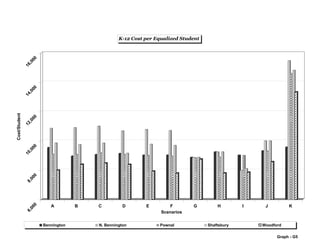
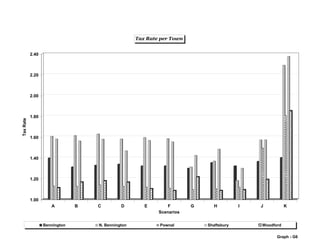
This document summarizes a study conducted by the Southwest Vermont Supervisory Union examining options for redistributing students within member school districts. It analyzed over 50 potential scenarios and ultimately focused on 10 scenarios. For each scenario, it provides statistics on student enrollment, classroom use, staffing, and financial impacts. The document aims to balance the needs of students, communities, taxpayers, and recommend the best option for students. It uses common factors to compare the current structure and potential scenarios and determine costs or savings. The findings were presented to school boards to help inform future decisions.
![48
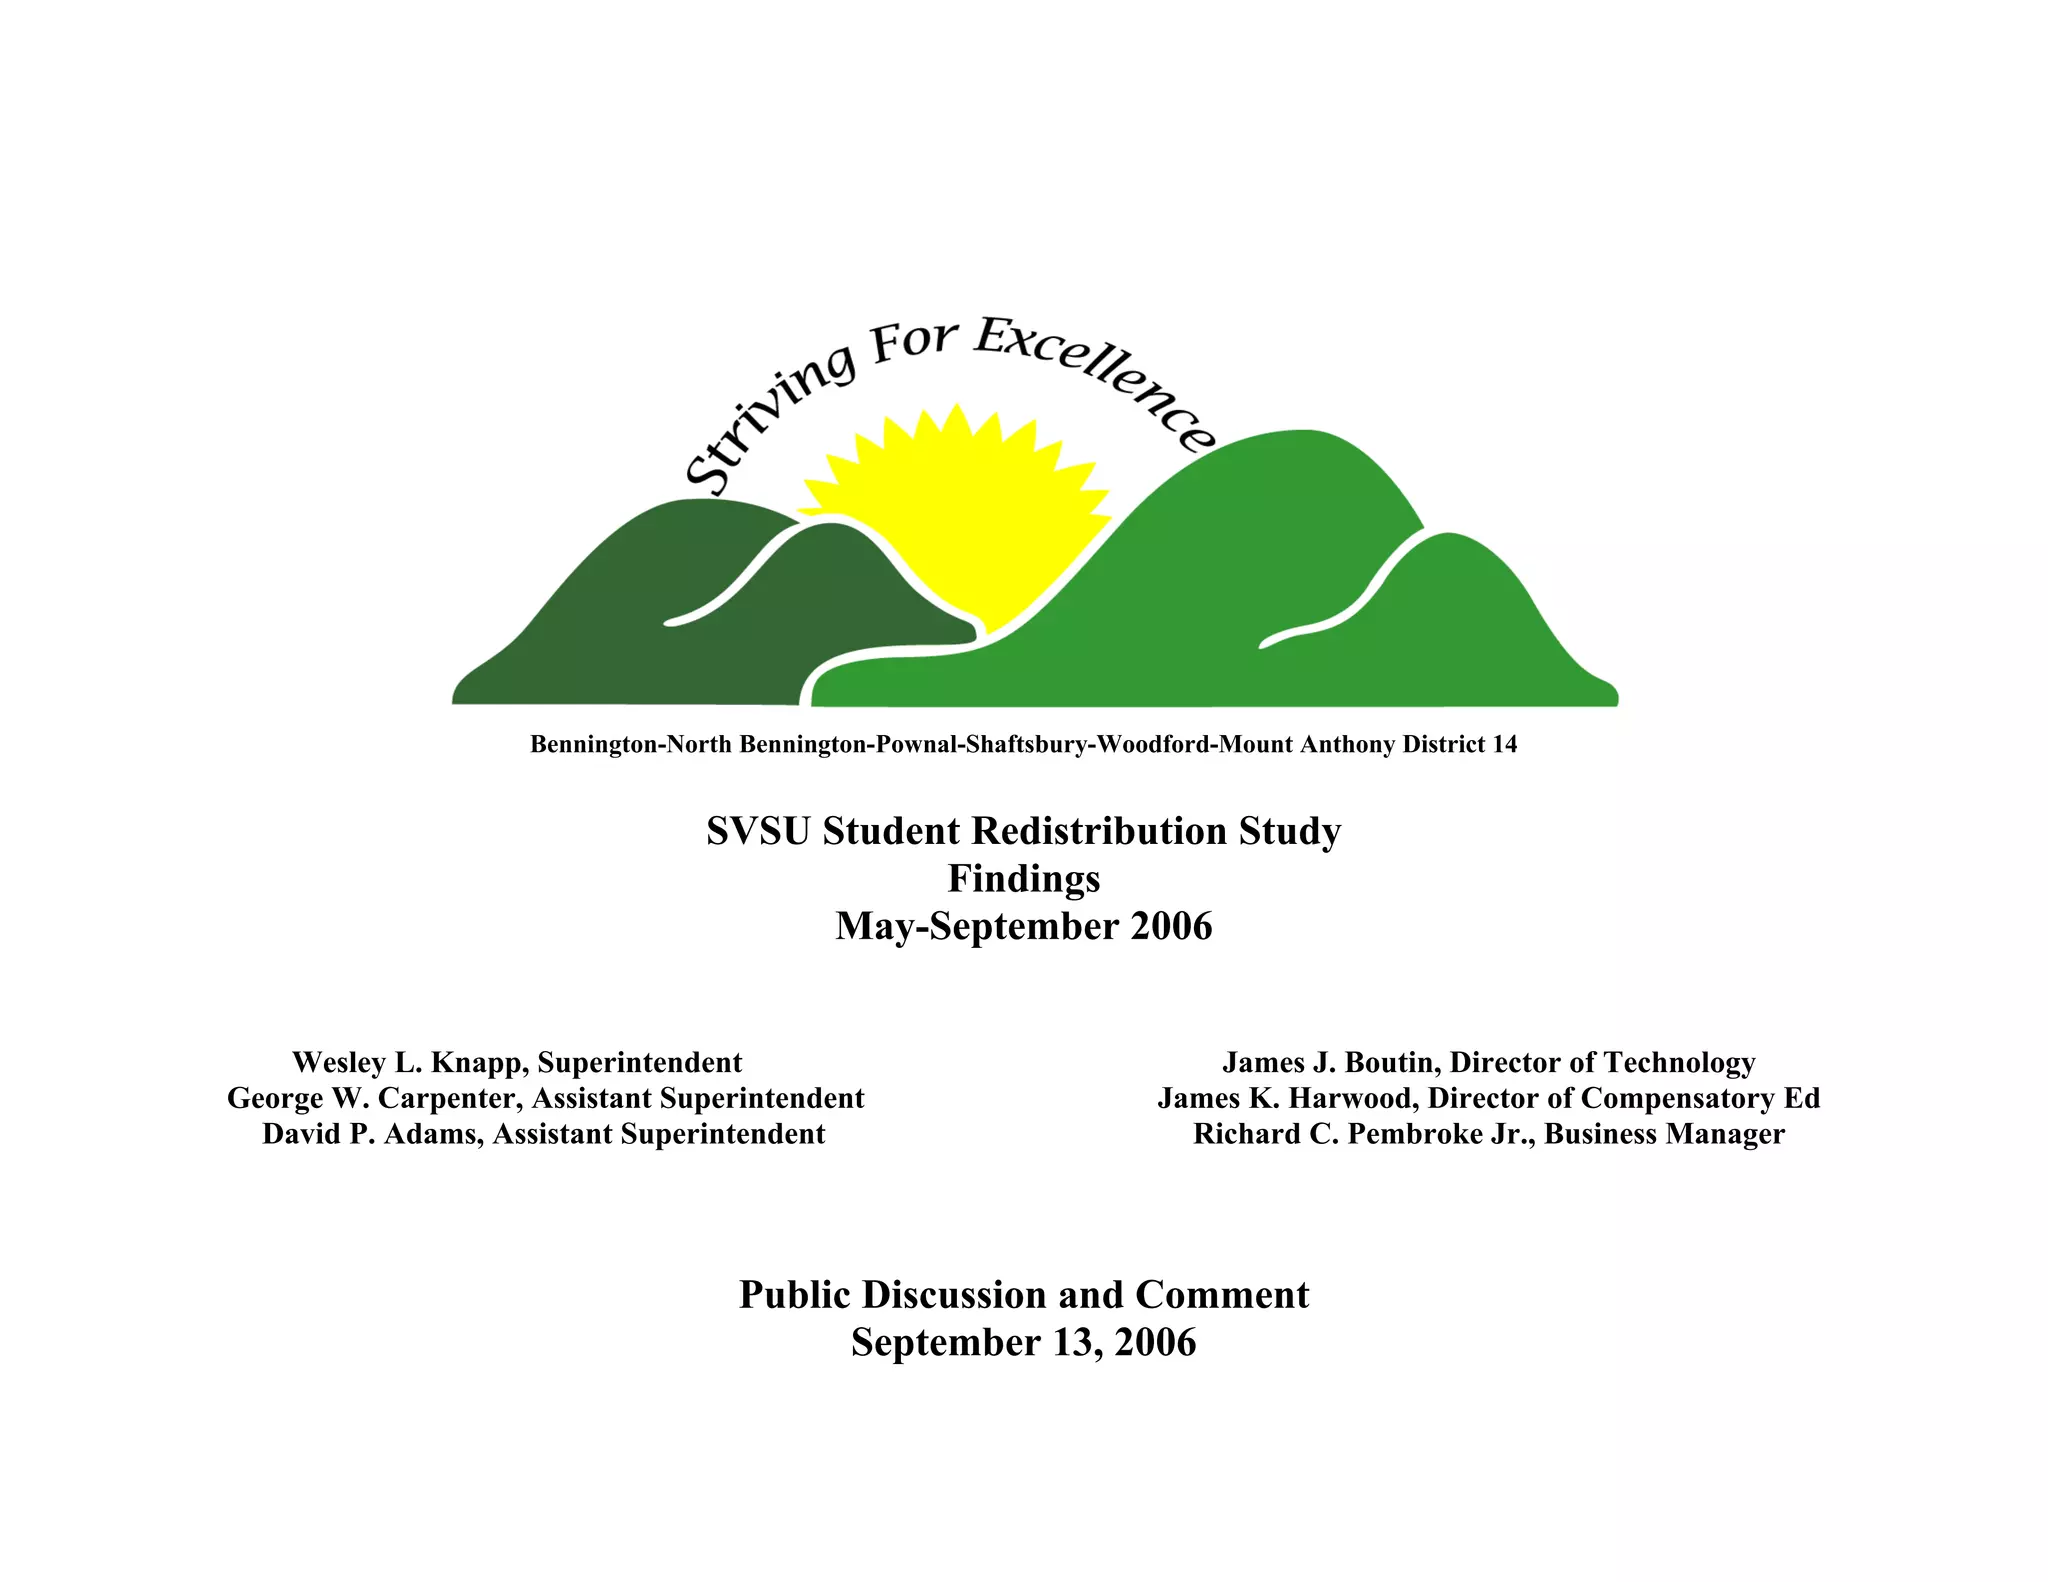
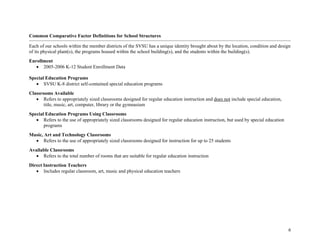
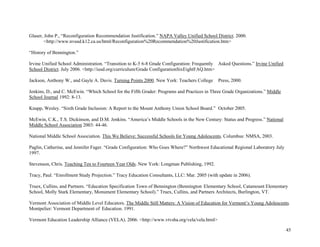
Appendix B
7/19/06 DRAFT
ABC SCHOOL BOARD POLICY
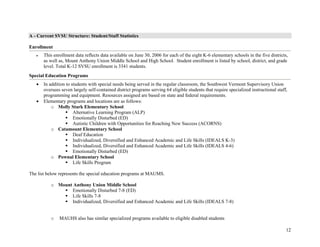
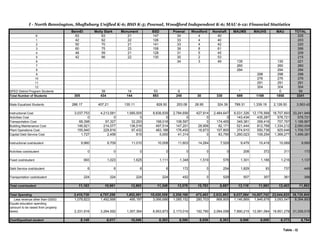
ADMISSION OF NON-RESIDENT TUITION STUDENTS
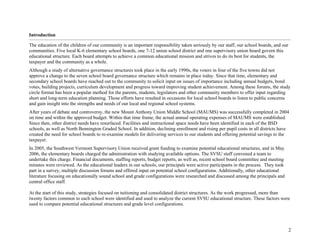
It shall be the policy of the ABC School District (the “District”) to enroll non-
resident students under such terms and restrictions as the District deems best, where, in
the discretion of the District and school administrators, there is space and it is
determined that enrollments of such non-resident students will not diminish or dilute
program opportunities for students who are residents of the District. Students shall
only be admitted under the terms of this policy, and where applicable, a duly executed
enrollment agreement, and parental placements of non-resident students shall not be
accepted.
A. ADMISSION
1. Non-discrimination. No child will be denied admission on the basis of sex,
creed, color, sexual orientation, marital status, national origin, race, disability,
and/or the need for special education services.
2. Town of Choice students. Pursuant to a duly issued voucher from the Sending
District, the School will give preference to accepting non-resident students who are
legal residents of [list other district within SU]. See subsection C.4. regarding
the requirement of an additional enrollment agreement for a special education or 504
student.
3. Long-term suspension or expulsion. Pursuant to the SWVSU Continuance of An
Expulsion or Suspension Policy # __, the District shall honor long term suspensions
or expulsions imposed on students by other school districts, where application is
made for admission of such non-resident students to the District.
4. Application Process. The parents of a prospective student must complete an
application for the school in which (s)he wishes to enroll, and participate in an
initial interview. Academic records, attendance records and records of any](https://image.slidesharecdn.com/9c567bfe-32e4-45db-a965-73ac0c001581-160904200011/85/SVSUStudentRedistributionStudy-91-320.jpg)
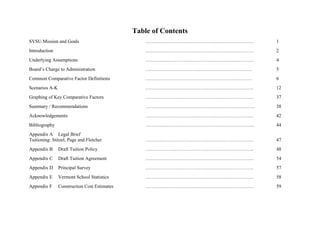
![50
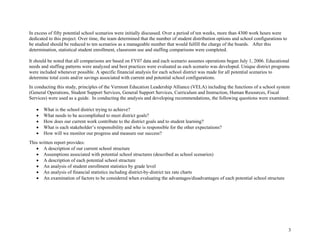
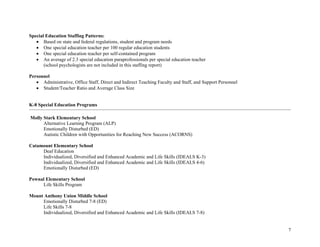
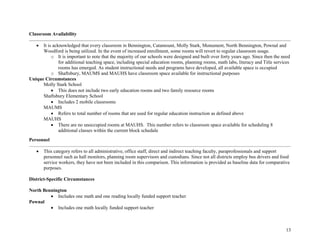
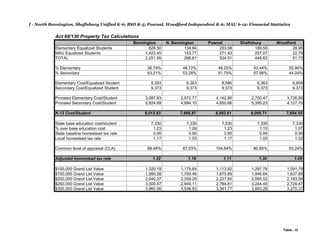
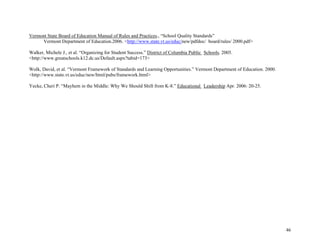
disciplinary proceedings. See section C.8. for additional information about special
education or 504 students.
2. Tuition. Tuition rates will be established in accord with Chapter 21 of Title
16 of the Vermont Statutes Annotated, and pertinent regulations of the State Board
of Education. [[Note: if using the “lower of the two rates language,” it will need
to be added here]]
3. Vouchers. The parent or guardian of the student will obtain a voucher from the
appropriate authority within the Sending District (their town of residence) and
present the voucher upon enrollment. A student shall not be admitted without
appropriate documentation from the responsible Sending District that is undertaking
to pay the full costs of placement. [[Note: Districts should decide if they wish to
use vouchers or some other mutually acceptable and binding means of
payment/committing to cost.]]
4. Terms of Payment. Tuition for non-resident students shall be payable [in
full] [upon issuance of an invoice] [no later than the time of enrollment] [at any
time prior to enrollment]. A pro rata tuition payment will be payable for a student
who enrolls after the beginning of a semester.
C. SPECIAL EDUCATION AND 504 SERVICES.
1. Admissions Provisions. The prospective student’s Parents must complete a
____________ School application, and participate in an initial informational meeting
with the Principal or principal’s designee. Academic records, attendance records
and records of any involvement in incidents resulting in disciplinary action must be
submitted by the student at the time of the initial informational meeting.
2. Pre-Application Consideration. Prior to application, a representative of the
District will attend an IEP or 504 team meeting held by the Sending District, at
which the team will consider the services and accommodations called for by the IEP
or 504 plan, and if those services and accommodations are or readily can be made
available at the ____________ School (for example, special day treatment program or
residential services are not available at ___________________). If there is
consensus that the ________ School can meet the student’s needs, the student’s
application may then be processed. If there are special staffing needs (for](https://image.slidesharecdn.com/9c567bfe-32e4-45db-a965-73ac0c001581-160904200011/85/SVSUStudentRedistributionStudy-93-320.jpg)
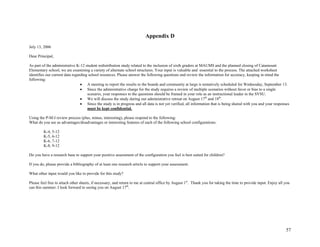
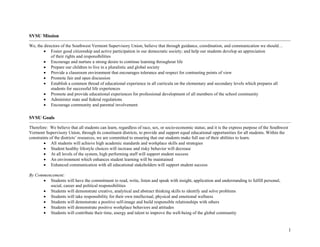
![59
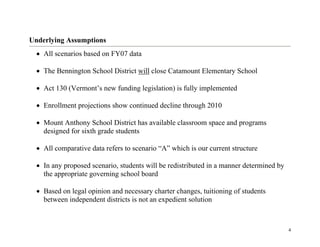
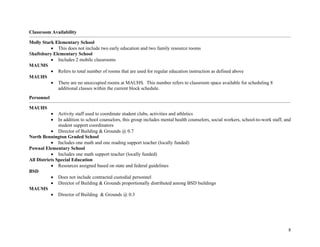
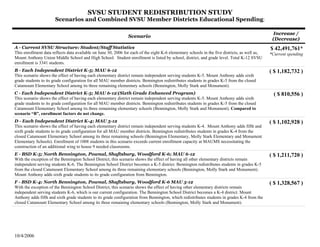
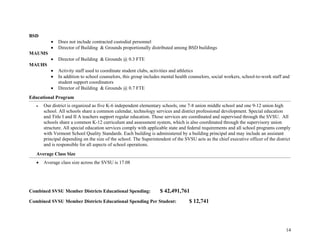
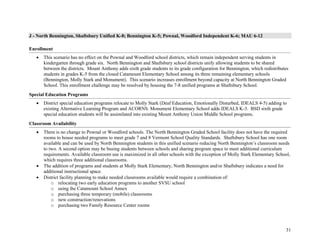
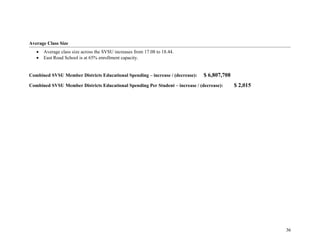
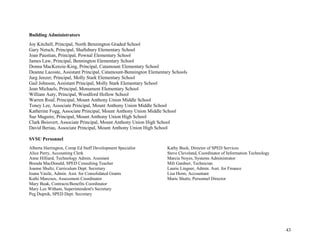
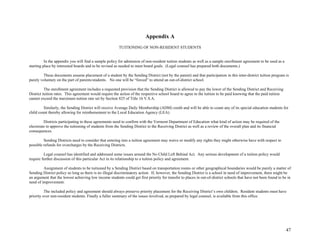
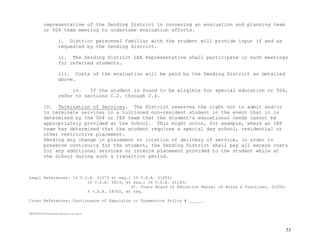
Appendix F
From: David Epstein [mailto:DEpstein@TruexCullins.com]
Sent: Thursday, August 31, 2006 12:11 PM
To: Richard Pembroke
Subject: RE: Molly Stark Elementary School
Hi Rick,
Hope I caught you in time.
I just spoke with Henry Erickson, our cost estimator for the Molly Stark project. He felt that my numbers are a bit low and suggested that $175 to $225 would be a
more likely range for quality school construction with site work. It’s difficult to be more specific at this time. I would recommend carrying $175 for building and
$200/SF with site work to be safe.
David.
From: David Epstein
Sent: Thursday, August 31, 2006 10:57 AM
To: rpembroke@svsu.org
Subject: FW: Molly Stark Elementary School
Hi Rick,
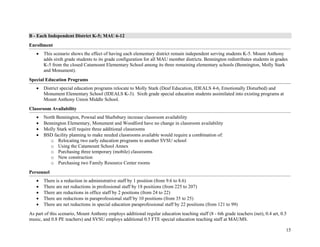
6th grade wing:
The existing 6th grade wing at MAUMS is 15,318 SF.
It has 9 classrooms, 4 of which are regular size (800), 2 which are at 1000, 2 science labs at 1450 and a project room at 850.
As I recall, we designed the wing for 200. This would be 25 students per classroom and 1 project room.
(Because of the large size of 4 classrooms, you could definitely fit more than 25 students in. It really becomes a classroom management issue and would
potentially require more staff. Also, the project room could be used as a classroom.)
Construction Cost:
I have taken a look at Means Square Foot Costs 2006 and have extrapolated the MAUMS construction numbers. Assuming construction occurs in 2008, I would
recommend $160/SF for new building construction and $175/SF for new construction with site work. This includes a 5 % escalation contingency for years 2007
and 2008. I have a call in to a construction estimator and will email you when I connect with him although it may be after your deadline.
Currently the state is paying 30% of $146 per sf for K-6 and $154 per sf for Middle School. $3 per sf (of site work, not building) for site work in either case.
SF per student:
The State of VT standards (for reimbursement purposes) is 140sf per student for K-6 and 160sf for Middle School. We often use 150 per sf for elementary school
planning - this offers the possibility of a separate gym and cafeteria.
I hope this is helpful. Let us know if you need any other info.](https://image.slidesharecdn.com/9c567bfe-32e4-45db-a965-73ac0c001581-160904200011/85/SVSUStudentRedistributionStudy-102-320.jpg)


![School Title 1 plan final[1]](https://cdn.slidesharecdn.com/ss_thumbnails/schooltitle1planfinal1-100827170125-phpapp02-thumbnail.jpg?width=640&height=640&fit=bounds)


