The contour map properties dialog allows you to modify several properties of contour maps, including:
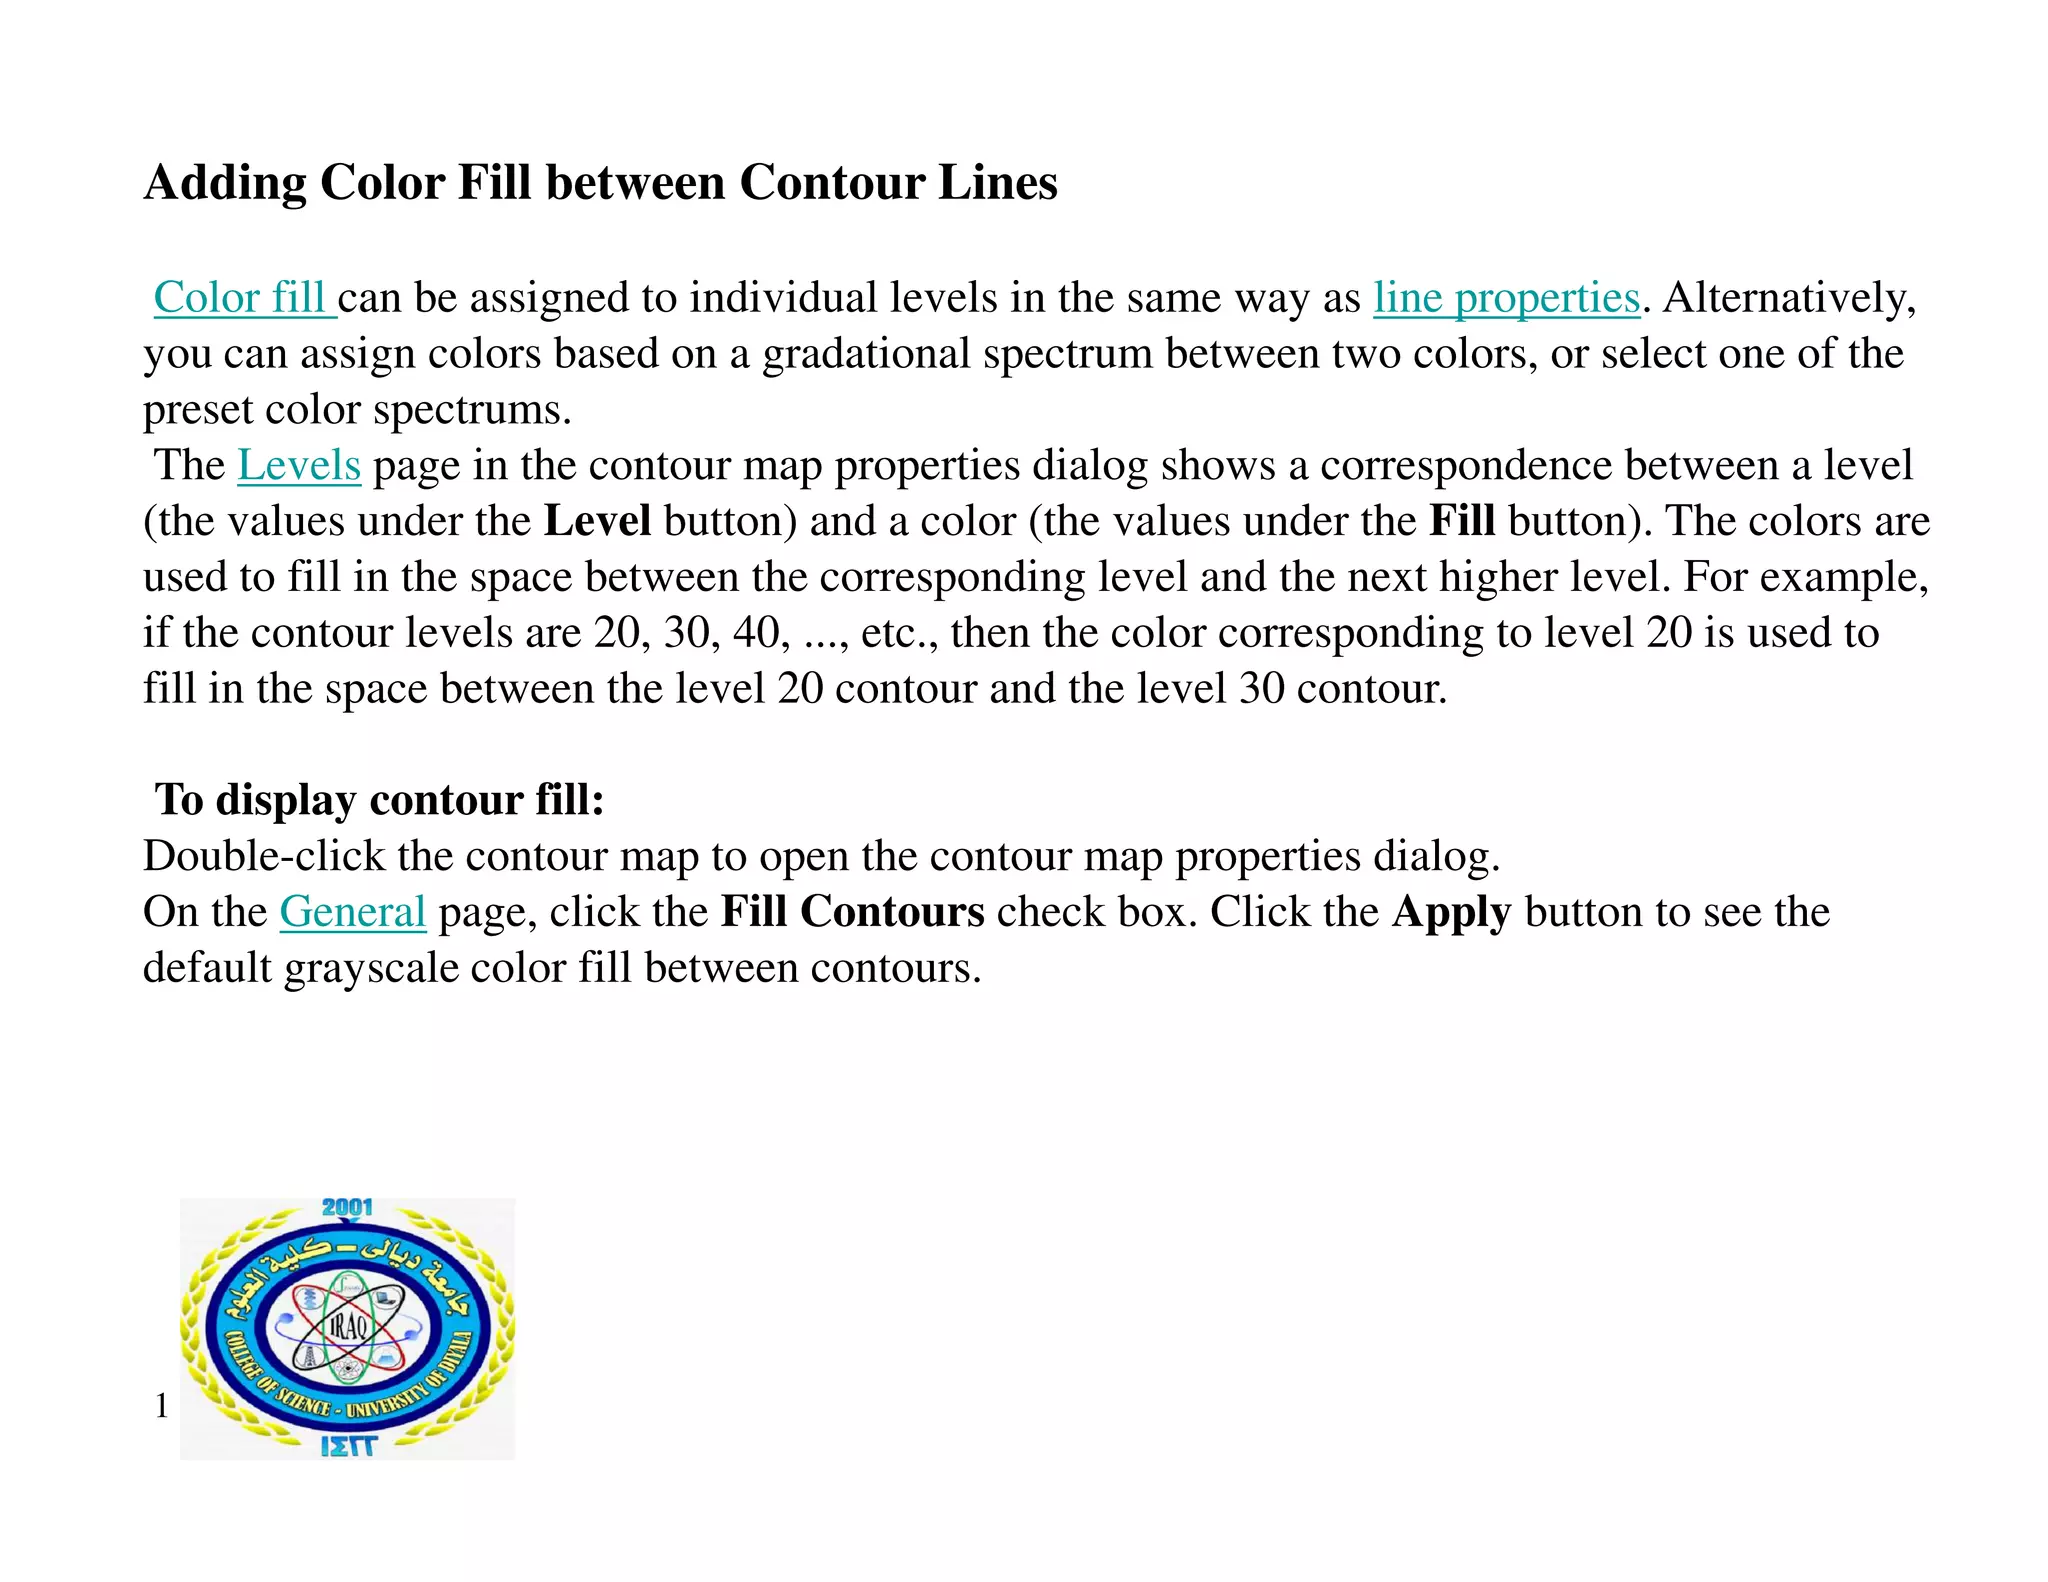
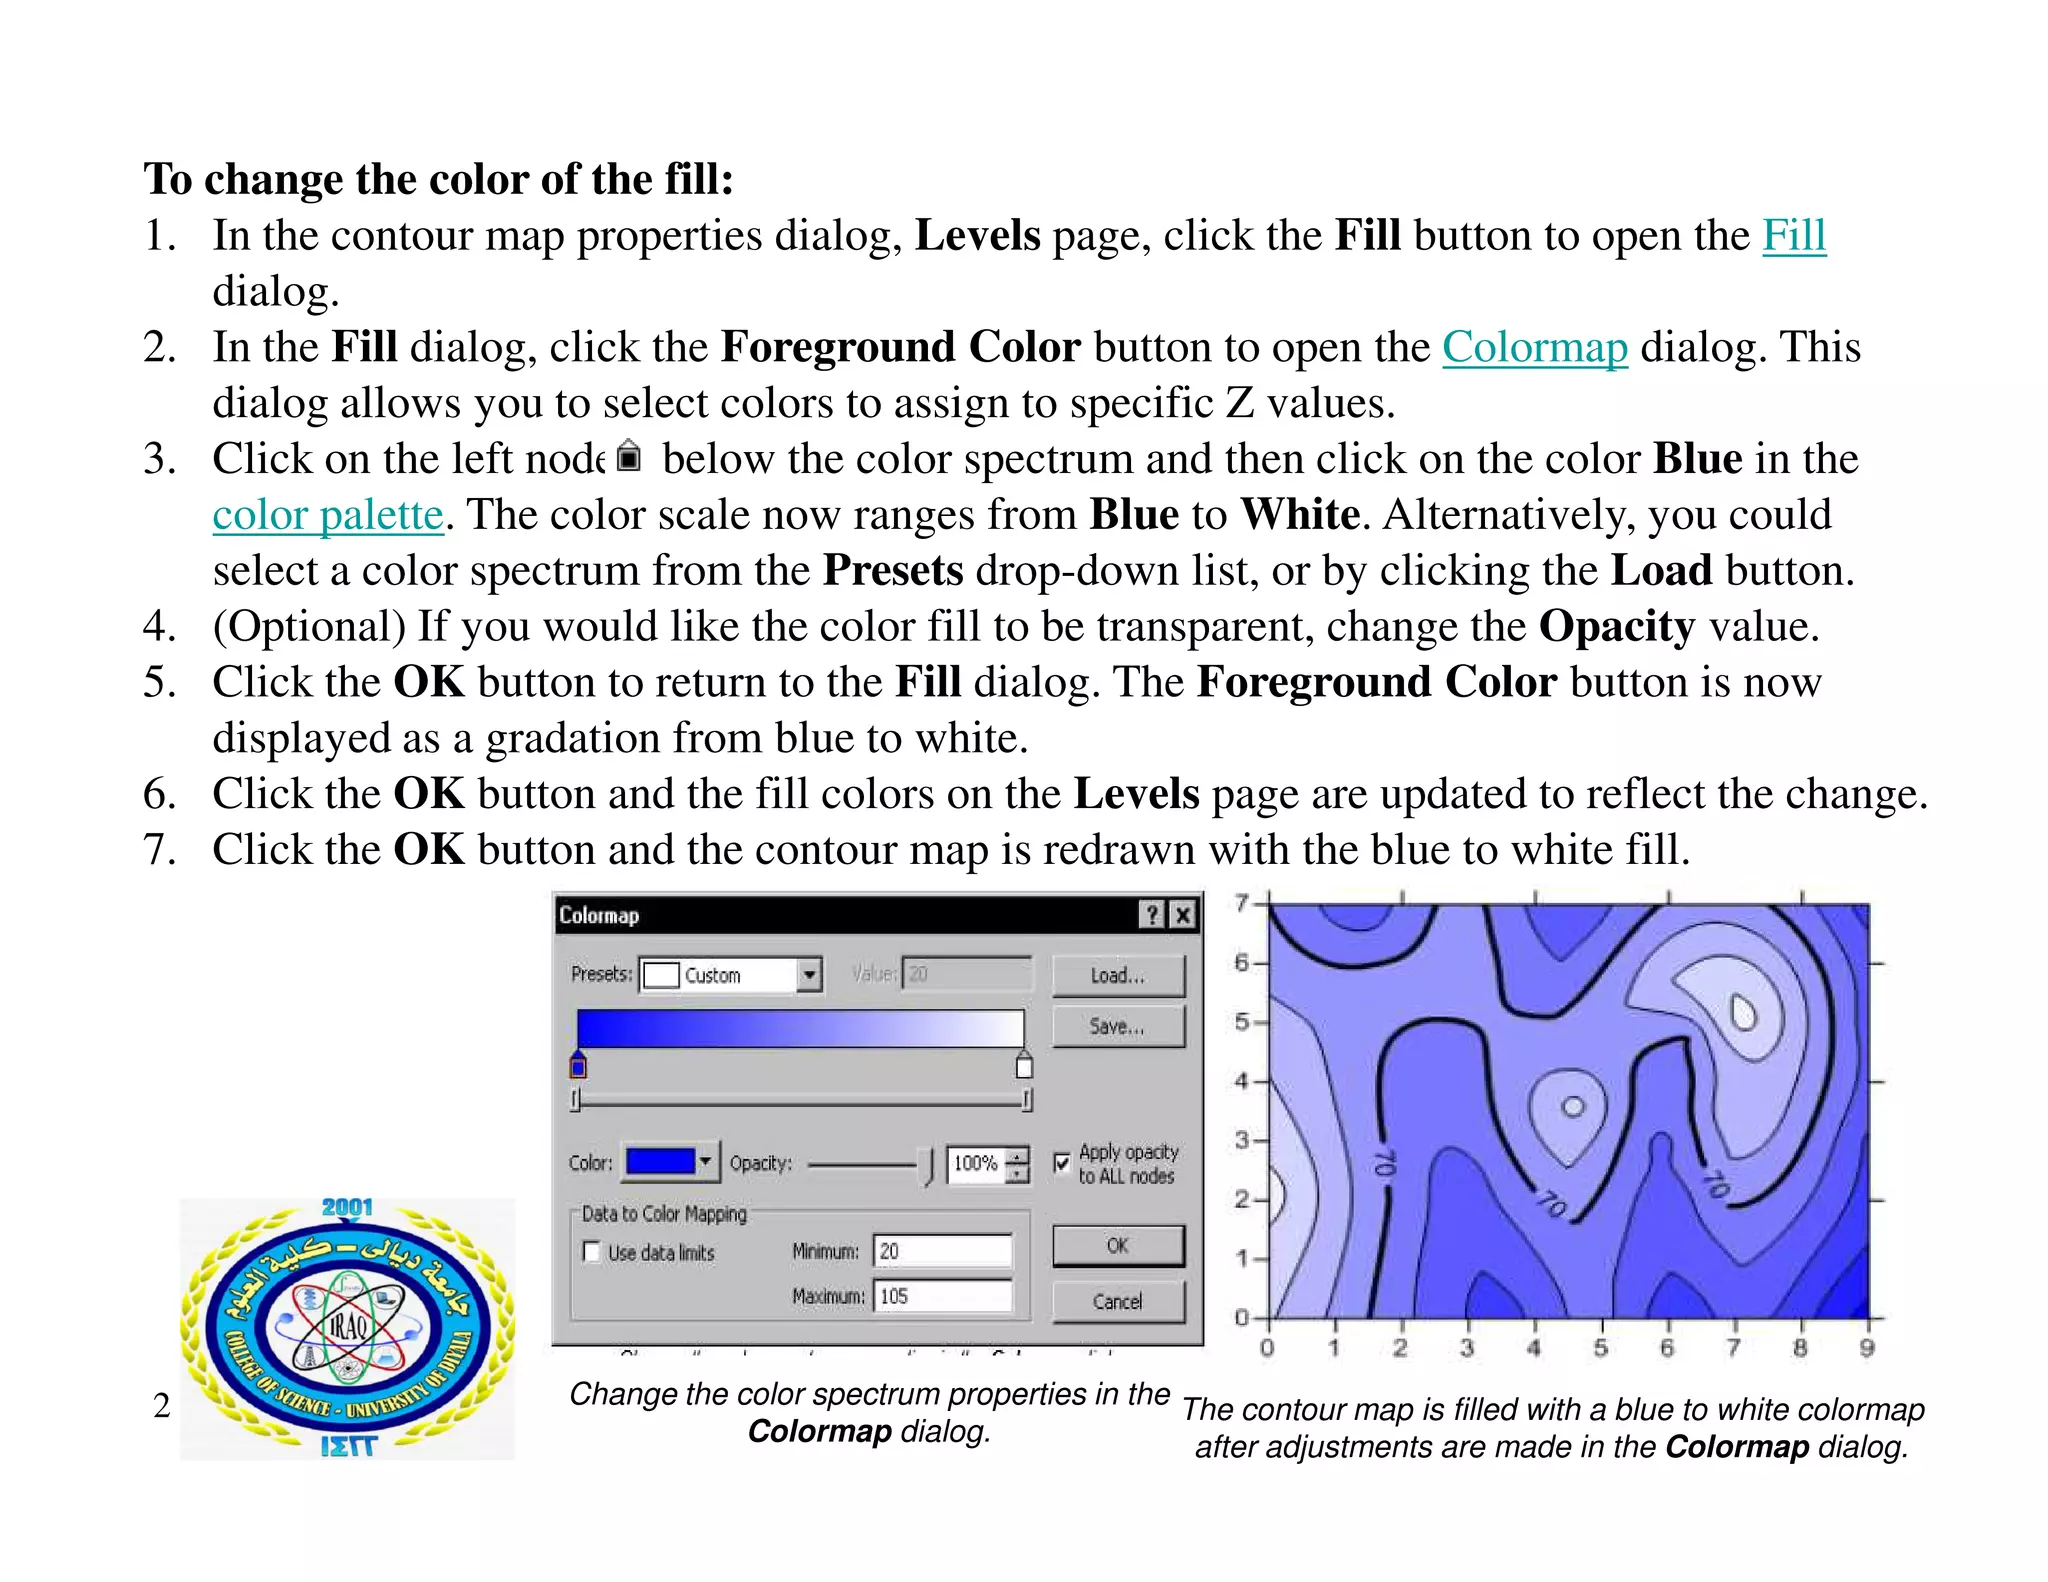
1. Adding color fill between contour lines by selecting colors in the Colormap dialog.
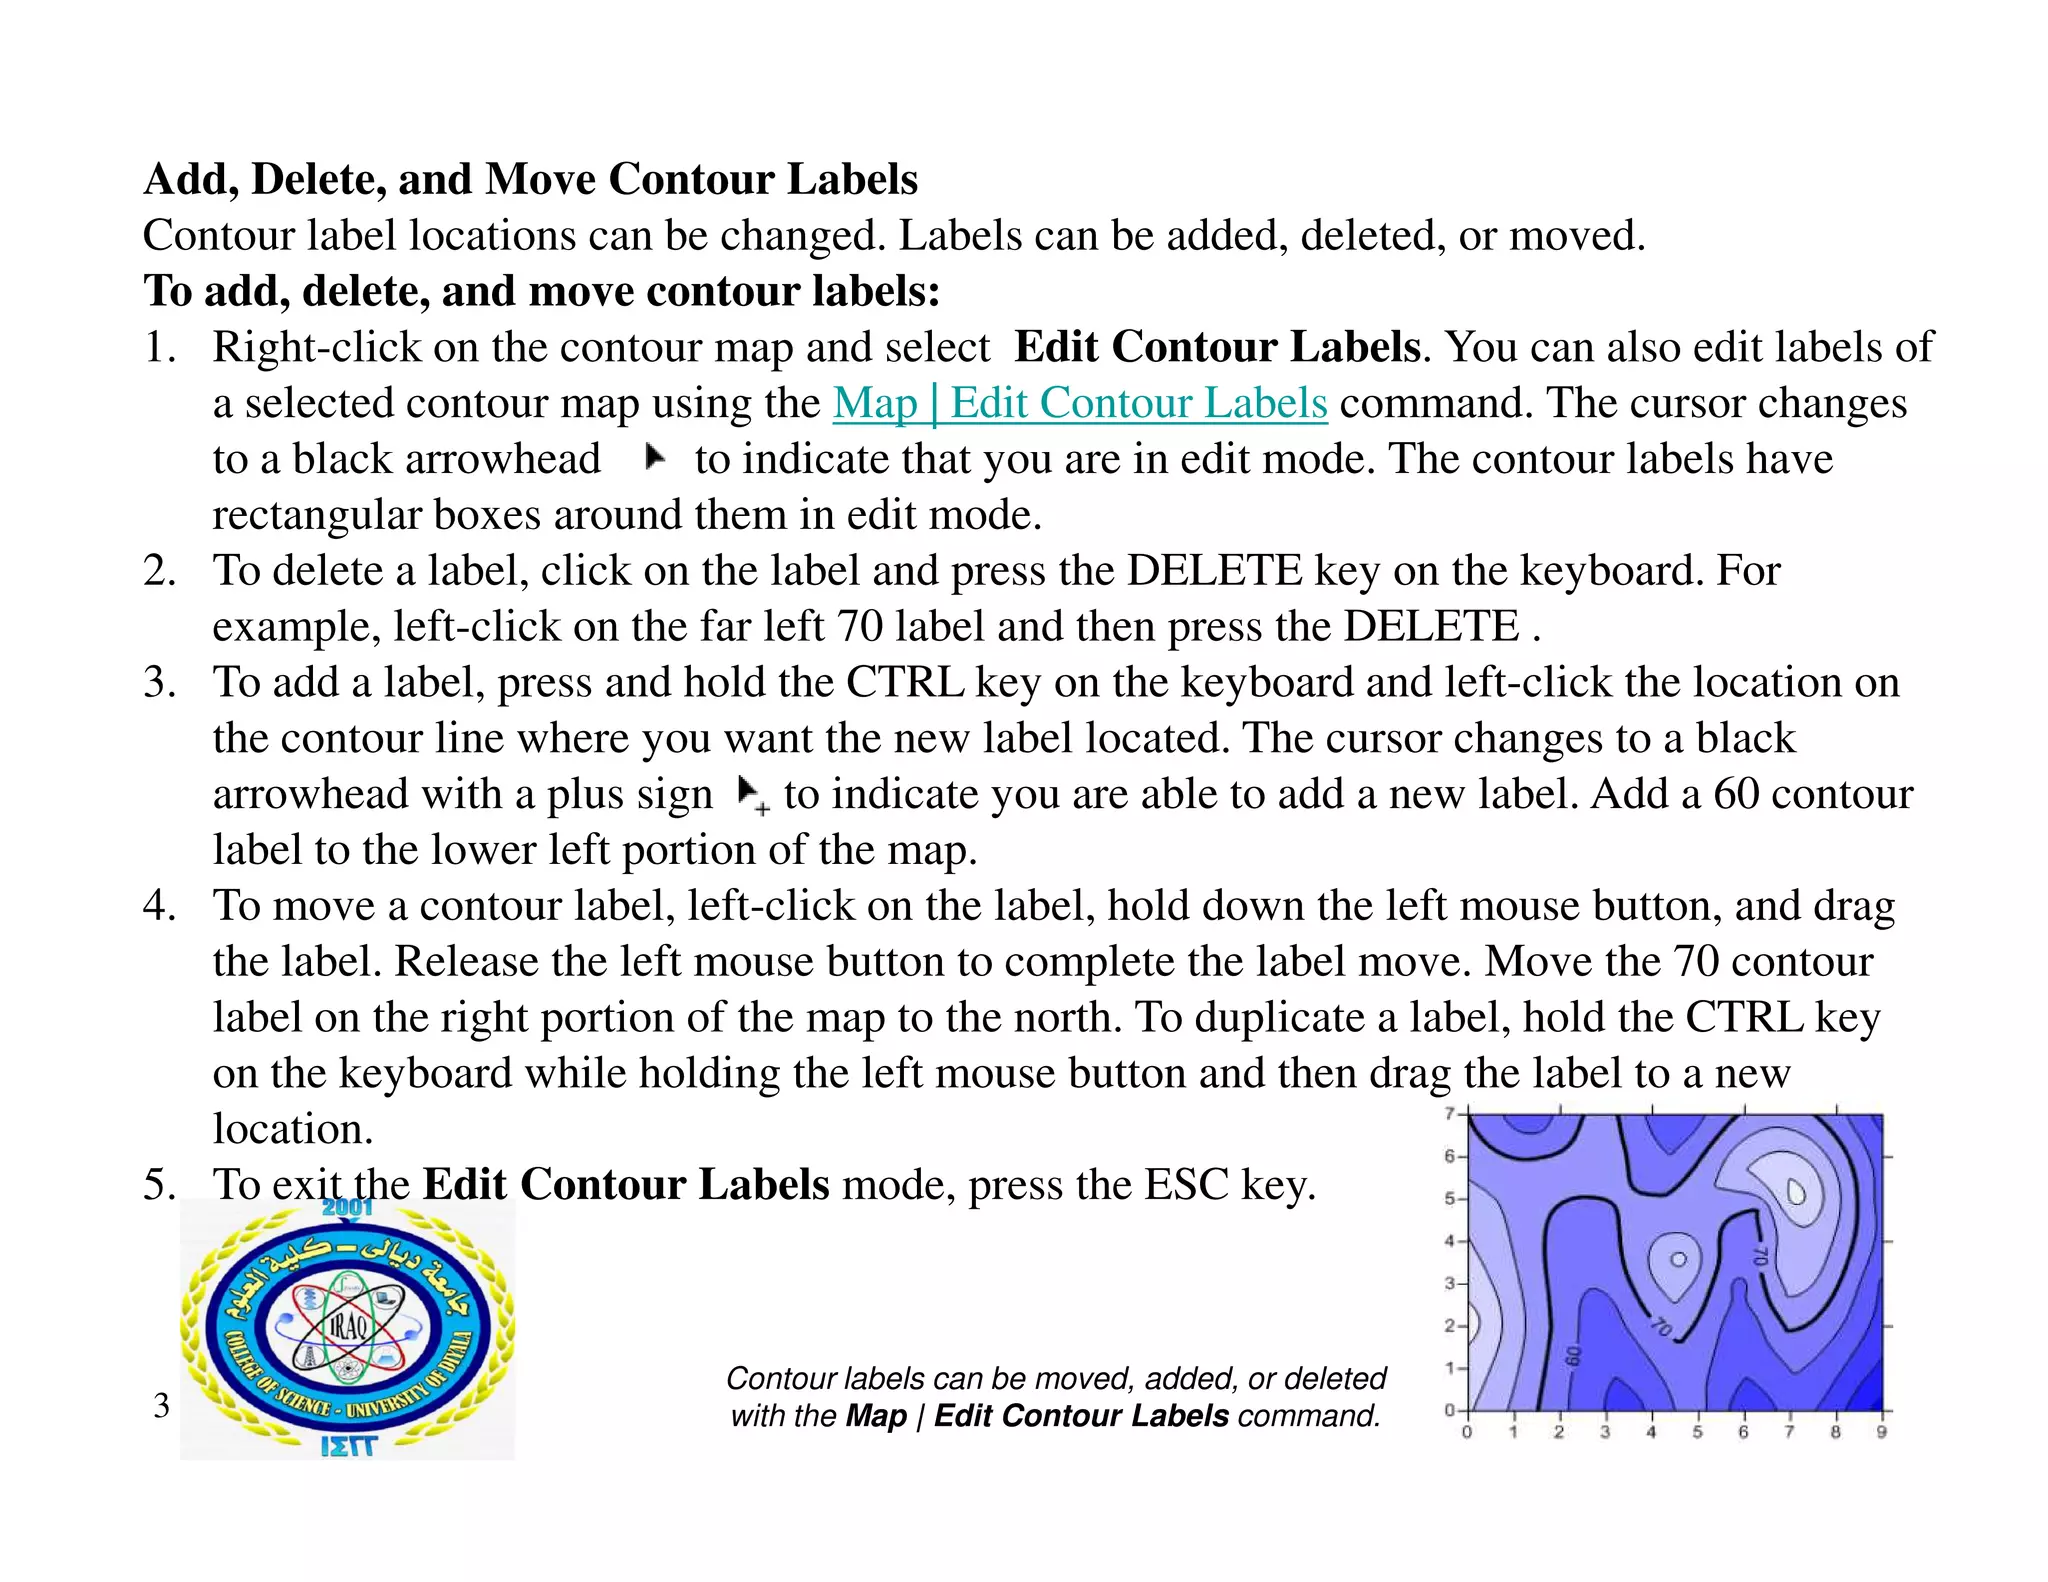
2. Editing contour labels by adding, deleting, or moving labels using the Edit Contour Labels command.
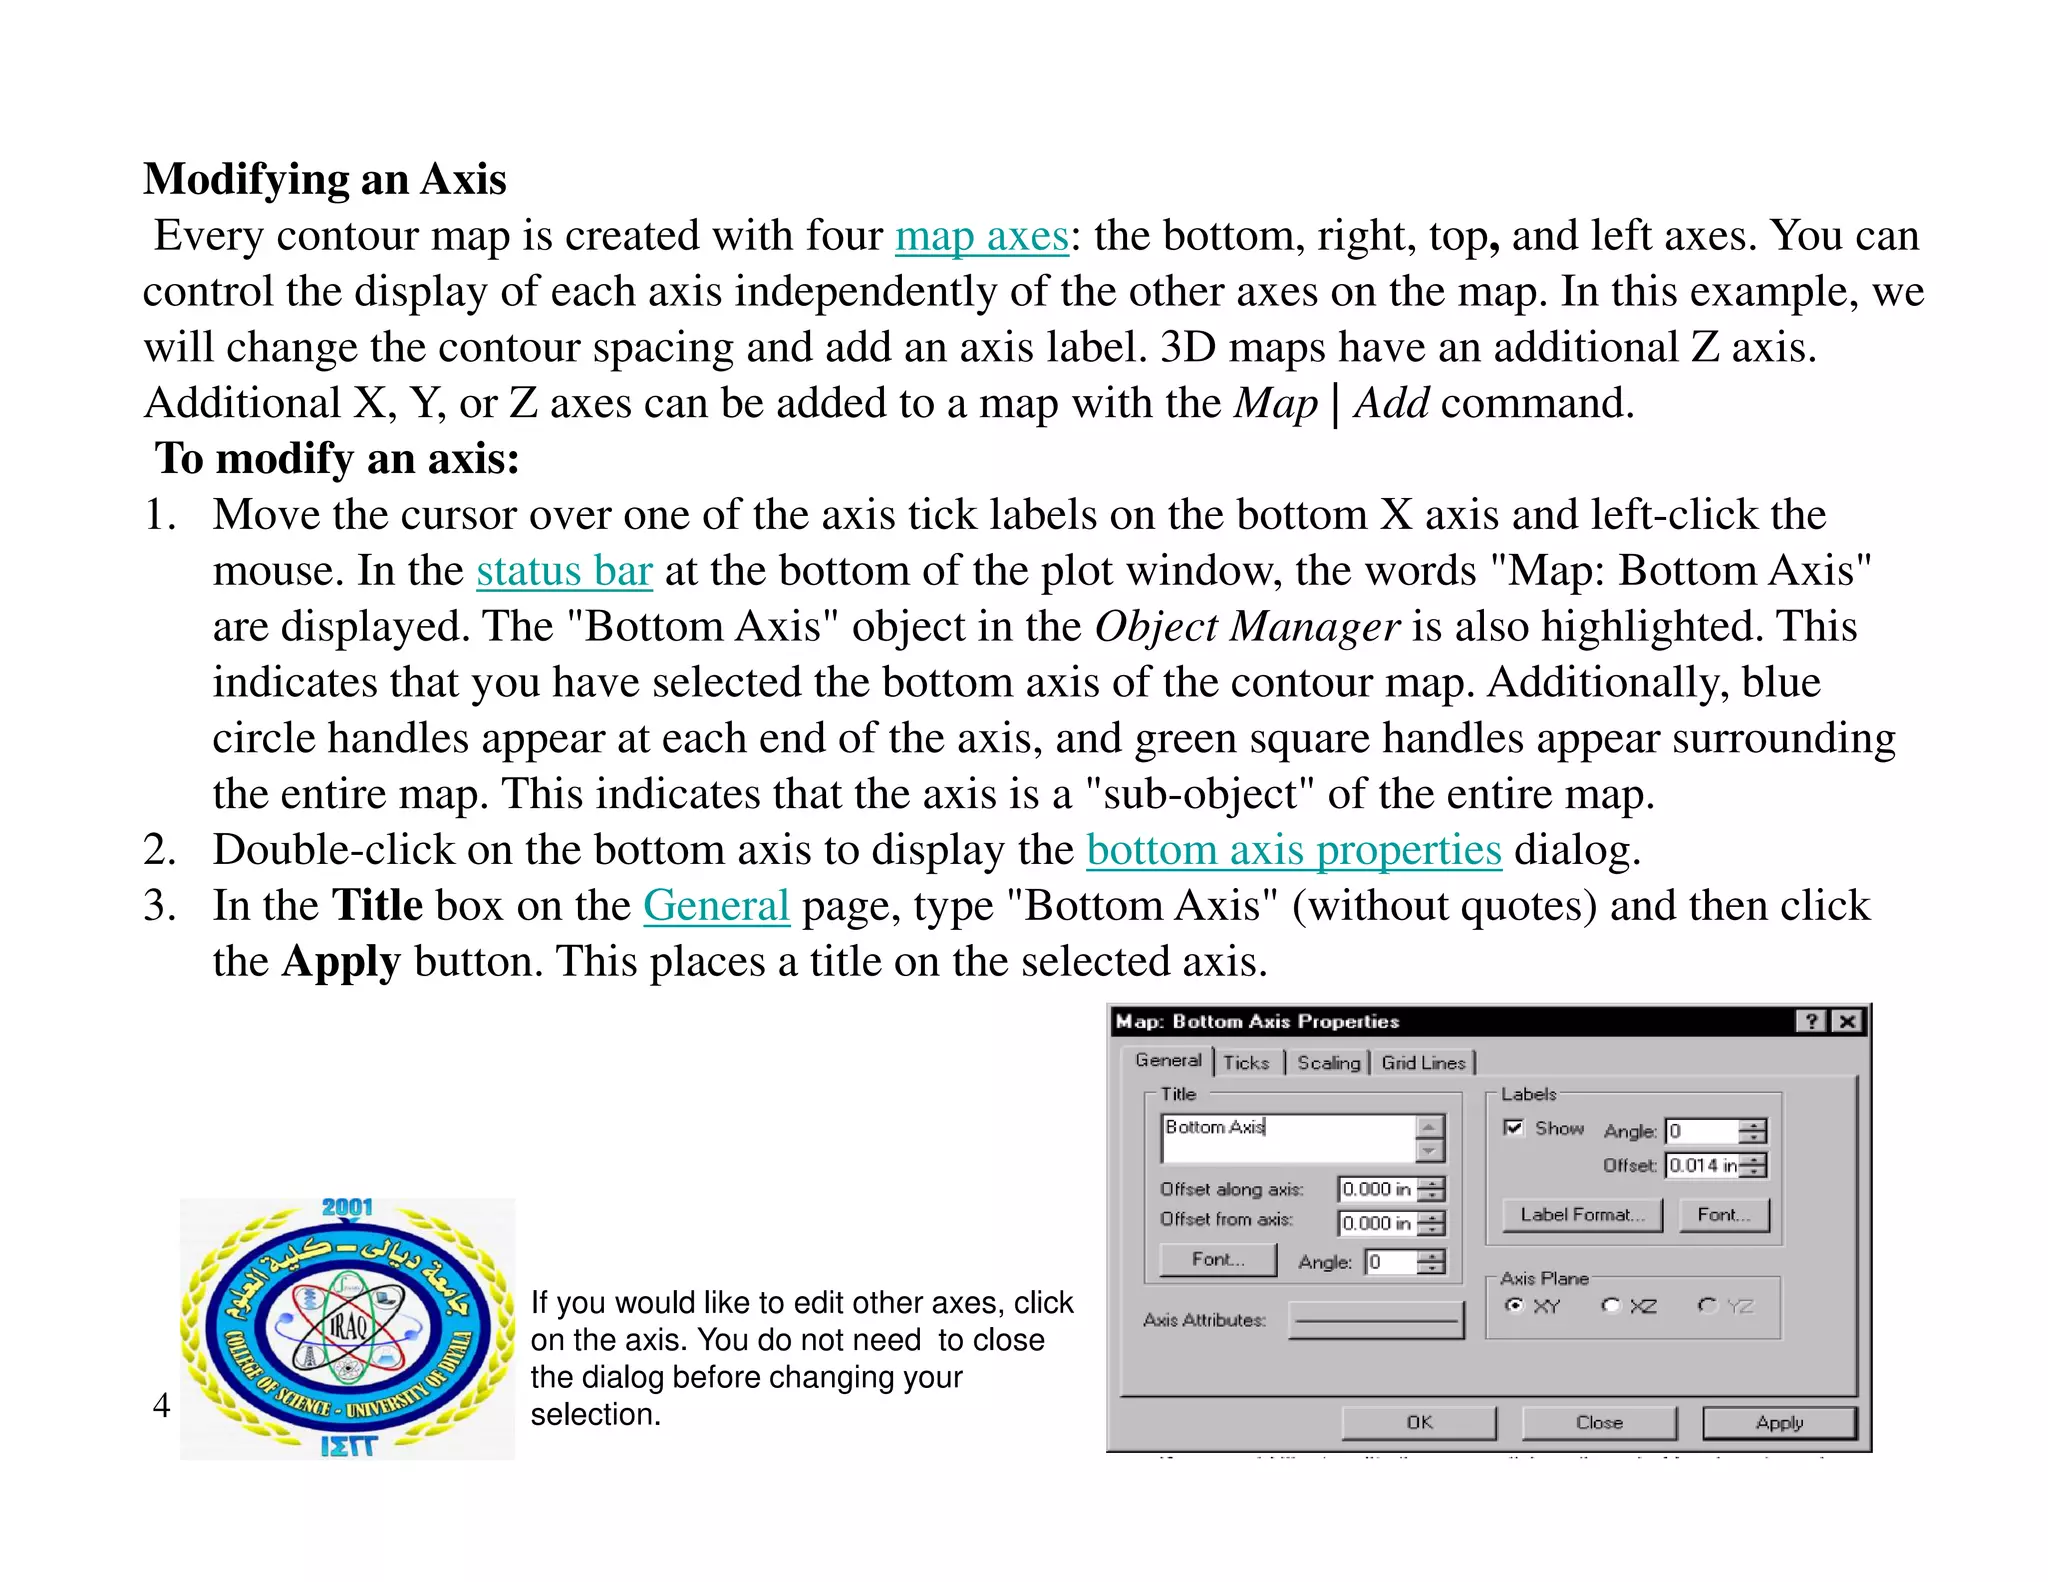
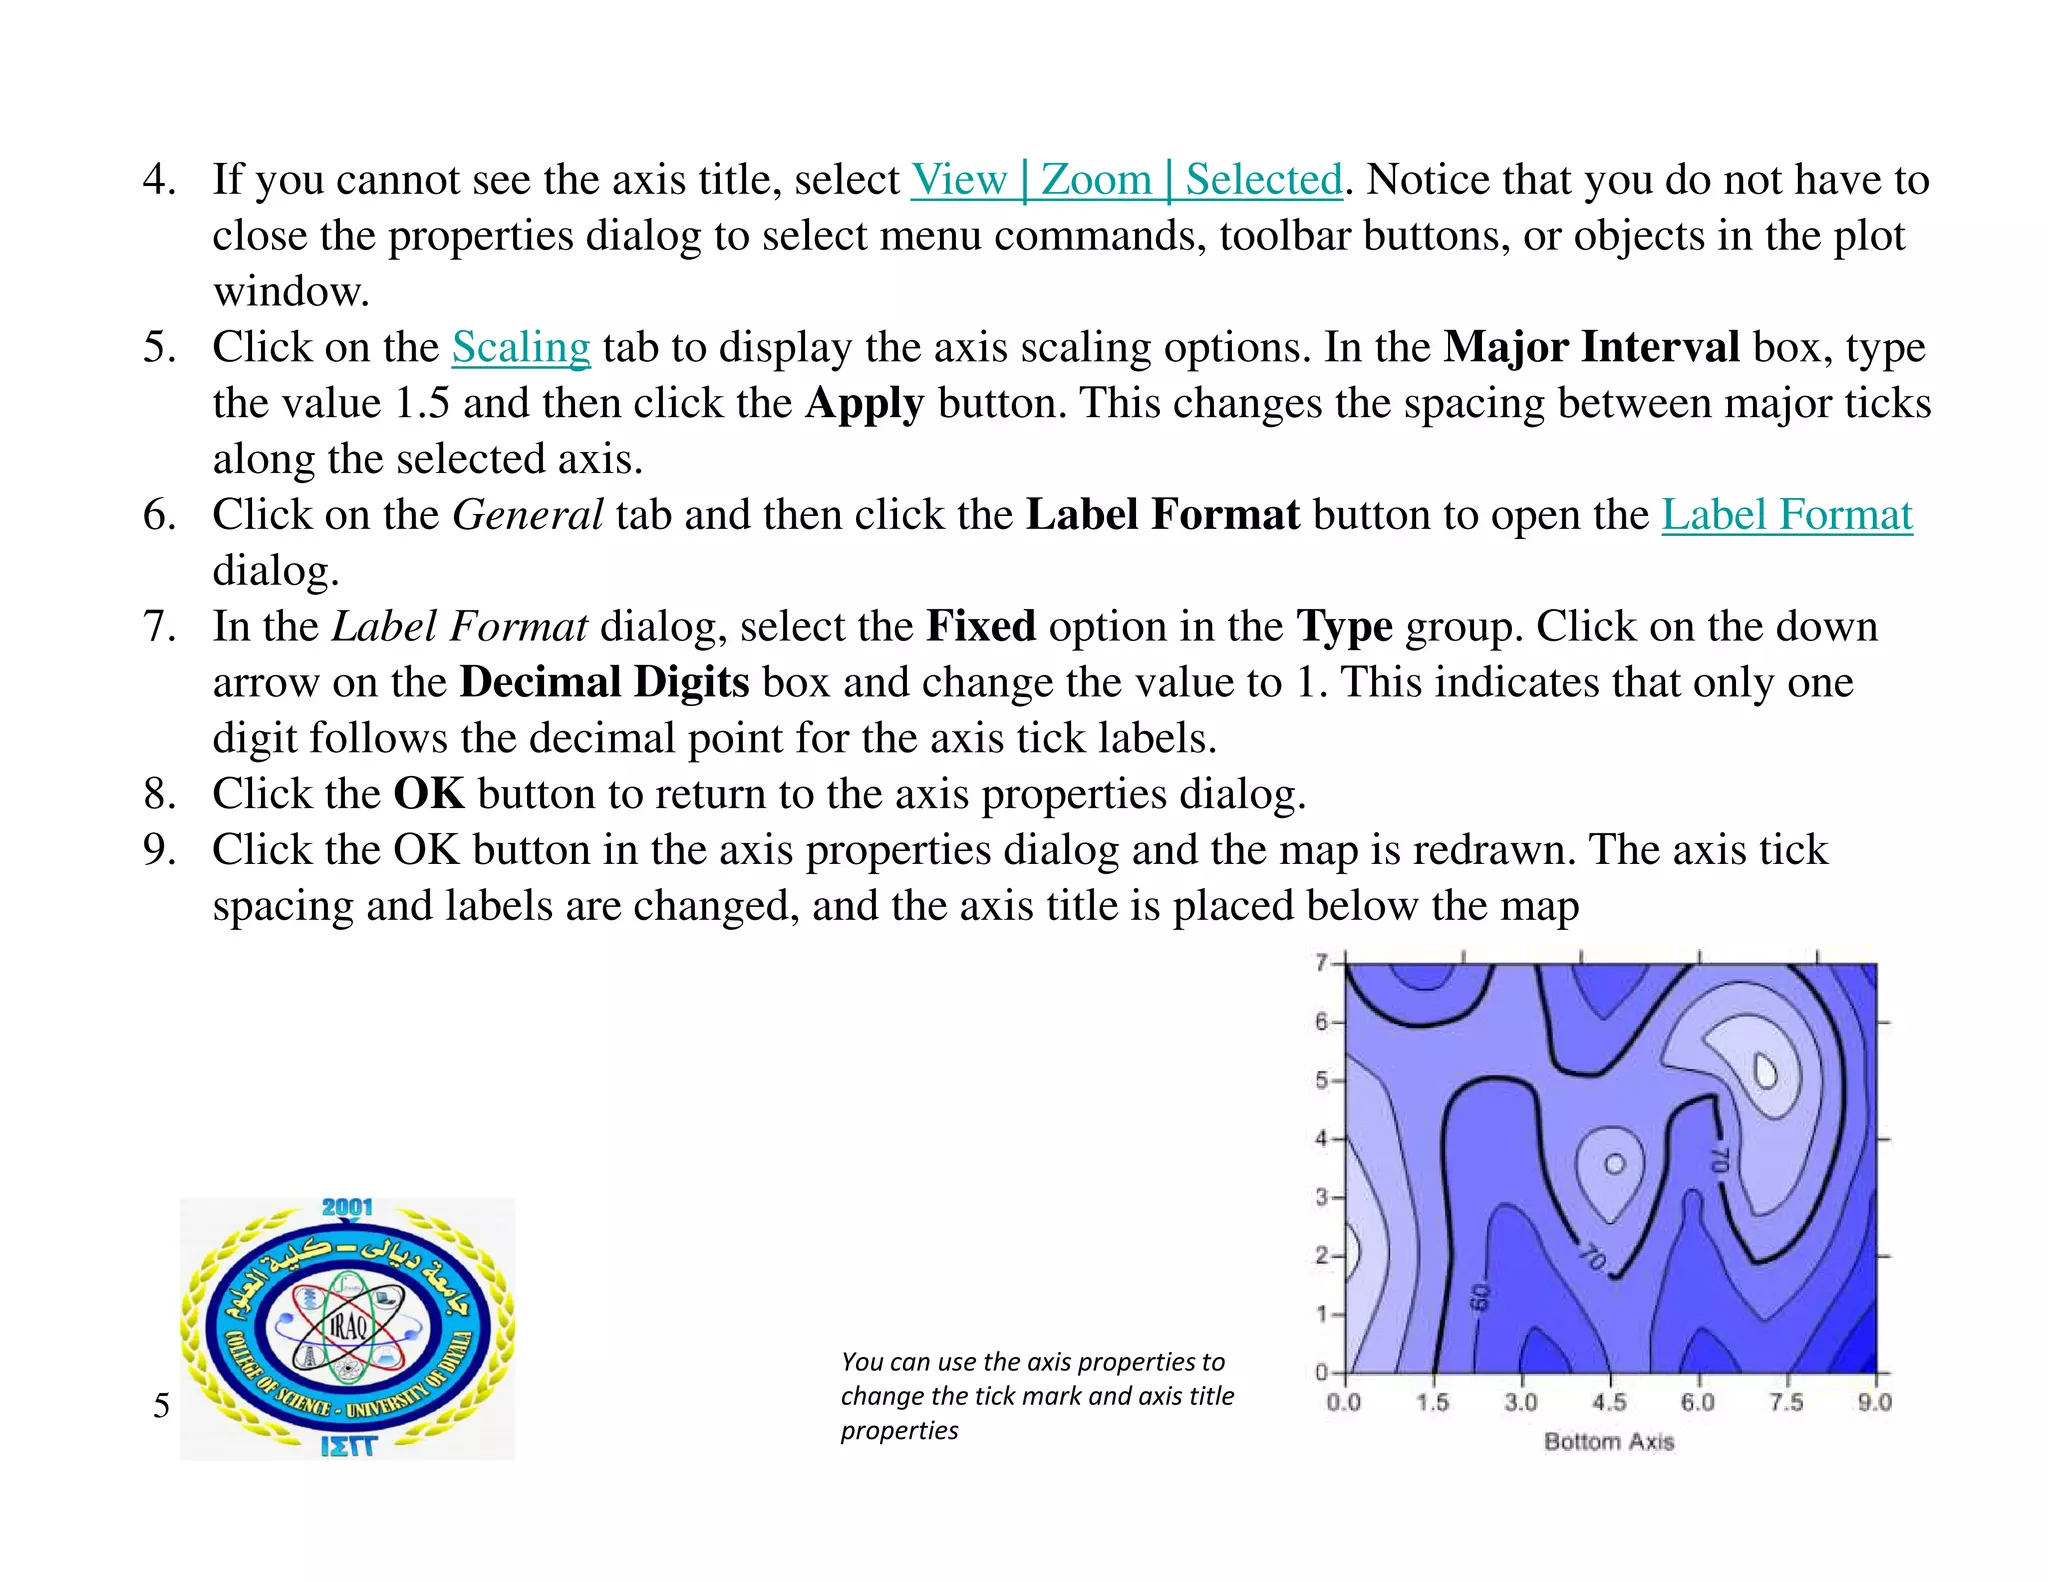
3. Modifying map axes by selecting an axis and changing properties like tick spacing and axis titles in the axis properties dialog.
4. Saving the completed contour map in a Surfer .SRF file to preserve all map properties and settings.
![Saving a Map
When you have completed the map in the plot window, you can save the map to a Surfer file
[.SRF] containing all the information necessary to reproduce the project. When you save a map
as a [.SRF], all the scaling, formatting, and map properties are preserved in the file. An asterisk
(*) next to the file name in the title bar and tab indicates the file has been modified and the
modifications have not yet been saved.
To save a map:
1. Choose the File | Save command, or click the button . .The Save As dialog is displayed
because the map has not been previously saved. Select a directory that you have the ability
to save to.
2. In the File name box, type TUTORWS.
3. Click the Save button and the file is saved to the current directory with an [.SRF] extension.
3. Click the Save button and the file is saved to the current directory with an [.SRF] extension.
The saved map remains open and the title bar changes to reflect the name change. There is
no longer an asterisk next to the file name.
6](https://image.slidesharecdn.com/surfer4-221007080108-2408a48c/75/Surfer-4-pdf-6-2048.jpg)