
More Related Content
Similar to Supply Shifters
Similar to Supply Shifters (20)
Recently uploaded
Recently uploaded (20)
Supply Shifters
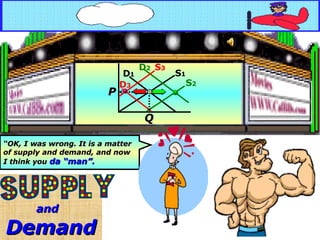
- 1. and Demand P Q S 1 D 1 D 2 D 3 S 3 S 2 “ OK, I was wrong. It is a matter of supply and demand, and now I think you da “man”.
- 2. Consumers and Producers Feel Differently About High and Low prices Producers supply more at the higher price because the opportunity cost increases if they don’t. Consumers consume less at the higher price because they now have less money to spend. Producers supply less at lower prices. Consumers consume more at the lower price because they now have more money to spend. I was going to buy a Honda but this car is $4,000 cheaper. I’m saving money at the lower price.
- 4. SUPPLY DEFINED SUPPLY SCHEDULE $1 2 3 4 5 CORN Various Amounts 5 20 35 50 60 P Q S
- 5. SUPPLY DEFINED SUPPLY SCHEDULE $1 2 3 4 5 CORN Various Amounts A Series of Possible Prices … a specified time period … other things being equal 5 20 35 50 60 P Q S
- 6. GRAPHING SUPPLY 5 P Q o $5 4 3 2 1 10 20 30 40 50 60 70 80 $5 4 3 2 1 60 50 35 20 5 Price of Corn Quantity of Corn CORN Plot the Points P Q S
- 7. GRAPHING SUPPLY P Q o $5 4 3 2 1 10 20 30 40 50 60 70 80 $5 4 3 2 1 60 50 35 20 5 Price of Corn Quantity of Corn CORN Plot the Points P Q S
- 8. GRAPHING SUPPLY 35 P Q o $5 4 3 2 1 10 20 30 40 50 60 70 80 $5 4 3 2 1 60 50 35 20 5 Price of Corn Quantity of Corn CORN Plot the Points P Q S
- 9. GRAPHING SUPPLY P Q o $5 4 3 2 1 10 20 30 40 50 60 70 80 $5 4 3 2 1 60 50 35 20 5 Price of Corn Quantity of Corn CORN Plot the Points P Q S
- 10. GRAPHING SUPPLY P Q o $5 4 3 2 1 10 20 30 40 50 60 70 80 $5 4 3 2 1 60 50 35 20 5 Price of Corn Quantity of Corn CORN Plot the Points P Q S
- 11. GRAPHING SUPPLY S P Q o $5 4 3 2 1 10 20 30 40 50 60 70 80 $5 4 3 2 1 60 50 35 20 5 Price of Corn Quantity of Corn CORN Plot the Points Connect the Points P Q S
- 12. GRAPHING SUPPLY S P Q o $5 4 3 2 1 10 20 30 40 50 60 70 80 $5 4 3 2 1 60 50 35 20 5 Price of Corn Quantity of Corn CORN What if Supply Increases? P Q S
- 13. GRAPHING SUPPLY S P Q o $5 4 3 2 1 10 20 30 40 50 60 70 80 Price of Corn Quantity of Corn $5 4 3 2 1 60 50 35 20 5 CORN 80 70 60 45 30 S’ Increase in Supply Increase in Quantity Supplied P Q S
- 14. GRAPHING SUPPLY S P Q o $5 4 3 2 1 10 20 30 40 50 60 70 80 $5 4 3 2 1 60 50 35 20 5 Price of Corn Quantity of Corn CORN What if Supply Decreases? P Q S
- 15. GRAPHING SUPPLY S P Q o $5 4 3 2 1 10 20 30 40 50 60 70 80 $5 4 3 2 1 60 50 35 20 5 Price of Corn Quantity of Corn CORN S’ 45 30 20 0 -- Decrease in Supply Decrease in Quantity Supplied P Q S
- 16. GRAPHING SUPPLY WITH DEMAND S Q o $5 $4 $3 $2 $1 10 20 30 40 50 60 70 80 $5 4 3 2 1 60 50 35 20 5 Price of Corn Quantity of Corn CORN Combining with Demand P Q S
- 17. MARKET DEMAND & SUPPLY 7 S Q o $5 4 $3 2 1 2 4 6 8 10 12 14 16 $5 $4 $3 $2 $1 2,000 4,000 7,000 11,000 16,000 $5 $4 $3 $2 $1 12,000 10,000 7,000 4,000 1,000 D Price of Corn Quantity of Corn CORN MARKET CORN MARKET Market Clearing Equilibrium P Q D P Q S
- 18. Shortage of Face Masks for S ARS Young Hong Kong ballet dancers wear masks to protect themselves from SARS. 770 people died from this disease.
- 20. Market Supply Curve QS of Crude Oil QS 1 S “ Particular Price” $45 $11 $6 $20 $25 QS 2 QS 3 QS 4 QS 5 Price
- 22. 2. Technological Improvement This lowers production costs & increases “S” . Ex: Suppose a new milking machine called “ The Invisible Hand” has a very soothing effect on cows; cows find the new machine so “udderly” delightful that they produce 30% more milk . This technological advance will cause a shift to the right . “ Can’t wait till milking time.”
- 23. The cow floats on its own pocket of water, as the water bed fits each cow’s body . They are “cool in the summer and warm in the winter .” They last 15-20 years. Cost is $150.00. The water beds are rubber bladders filled with 18 gallons of water and covered with thick rubber mats – undulated when the 1,400-pound cows shifted their weight. By conforming to the shape of the cows, the beds give the cows a more comfortable rest. They reduce wear and tear on the cows’ joints and prevent swelling and burning of hocks (ankles). The first ones who come back from the milking parlor fill those water bed stalls first . The other late-arriving cows say, Technological Breakthrough – Cow Waterbeds “ 500 gallons of blood have to circulate thru a cow’s udder to produce nutrients for one gallon of milk.” “ Mooooooovvvvvveeeeee over, give me that water bed.” Waterbedsforcows.com
- 25. Bigger Supply of Basketball Games in 1968 with the A B A D a l l a s C h a p a r r a l s I’m going for “3”. “ Bigger supply of basketball games every week”
- 27. 5. Subsidies – free money from “G” 6. Taxes – take away business profits and decrease supply. Businesses have their taxes increased which moves the supply curve to the (left/right). Free money from the government (subsidies) induces suppliers to supply more.
- 29. D 2 With Much Higher Gas Prices, What Happens In The SUV/RV Market S 1 P 1 P 2 Q 2 Q 1 D 1 8 MPG QS QD
- 31. “ Increase in D ” “ Decrease in D ” “ Increase in S ” “ Decrease in S ” ___1. Decrease in income on market for used cars . ___2. Decrease in income on market for new cars . ___3. Consumer expectations about a price decrease . ___4. Producer expectations about a price decrease . ___5. Increase in # of producers on the market for computers . ___6. Increase in # of consumers on the market for used cars . ___7. Increase in # of consumers on the market for new cars . ___8. Decrease in the price of movies upon the market for popcorn . ___9. Decrease in business taxes on the market for computers . ___10. Consumer expectations of a shortage of apples . ___11. Decrease in resource cost on market for computers . ___12. Increase in price of wheat upon market for corn . ___13. Consumer expectations of a shortage of cell phones. ___14. Producers expectations about a price increase. ___15. Increase in income on the market for iPods . B B C C A A C A D C A A A A D D 1 D 2 (A) (B) (C) (D) D 1 D 2 S S S 1 S 1 S 2 S 2 D D TIMER RATNEST P 2 P 1 P 1 P 2 P 1 P2 P 2 P 1 QD 1 QD 2 QD 2 QD1 QD 1 QD2 QD 2 QD1
- 32. NS 41-53 41. Supply – quantities producers offer at each (technique/price). 42. The relationship between price and QS is (direct/inverse) and the relationship between price and QD is (direct/inverse) or opposite. 43. The “law of supply” indicates that producers will offer (less/more) at higher prices. 44. In moving along a stable supply/demand curve , (income/price) is not held constant. 45. (Inelasic/Elastic) supply-when QS is very responsive to price . 46. (Inelastic/Elastic) supply-when a change in price has little impact on QS . 47. The 3-item test for elastic supply is: the item can be made quickly, it tends to be cheap, & it can be produced by (skilled/unskilled) workers. 48. The 3-item test for inelastic supply is: the item cannot be made quickly, it tends to be expensive, & (skilled/unskilled) workers. 49. An example of inelastic supply is (posters/computers/T-shirts). 50. An example of elastic supply is (HDTV/computers/T-shirts). 51. The supply curve for elastic supply is more (flat/vertical). 52. The supply curve for inelastic supply is more (flat/vertical). 53. A decrease in the price of cattle feed will cause the (D/S) curve for beef to shift.
- 33. GRAPHING SUPPLY [Change in QS] 5 P Q o $5 $4 $3 $2 $1 10 20 30 40 50 60 70 80 $5 4 3 2 1 60 50 35 20 5 Price of Corn Quantity of Corn CORN Plot the Points P Q S
- 34. GRAPHING SUPPLY [Change in QS] P Q o $5 $4 $3 $2 $1 10 20 30 40 50 60 70 80 $5 4 3 2 1 60 50 35 20 5 Price of Corn Quantity of Corn CORN Plot the Points P Q S
- 35. GRAPHING SUPPLY [Change in price, so “Change in QS”] Q o $5 $4 $3 $2 $1 10 20 30 40 50 60 70 80 $5 4 3 2 1 60 50 35 20 5 Price of Corn Quantity of Corn CORN Plot the Points P Q S
- 36. GRAPHING SUPPLY [Change in price, so “Change in QS”] S Q o $5 $4 $3 $2 $1 10 20 30 40 50 60 70 80 $5 4 3 2 1 60 50 35 20 5 Price of Corn Quantity of Corn CORN Plot the Points Connect the Points P Q S
- 37. GRAPHING SUPPLY S Q o $5 $4 $3 $2 $1 10 20 30 40 50 60 70 80 $5 4 3 2 1 60 50 35 20 5 Price of Corn Quantity of Corn CORN What if Supply Increases? P Q S
- 38. GRAPHING SUPPLY [Change in S] S 1 Q o $5 $4 $3 $2 $1 10 20 30 40 50 60 70 80 Price of Corn Quantity of Corn $5 4 3 2 1 62 52 40 25 10 CORN 82 72 60 45 30 S 2 Increase in Supply Increase in QS P Q S
- 39. GRAPHING SUPPLY [Change in S] S Q o $5 4 3 2 1 10 20 30 40 50 60 70 80 $5 4 3 2 1 60 50 35 20 5 Price of Corn Quantity of Corn CORN What if Supply Decreases? P Q S
- 40. GRAPHING SUPPLY [Change in S] S 1 Q o $5 $4 $3 $2 $1 10 20 30 40 50 60 70 80 $5 4 3 2 1 63 54 40 25 9 Price of Corn Quantity of Corn CORN S 2 46 35 20 3 -- Decrease in Supply Decrease in QS P Q S
- 41. Price Floor – minimum price [creates surpluses ] . $2.50 S P Q 0 14 19 24 D Surplus Such as: Minimum Wage Agricultural Price Supports The price has to be IN the house . It can’t be below the floor. Some call agricultural price supports “ udder insanity.” Price Floor-minimum price QS exceeds QD Millions of gallons per month 1.90 Price per gallon Equilibrium price for milk
- 42. Price Ceiling - maximum price [creates shortages ] 7 S P o D Shortage Such as: Rent controls in NYC Wartime price controls Rock concert prices Super Bowl tickets The price has to be in the house. It can’t be above the ceiling. Super Bowl T icket P rices E-Bay 1967 - $12.00 2004 - $500 $2-6,000 Reliant Stadium NFL could raise the price & make another $150 M but the average man couldn’t attend. 2.5 3 Price Ceiling-maximum price QD exceeds QS Millions of Dwellings Rented $2,000 1,200 3.5 NYC Rent Controls