Download to read offline
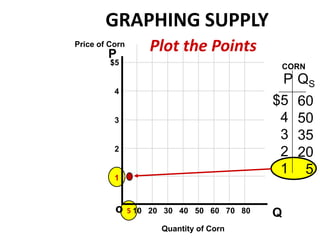
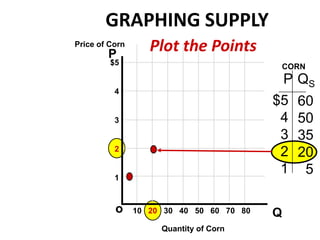
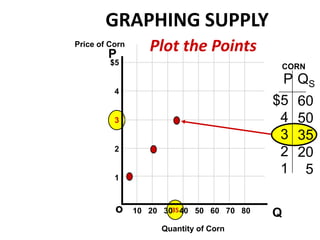
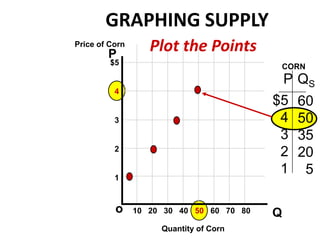
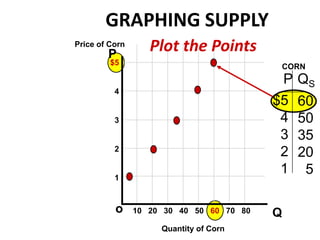
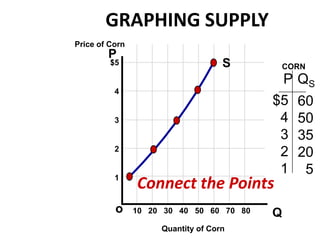
The document contains instructions and data for plotting the price of corn against quantity on a graph. It lists the price of corn ($5, $4, etc.) alongside varying quantities of corn (60, 50, 35, etc.) to be plotted as individual points on a graph with price on the y-axis and quantity on the x-axis, with the final instruction to connect the points.


![Fish fry[1]](https://cdn.slidesharecdn.com/ss_thumbnails/fishfry1-120914100933-phpapp01-thumbnail.jpg?width=640&height=640&fit=bounds)


