Chap03
•Download as PPT, PDF•
2 likes•307 views

The document discusses the concepts of demand, supply, and market equilibrium in commodity markets. It defines demand and supply schedules, graphs demand and supply curves, and shows how equilibrium price and quantity are determined by the intersection of the demand and supply curves. It explains how changes in demand or supply can lead to surpluses or shortages and discusses the role of prices in rationing goods in markets. Government policies like price ceilings and floors are also introduced.

Recommended
More Related Content
Similar to Chap03
Similar to Chap03 (20)
Recently uploaded
Recently uploaded (20)
Chap03
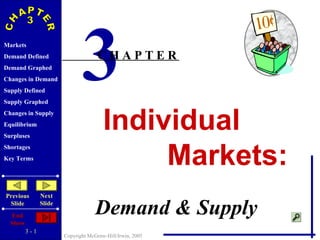
- 1. Individual Markets: Demand & Supply 3 C H A P T E R
- 2. MARKETS DEFINED MARKETS POTENTIAL SELLERS POTENTIAL BUYERS
- 3. DEMAND DEFINED $5 4 3 2 1 DEMAND SCHEDULE Various Amounts A Series of Possible Prices … a specified time period … other things being equal 10 20 35 55 80 P Q D
- 9. GRAPHING DEMAND P Q o $5 4 3 2 1 $5 4 3 2 1 10 20 35 55 80 Price of Corn Quantity of Corn CORN Plot the Points 10 20 30 40 50 60 70 80 P Q D
- 10. GRAPHING DEMAND 55 P Q o $5 4 3 2 1 $5 4 3 2 1 10 20 35 55 80 Price of Corn Quantity of Corn CORN Plot the Points 10 20 30 40 50 60 70 80 P Q D
- 11. GRAPHING DEMAND 35 P Q o $5 4 3 2 1 $5 4 3 2 1 10 20 35 55 80 Price of Corn Quantity of Corn CORN Plot the Points 10 20 30 40 50 60 70 80 P Q D
- 12. GRAPHING DEMAND P Q o $5 4 3 2 1 $5 4 3 2 1 10 20 35 55 80 Price of Corn Quantity of Corn CORN Plot the Points 10 20 30 40 50 60 70 80 P Q D
- 13. GRAPHING DEMAND P Q o $5 4 3 2 1 $5 4 3 2 1 10 20 35 55 80 Price of Corn Quantity of Corn CORN Plot the Points 10 20 30 40 50 60 70 80 P Q D
- 14. GRAPHING DEMAND P Q o $5 4 3 2 1 $5 4 3 2 1 10 20 35 55 80 D Price of Corn Quantity of Corn CORN Connect the Points 10 20 30 40 50 60 70 80 P Q D
- 15. GRAPHING DEMAND P Q o $5 4 3 2 1 $5 4 3 2 1 10 20 35 55 80 D Price of Corn Quantity of Corn CORN 10 20 30 40 50 60 70 80 What if Demand Increases? P Q D
- 16. GRAPHING DEMAND P Q o $5 4 3 2 1 $5 4 3 2 1 D Price of Corn Quantity of Corn CORN 10 20 30 40 50 60 70 80 D’ Increase in Demand Increase in Quantity Demanded 10 20 35 55 80 30 40 60 80 + P Q D
- 17. GRAPHING DEMAND P Q o $5 4 3 2 1 $5 4 3 2 1 10 20 35 55 80 D Price of Corn Quantity of Corn CORN 10 20 30 40 50 60 70 80 What if Demand Decreases? P Q D
- 18. GRAPHING DEMAND P Q o $5 4 3 2 1 $5 4 3 2 1 10 20 35 55 80 D Price of Corn Quantity of Corn CORN 10 20 30 40 50 60 70 80 -- 10 20 40 60 D’ Decrease in Demand Decrease in Quantity Demanded P Q D
- 20. SUPPLY DEFINED SUPPLY SCHEDULE $1 2 3 4 5 CORN Various Amounts 5 20 35 50 60 P Q S
- 21. SUPPLY DEFINED SUPPLY SCHEDULE $1 2 3 4 5 CORN Various Amounts A Series of Possible Prices … a specified time period … other things being equal 5 20 35 50 60 P Q S
- 23. GRAPHING SUPPLY 5 P Q o $5 4 3 2 1 10 20 30 40 50 60 70 80 $5 4 3 2 1 60 50 35 20 5 Price of Corn Quantity of Corn CORN Plot the Points P Q S
- 24. GRAPHING SUPPLY P Q o $5 4 3 2 1 10 20 30 40 50 60 70 80 $5 4 3 2 1 60 50 35 20 5 Price of Corn Quantity of Corn CORN Plot the Points P Q S
- 25. GRAPHING SUPPLY 35 P Q o $5 4 3 2 1 10 20 30 40 50 60 70 80 $5 4 3 2 1 60 50 35 20 5 Price of Corn Quantity of Corn CORN Plot the Points P Q S
- 26. GRAPHING SUPPLY P Q o $5 4 3 2 1 10 20 30 40 50 60 70 80 $5 4 3 2 1 60 50 35 20 5 Price of Corn Quantity of Corn CORN Plot the Points P Q S
- 27. GRAPHING SUPPLY P Q o $5 4 3 2 1 10 20 30 40 50 60 70 80 $5 4 3 2 1 60 50 35 20 5 Price of Corn Quantity of Corn CORN Plot the Points P Q S
- 28. GRAPHING SUPPLY S P Q o $5 4 3 2 1 10 20 30 40 50 60 70 80 $5 4 3 2 1 60 50 35 20 5 Price of Corn Quantity of Corn CORN Connect the Points P Q S
- 29. GRAPHING SUPPLY S P Q o $5 4 3 2 1 10 20 30 40 50 60 70 80 $5 4 3 2 1 60 50 35 20 5 Price of Corn Quantity of Corn CORN What if Supply Increases? P Q S
- 30. GRAPHING SUPPLY S P Q o $5 4 3 2 1 10 20 30 40 50 60 70 80 Price of Corn Quantity of Corn $5 4 3 2 1 60 50 35 20 5 CORN 80 70 60 45 30 S’ Increase in Supply Increase in Quantity Supplied P Q S
- 31. GRAPHING SUPPLY S P Q o $5 4 3 2 1 10 20 30 40 50 60 70 80 $5 4 3 2 1 60 50 35 20 5 Price of Corn Quantity of Corn CORN What if Supply Decreases? P Q S
- 32. GRAPHING SUPPLY S P Q o $5 4 3 2 1 10 20 30 40 50 60 70 80 $5 4 3 2 1 60 50 35 20 5 Price of Corn Quantity of Corn CORN S’ 45 30 20 0 -- Decrease in Supply Decrease in Quantity Supplied P Q S
- 35. MARKET DEMAND & SUPPLY $5 4 3 2 1 10 20 35 55 80 $5 4 3 2 1 60 50 35 20 5 200 B U Y E R S MARKET DEMAND 2,000 4,000 7,000 11,000 16,000 200 S E L L E R S 12,000 10,000 7,000 4,000 1,000 MARKET SUPPLY EQUILIBRIUM Graphically… x x P Q D BUSHELS OF CORN P Q S BUSHELS OF CORN
- 36. MARKET DEMAND & SUPPLY 7 S P Q o $5 4 3 2 1 2 4 6 8 10 12 14 16 $5 4 3 2 1 2,000 4,000 7,000 11,000 16,000 $5 4 3 2 1 12,000 10,000 7,000 4,000 1,000 D Price of Corn Quantity of Corn CORN MARKET CORN MARKET Market Clearing Equilibrium P Q D P Q S
- 37. MARKET DEMAND & SUPPLY 7 S P Q o $5 4 3 2 1 2 4 6 8 10 12 14 16 $5 4 3 2 1 2,000 4,000 7,000 11,000 16,000 $5 4 3 2 1 12,000 10,000 7,000 4,000 1,000 D Price of Corn Quantity of Corn CORN MARKET CORN MARKET Surplus At a $4 price more is being supplied than demanded P Q D P Q S
- 38. MARKET DEMAND & SUPPLY 11 7 S P Q o $5 4 3 2 1 2 4 6 8 10 12 14 16 $5 4 3 2 1 2,000 4,000 7,000 11,000 16,000 $5 4 3 2 1 12,000 10,000 7,000 4,000 1,000 D Price of Corn Quantity of Corn CORN MARKET CORN MARKET At a $2 price more is being demanded than supplied Shortage P Q D P Q S
- 39. MARKET DEMAND & SUPPLY 11 7 S P Q o $5 4 3 2 1 2 4 6 8 10 12 14 16 $5 4 3 2 1 2,000 4,000 7,000 11,000 16,000 $5 4 3 2 1 12,000 10,000 7,000 4,000 1,000 D Price of Corn Quantity of Corn CORN MARKET CORN MARKET Shortage Surplus P Q D P Q S
- 46. Next: The Market System Chapter 4