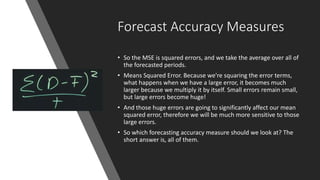
Supply Chain Planning- part 2
Mcenroe ng
Forecast
Accuracy
Measures
• How do you know how good a forecast is? Well,
you have to measure it's accuracy, and you can
measure how far away it is from the actual
demand, which is defined as accuracy,
• but you also have to consider bias, and bias
means is, do you have a tendency to over
forecast or under forecast? You don't want to be
too biased in either direction because that
degrades the ability to properly forecast the
future just as much as accuracy does.
Forecast Accuracy Measures
• The simplest form of a forecast accuracy measure is the mean error.
We take our demand, we subtract the forecast from it, and, then, all
we need to do is average up all of these time periods that we have
forecasted so far, and that gives us our mean error.
Forecast Accuracy
Measures
• Next, we have the mean absolute
percent error. And unlike the mean
error, which was more of a
measure of bias, we are going to
actually get that accuracy. So we
have our demand, minus our
forecast.
Forecast Accuracy Measures
• And the problem is that we are trying to compare across products, so we have to
divide by demand to get a percentage.
• And we're going to take the absolute value of that. So that we don't have pluses
and minuses canceling each other out.
• And then, all we need to do is take this sum of over that and divide by how many
periods we have, and then we have it. Make mean absolute percent error.
• A very important forecasting accuracy measure is the mean squared error or
MSE.
• What we're trying to achieve with that is, that we're trying to give more weight to
large errors. Large errors are the ones we want to avoid at all costs because small
errors we can plan for. Large errors are going to surprise us and make our life and
planning much more difficult. So our demand minus our forecast actually will get
squared and then we take the average of that.
Forecast Accuracy Measures
• So the MSE is squared errors, and we take the average over all of
the forecasted periods.
• Means Squared Error. Because we're squaring the error terms,
what happens when we have a large error, it becomes much
larger because we multiply it by itself. Small errors remain small,
but large errors become huge!
• And those huge errors are going to significantly affect our mean
squared error, therefore we will be much more sensitive to those
large errors.
• So which forecasting accuracy measure should we look at? The
short answer is, all of them.
Moving Average
• Take, for example Johnson & Johnson. They're over 140 years old.
What the stock price was 140 years ago probably has not much to do
with where it will go in the future.
• The truth lies somewhere in the middle. You want to look at a moving
average that takes a subset of data, averages it, and as we move
through time, that average will move with us. So, on the stock market,
we often consider 50 and 200 day moving averages as a comparison
for the stock price that we currently have.
Moving Average
• Now, lets take a look at the math behind the moving average. So our
forecast, a time T, is equal to a moving average, so we are going to
pick a subset of data that we are going to average up, and we denote
that again by our Greek symbol sigma, and that sum is going to go
from i = t- N + 2 all the way to t- 1.
• So, t- 1 is the period that we have available right now and we'll going
to go back N periods.
Moving Average
• Now, we have to add the two back in because we really start a t- 1 and we only want to
go eight periods back of demand. We divide it by the number of periods that we
summed up, which is N, and there we have the formula for the moving average.
• And if we look at it on a timeline we're here at point t and we are going to, let's say, have
an N of four, we are going to average out those four periods, so we're going to sum
them, and we're going to divide them by N, which is a moving average.
• The average, as you saw, is a fairly straight forward mathematical function. But in the
moving average, we have one big unknown, and that's called N.
• N is the number of periods you're going to average together, and that is a decision that
you as the forecaster needs to make.
• A small N will make the forecast very reactive
• versus a large N, which makes the forecast very stable. So you go from something like the
method to something like the cumulative mean.
Moving Average
• Notation:
• Dt: Demand at the current time
period
• Ft: Forecast at the current time
period
• Dt-1: Take the demand from the
previous period
• N: number of data points in the
moving average
•
Reference
Rutgers the State University of New Jersey

Supply chain planning part 2

  • 1.
    Supply Chain Planning-part 2 Mcenroe ng
  • 2.
    Forecast Accuracy Measures • How doyou know how good a forecast is? Well, you have to measure it's accuracy, and you can measure how far away it is from the actual demand, which is defined as accuracy, • but you also have to consider bias, and bias means is, do you have a tendency to over forecast or under forecast? You don't want to be too biased in either direction because that degrades the ability to properly forecast the future just as much as accuracy does.
  • 3.
    Forecast Accuracy Measures •The simplest form of a forecast accuracy measure is the mean error. We take our demand, we subtract the forecast from it, and, then, all we need to do is average up all of these time periods that we have forecasted so far, and that gives us our mean error.
  • 4.
    Forecast Accuracy Measures • Next,we have the mean absolute percent error. And unlike the mean error, which was more of a measure of bias, we are going to actually get that accuracy. So we have our demand, minus our forecast.
  • 5.
    Forecast Accuracy Measures •And the problem is that we are trying to compare across products, so we have to divide by demand to get a percentage. • And we're going to take the absolute value of that. So that we don't have pluses and minuses canceling each other out. • And then, all we need to do is take this sum of over that and divide by how many periods we have, and then we have it. Make mean absolute percent error. • A very important forecasting accuracy measure is the mean squared error or MSE. • What we're trying to achieve with that is, that we're trying to give more weight to large errors. Large errors are the ones we want to avoid at all costs because small errors we can plan for. Large errors are going to surprise us and make our life and planning much more difficult. So our demand minus our forecast actually will get squared and then we take the average of that.
  • 6.
    Forecast Accuracy Measures •So the MSE is squared errors, and we take the average over all of the forecasted periods. • Means Squared Error. Because we're squaring the error terms, what happens when we have a large error, it becomes much larger because we multiply it by itself. Small errors remain small, but large errors become huge! • And those huge errors are going to significantly affect our mean squared error, therefore we will be much more sensitive to those large errors. • So which forecasting accuracy measure should we look at? The short answer is, all of them.
  • 7.
    Moving Average • Take,for example Johnson & Johnson. They're over 140 years old. What the stock price was 140 years ago probably has not much to do with where it will go in the future. • The truth lies somewhere in the middle. You want to look at a moving average that takes a subset of data, averages it, and as we move through time, that average will move with us. So, on the stock market, we often consider 50 and 200 day moving averages as a comparison for the stock price that we currently have.
  • 8.
    Moving Average • Now,lets take a look at the math behind the moving average. So our forecast, a time T, is equal to a moving average, so we are going to pick a subset of data that we are going to average up, and we denote that again by our Greek symbol sigma, and that sum is going to go from i = t- N + 2 all the way to t- 1. • So, t- 1 is the period that we have available right now and we'll going to go back N periods.
  • 9.
    Moving Average • Now,we have to add the two back in because we really start a t- 1 and we only want to go eight periods back of demand. We divide it by the number of periods that we summed up, which is N, and there we have the formula for the moving average. • And if we look at it on a timeline we're here at point t and we are going to, let's say, have an N of four, we are going to average out those four periods, so we're going to sum them, and we're going to divide them by N, which is a moving average. • The average, as you saw, is a fairly straight forward mathematical function. But in the moving average, we have one big unknown, and that's called N. • N is the number of periods you're going to average together, and that is a decision that you as the forecaster needs to make. • A small N will make the forecast very reactive • versus a large N, which makes the forecast very stable. So you go from something like the method to something like the cumulative mean.
  • 10.
    Moving Average • Notation: •Dt: Demand at the current time period • Ft: Forecast at the current time period • Dt-1: Take the demand from the previous period • N: number of data points in the moving average •
  • 11.
    Reference Rutgers the StateUniversity of New Jersey