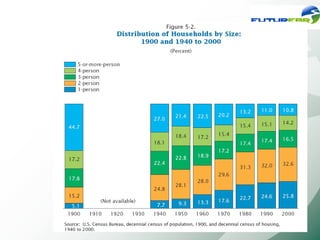
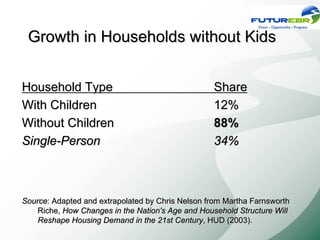
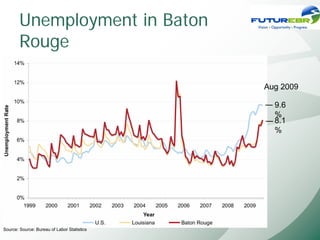
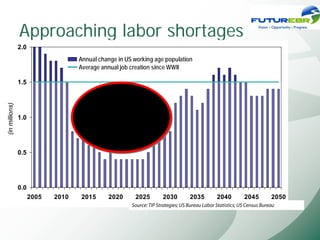
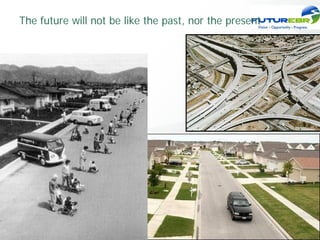
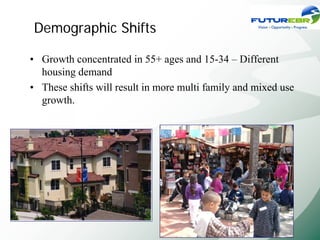
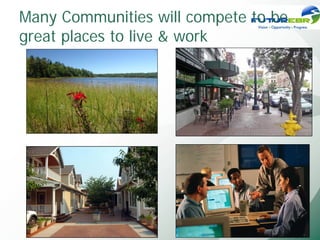
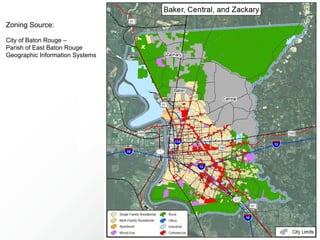
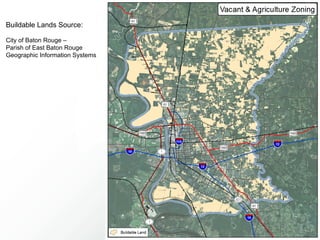
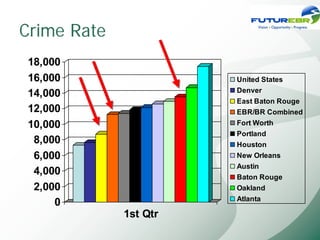
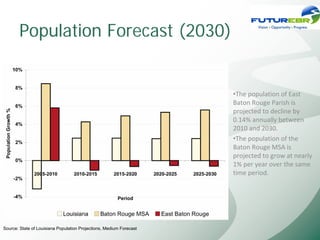
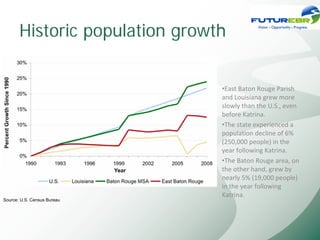
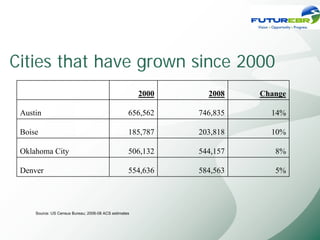
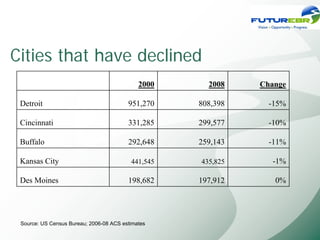
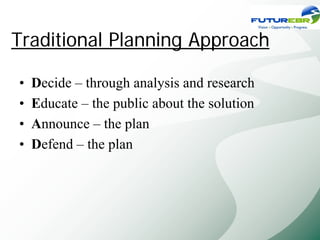
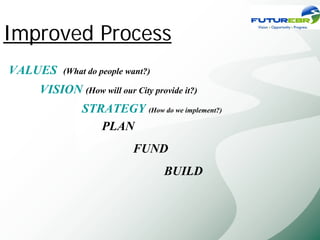
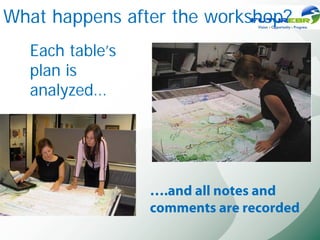
What is Vision?
What is Vision?
The Evolving American
Vision
The Emerging American
Vision
People Turning 65 in Year
                          Thousands


              0
                  500
                                1,000
                                              1,500
                                                      2,000
       1996
       1997
       1998
       1999
       2000
       2001
       2002
       2003
       2004
       2005
       2006
       2007
       2008
       2009
                                                                      1996-2025


       2010
       2011


Year
       2012
       2013
       2014
       2015
       2016
       2017
                                                              People Turning 65 Annually


       2018
       2019
       2020
       2021
       2022
       2023
       2024
       2025
Growth in Households without Kids


Household Type                                    Share
With Children                                     12%
Without Children                                  88%
Single-Person                                     34%


Source: Adapted and extrapolated by Chris Nelson from Martha Farnsworth
    Riche, How Changes in the Nation's Age and Household Structure Will
    Reshape Housing Demand in the 21st Century, HUD (2003).
Unemployment in Baton
        Rouge

                                             Aug 2009

                                               9.6
                                               %
                                               8.1
                                               %


Source: Source: Bureau of Labor Statistics
Approaching labor shortages
                2.0
                                    Annual change in US working age population
                                    Average annual job creation since WWII

                1.5
(in millions)


                1.0


                0.5


                0.0
                      2005   2010   2015      2020      2025         2030         2035         2040         2045         2050
                                                       Source: TIP Strategies; US Bureau Labor Statistics; US Census Bureau
• In the Future, digital access will be synonymous with
  achievement


  A Digital Economy
Oil prices will become
increasingly volatile
The future will not be like the past, nor the present
Demographic Shifts

• Growth concentrated in 55+ ages and 15-34 – Different
  housing demand
• These shifts will result in more multi family and mixed use
  growth.
Many Communities will compete to be
great places to live & work


 Open Spaces and Parks
Trends

 Strong forces will put a premium on:
   1.   Energy efficient, sustainable communities
   2.   Places Attractive to Workforce
   3.   Effective Transportation
   4.   Great Livability
   5.   More Options for Travel, Housing
        Shopping, and Work
Zoning Source:

City of Baton Rouge –
Parish of East Baton Rouge
Geographic Information Systems
Buildable Lands Source:

City of Baton Rouge –
Parish of East Baton Rouge
Geographic Information Systems
Source:
          FEMA (Federal
Emergency Management Agency)
Source:
           USGS
(US Geological Survey)
Buildout with no Environmental
Constraints

Households Increase = 71,853
Employment Increase = 319,452
Buildout with Floodplains &
Wetlands Constrained

Households Increase = 43,888
Employment Increase = 107,386
Economic trends and forecasts
Income in Baton Rouge


                                •East Baton Rouge 
                                households are wealthier 
                                than the State, though 
                                slightly less prosperous 
                                than the entire Baton 
                                Rouge MSA.


Source: Claritas Inc.
Income by Race


Source: Claritas Inc.
Education by Race


Source: U.S. American Community Survey 2008
Historic Employment Growth:
       Pre-2000


Source: Louisiana Workforce Commission
Historic employment growth 2001-
       2008

Arts and entertain

 Manufacturing


Source: Louisiana Workforce Commission, Bureau of Labor Statistics
Employment forecast 2016
      (regional)


Source: Louisiana Workforce Commission
Employment share / region
• 63-65% region’s employment is in East
  Baton Rouge Parish
• The Parish accounts for half the new jobs
  in the region


                                               Number of Jobs   Growth
                                               2001      2008    01-08
Louisiana                                    1,864,538 1,885,531 20,993
Regional Labor Market                          377,958   417,973 40,015
  Percent of State                                20%       22%
East Baton Rouge                               245,176   264,262 19,086
  Percent of Region                               65%       63%
    Source: Louisiana Workforce Commission
Crime Rate
18,000
16,000                 United States
                       Denver
14,000
                       East Baton Rouge
12,000                 EBR/BR Combined
10,000                 Fort Worth
                       Portland
 8,000                 Houston
 6,000                 New Orleans
                       Austin
 4,000                 Baton Rouge
 2,000                 Oakland
                       Atlanta
     0
             1st Qtr
Population Forecast (2030)


                                                                     •The population of East 
                                                                     Baton Rouge Parish is 
                                                                     projected to decline by 
                                                                     0.14% annually between 
                                                                     2010 and 2030.
                                                                     •The population of the 
                                                                     Baton Rouge MSA is 
                                                                     projected to grow at nearly 
                                                                     1% per year over the same 
                                                                     time period.


Source: State of Louisiana Population Projections, Medium Forecast
Historic population growth


                                •East Baton Rouge Parish 
                                and Louisiana grew more 
                                slowly than the U.S., even 
                                before Katrina.
                                •The state experienced a 
                                population decline of 6% 
                                (250,000 people) in the 
                                year following Katrina.
                                •The Baton Rouge area, on 
                                the other hand, grew by 
                                nearly 5% (19,000 people) 
                                in the year following 
                                Katrina.
Source: U.S. Census Bureau
Cities that have grown since 2000
                                                       2000     2008    Change

 Austin                                            656,562    746,835     14%

 Boise                                             185,787    203,818     10%

 Oklahoma City                                     506,132    544,157      8%

 Denver                                            554,636    584,563      5%


     Source: US Census Bureau; 2006-08 ACS estimates
Cities that have declined
                                             2000     2008    Change

 Detroit                                 951,270    808,398     -15%

 Cincinnati                              331,285    299,577     -10%

 Buffalo                                 292,648    259,143     -11%

 Kansas City                              441,545   435,825     -1%

 Des Moines                              198,682    197,912      0%


 Source: US Census Bureau; 2006-08 ACS estimates
Traditional Planning Approach

•   Decide – through analysis and research
•   Educate – the public about the solution
•   Announce – the plan
•   Defend – the plan
Traditional Planning Approach

 •   D
 •   E
 •   A
 •   D
Improved Process
VALUES   (What do people want?)

   VISION (How will our City provide it?)
             STRATEGY (How do we implement?)
                PLAN
                          FUND
                                  BUILD
Community Workshops
1


       2


                  3
Two Scales – Parish and
Neighborhood


                          Parish
    Neighborhood
Workshop Game Pieces
or “Chips”
What happens after the workshop?
  Each table’s
  plan is
  analyzed…


                 ….and all notes and
                 comments are recorded
GIS Analysis


Each map was
photographed,
digitized, and
entered into
GIS
All Chips Placed
  University
   of Tulsa               Zoo                                             Downtown
                                Airport                                   Urban
                                                                          Main Street
                                                                          Transit Development
                                                  I-244                   Village
                                                                          Business Park
               Downtown                                                   Commercial Center
                                                                          Strip Center
                                                                          Light Industrial
Refineries                                                                Urban Neighborhood
                                                                          Small Lot Subdivision
                                                                          Residential Subdivision
                                                          Eastland Mall
                                                              Area
                                                                          Large Lot Subdivision


                                          41st and Memorial
  Peoria


      Skelly Drive
Scenario
Choices

Broad Outreach
Scenario Options


    A              B


    C              D
Scenarios are Crash Test Dummies
Scenario C
Shown with the
transportation network and
existing surrounding plans


                             Scenario C
Modeling the Scenarios
                         Owner                  Renter                     Year 2000

  350,000

  300,000                                                                                43%

  250,000                                                            57%

  200,000

  150,000
                                                                           Vision 2030

  100,000

  50,000
                                                                    48%
     -                                                                                    52%
            SF Det    SF Att     MF   SF Det     SF Att      MF

                     Year 2000                 Vision 2030


              Market Constraints                                                                           Sustainability
            Development Program                                                                            Urban Design
             Commercial Demand
               Housing Needs


Land Use Scenario
  Tipping Point
  Development                                                                                   Transportation Analysis
                                                                                                   Roadway Impact
                                                                                                      Ridership
Prototype Buildings
Prototype Buildings
Original Standards             New Standards
Prototypes                     Prototypes

Apartment                      Cottage Home
Single Family Home 5-8K Lot    Townhome
Single Family Home 8-15K Lot   Live / Work
                               Neighborhood Grocery (1 Story)
Business Park                  Neighborhood Retail (1 Story)
Mid-Rise Business Park         Mixed Use Apartments & Retail (2 Story)
Retail Mall                    Mixed Use Retail & Office (2 Story)
Strip Commercial               Mixed Use Retail & Office (3 Story)
Heavy Industrial               Mixed Use Residential & Retail (4 Story)
Light Industrial               High Density Condo or Apartments (5 Story)
                               Office Retail (3 Story)
                               Office Retail (5 Story)
                               Office Retail (10 Story)
Financial Analysis and
Modeling
Vetting the Prototypes
Testing ideas in real
world situations

Site size:
360,000 Square Feet
Big-Box Retail Rehabilitation
How the Scenarios Compare
Daily Transit Ridership
450,000

400,000

350,000

300,000

250,000

200,000

150,000

100,000

 50,000

     0
                      A               B               C                D
              a rio           a rio           a rio              rio
            en              en              en              e na
          Sc              Sc              Sc              Sc
Housing Match (to income and
preference)
250,000
                                                                                                                    Balanced
200,000                                                                                                           Housing Index
                                                                                                                     Score
150,000

100,000                                                                                                              80
  50,000

              0
                        .            .            s.               s.                           ily
                     es            es           Re              Re
                                                                                 e                           FR
                il/R          il/R                                          hom              am            tS
              ta            ta              ory            ory           wn             le
                                                                                           F
                                                                                                       eL
                                                                                                          o
            Re            Re            -St           - St             To            ng             rg
         MU            MU
                                       8             3              ry             Si             La
   to ry         to ry                                          Sto          t ory
                                                             2-           2-S
8-S          3-S


                      Scenario B (Units)              SV Proportional Profile (Units)
Economy
Scenario has the best sales tax performance of all

Additional City Sales Tax Revenue
  $50,000,000

  $40,000,000

  $30,000,000

  $20,000,000

  $10,000,000

          $0
                Trend   Workshop Scenario C Scenario D Scenario T
Scorecard
Comprehensive Plan Design

Four Components

•   Vision

•   Policy Plan

•   Implementation Plan

•   Monitoring System


                            66
1st Component
    The Vision
Capturing the City -Parish’s
  dreams:
•   Core Values derived from
    broad-based public input
•   Key Initiatives to realize the
    Vision
•   Vision Illustration based on a
    palette of building blocks or
    development patterns


                                     67
2nd Component
The Policy Document
•   Eleven Elements linked that establish the policy
    foundation for achieving the Vision:
     –   Future Land Use
     –   Transportation Element
     –   Economy
     –   Infrastructure and Capital Improvements Plan
     –   Conservation and Environmental Resources
     –   Recreation and Open Space
     –   Housing
     –   Public Services and Facilities/Buildings
     –   Urban Design, Development, and Redevelopment
     –   Health and Human Services
     –   Natural Hazards
•   Updated on 5 to 10 year cycle


                                                        68
Land Use Element

•   Establishes basis for zoning capacity to
    achieve growth targets
•   Balances and integrates land uses with
    transportation systems to enable
    sustainable growth
•   Institutes a framework for ongoing,
    small area planning to refine and
    implement the Vision


                                               69
Urban Design Element

•   Establishes urban design policies tied to Vision building blocks
     – Encourages architecture that responds to the surrounding community
       in context and scale


                                                                            70
Housing Element

Recognizes EBR’s urban future
 – Encourages new types of ownership
   opportunities for non-traditional home buyers
 – Encourages housing supply to meet needs
   across the income spectrum for future
   generations
 – Creates housing conditions to attract middle
   income families to the Southern Sector


                                                   71
Economic Element
             Establishes policies that
             advance economic goals
              – Fosters expansion and retention of
                business and industry
              – Informs land use element to ensure
                it provides the right zoning for the
                right development in the right
                places


                                                       72
A strong Parks, Open Space
and Environmental element
Transportation Element
•   Establishes fundamental linkage
    land use and transportation

•   Establishes Context Sensitive
    Design (CSD) standards for streets
•   Identifies key projects


                                         74
Land Use & Transportation
Connection
Land Use & Transportation
Connection
Land Use & Transportation
Connection
Matching Street Design to Land Use
One size does not fit all
Streets should respond to the land uses around them
Transit Options
Current Usage of Transit
3rd Component
The Implementation Plan
Implementation
Plans
Upcoming Events
•   2010
•   January 26, 27 (kick-off Event)
•   March 2-4th (Parish Wide workshops)
•   April 6th-8th (Neighborhood workshops)
•   May 18th-20th
•   Summarize workshop results
•   June 22nd-24th
•   Presentation of scenarios and initial strategic issues
www.futurebr.com
Ebr Dec 2009

Ebr Dec 2009

  • 3.
  • 4.
  • 5.
  • 7.
  • 8.
    People Turning 65in Year Thousands 0 500 1,000 1,500 2,000 1996 1997 1998 1999 2000 2001 2002 2003 2004 2005 2006 2007 2008 2009 1996-2025 2010 2011 Year 2012 2013 2014 2015 2016 2017 People Turning 65 Annually 2018 2019 2020 2021 2022 2023 2024 2025
  • 10.
    Growth in Householdswithout Kids Household Type Share With Children 12% Without Children 88% Single-Person 34% Source: Adapted and extrapolated by Chris Nelson from Martha Farnsworth Riche, How Changes in the Nation's Age and Household Structure Will Reshape Housing Demand in the 21st Century, HUD (2003).
  • 11.
    Unemployment in Baton Rouge Aug 2009 9.6 % 8.1 % Source: Source: Bureau of Labor Statistics
  • 12.
    Approaching labor shortages 2.0 Annual change in US working age population Average annual job creation since WWII 1.5 (in millions) 1.0 0.5 0.0 2005 2010 2015 2020 2025 2030 2035 2040 2045 2050 Source: TIP Strategies; US Bureau Labor Statistics; US Census Bureau
  • 13.
    • In theFuture, digital access will be synonymous with achievement A Digital Economy
  • 14.
    Oil prices willbecome increasingly volatile
  • 15.
    The future willnot be like the past, nor the present
  • 16.
    Demographic Shifts • Growthconcentrated in 55+ ages and 15-34 – Different housing demand • These shifts will result in more multi family and mixed use growth.
  • 17.
    Many Communities willcompete to be great places to live & work Open Spaces and Parks
  • 18.
    Trends Strong forceswill put a premium on: 1. Energy efficient, sustainable communities 2. Places Attractive to Workforce 3. Effective Transportation 4. Great Livability 5. More Options for Travel, Housing Shopping, and Work
  • 19.
    Zoning Source: City ofBaton Rouge – Parish of East Baton Rouge Geographic Information Systems
  • 20.
    Buildable Lands Source: Cityof Baton Rouge – Parish of East Baton Rouge Geographic Information Systems
  • 21.
    Source: FEMA (Federal Emergency Management Agency)
  • 22.
    Source: USGS (US Geological Survey)
  • 23.
    Buildout with noEnvironmental Constraints Households Increase = 71,853 Employment Increase = 319,452
  • 24.
    Buildout with Floodplains& Wetlands Constrained Households Increase = 43,888 Employment Increase = 107,386
  • 25.
  • 26.
    Income in BatonRouge •East Baton Rouge  households are wealthier  than the State, though  slightly less prosperous  than the entire Baton  Rouge MSA. Source: Claritas Inc.
  • 27.
  • 28.
    Education by Race Source:U.S. American Community Survey 2008
  • 29.
    Historic Employment Growth: Pre-2000 Source: Louisiana Workforce Commission
  • 30.
    Historic employment growth2001- 2008 Arts and entertain Manufacturing Source: Louisiana Workforce Commission, Bureau of Labor Statistics
  • 31.
    Employment forecast 2016 (regional) Source: Louisiana Workforce Commission
  • 32.
    Employment share /region • 63-65% region’s employment is in East Baton Rouge Parish • The Parish accounts for half the new jobs in the region Number of Jobs Growth 2001 2008 01-08 Louisiana 1,864,538 1,885,531 20,993 Regional Labor Market 377,958 417,973 40,015 Percent of State 20% 22% East Baton Rouge 245,176 264,262 19,086 Percent of Region 65% 63% Source: Louisiana Workforce Commission
  • 33.
    Crime Rate 18,000 16,000 United States Denver 14,000 East Baton Rouge 12,000 EBR/BR Combined 10,000 Fort Worth Portland 8,000 Houston 6,000 New Orleans Austin 4,000 Baton Rouge 2,000 Oakland Atlanta 0 1st Qtr
  • 34.
    Population Forecast (2030) •The population of East  Baton Rouge Parish is  projected to decline by  0.14% annually between  2010 and 2030. •The population of the  Baton Rouge MSA is  projected to grow at nearly  1% per year over the same  time period. Source: State of Louisiana Population Projections, Medium Forecast
  • 35.
    Historic population growth •East Baton Rouge Parish  and Louisiana grew more  slowly than the U.S., even  before Katrina. •The state experienced a  population decline of 6%  (250,000 people) in the  year following Katrina. •The Baton Rouge area, on  the other hand, grew by  nearly 5% (19,000 people)  in the year following  Katrina. Source: U.S. Census Bureau
  • 36.
    Cities that havegrown since 2000 2000 2008 Change Austin 656,562 746,835 14% Boise 185,787 203,818 10% Oklahoma City 506,132 544,157 8% Denver 554,636 584,563 5% Source: US Census Bureau; 2006-08 ACS estimates
  • 37.
    Cities that havedeclined 2000 2008 Change Detroit 951,270 808,398 -15% Cincinnati 331,285 299,577 -10% Buffalo 292,648 259,143 -11% Kansas City 441,545 435,825 -1% Des Moines 198,682 197,912 0% Source: US Census Bureau; 2006-08 ACS estimates
  • 39.
    Traditional Planning Approach • Decide – through analysis and research • Educate – the public about the solution • Announce – the plan • Defend – the plan
  • 40.
    Traditional Planning Approach • D • E • A • D
  • 41.
    Improved Process VALUES (What do people want?) VISION (How will our City provide it?) STRATEGY (How do we implement?) PLAN FUND BUILD
  • 42.
  • 43.
    Two Scales –Parish and Neighborhood Parish Neighborhood
  • 44.
  • 46.
    What happens afterthe workshop? Each table’s plan is analyzed… ….and all notes and comments are recorded
  • 47.
    GIS Analysis Each mapwas photographed, digitized, and entered into GIS
  • 48.
    All Chips Placed University of Tulsa Zoo Downtown Airport Urban Main Street Transit Development I-244 Village Business Park Downtown Commercial Center Strip Center Light Industrial Refineries Urban Neighborhood Small Lot Subdivision Residential Subdivision Eastland Mall Area Large Lot Subdivision 41st and Memorial Peoria Skelly Drive
  • 49.
  • 50.
  • 51.
    Scenarios are CrashTest Dummies
  • 52.
    Scenario C Shown withthe transportation network and existing surrounding plans Scenario C
  • 54.
    Modeling the Scenarios Owner Renter Year 2000 350,000 300,000 43% 250,000 57% 200,000 150,000 Vision 2030 100,000 50,000 48% - 52% SF Det SF Att MF SF Det SF Att MF Year 2000 Vision 2030 Market Constraints Sustainability Development Program Urban Design Commercial Demand Housing Needs Land Use Scenario Tipping Point Development Transportation Analysis Roadway Impact Ridership
  • 55.
  • 56.
    Prototype Buildings Original Standards New Standards Prototypes Prototypes Apartment Cottage Home Single Family Home 5-8K Lot Townhome Single Family Home 8-15K Lot Live / Work Neighborhood Grocery (1 Story) Business Park Neighborhood Retail (1 Story) Mid-Rise Business Park Mixed Use Apartments & Retail (2 Story) Retail Mall Mixed Use Retail & Office (2 Story) Strip Commercial Mixed Use Retail & Office (3 Story) Heavy Industrial Mixed Use Residential & Retail (4 Story) Light Industrial High Density Condo or Apartments (5 Story) Office Retail (3 Story) Office Retail (5 Story) Office Retail (10 Story)
  • 57.
  • 58.
    Vetting the Prototypes Testingideas in real world situations Site size: 360,000 Square Feet
  • 59.
  • 60.
  • 61.
    Daily Transit Ridership 450,000 400,000 350,000 300,000 250,000 200,000 150,000 100,000 50,000 0 A B C D a rio a rio a rio rio en en en e na Sc Sc Sc Sc
  • 62.
    Housing Match (toincome and preference) 250,000 Balanced 200,000 Housing Index Score 150,000 100,000 80 50,000 0 . . s. s. ily es es Re Re e FR il/R il/R hom am tS ta ta ory ory wn le F eL o Re Re -St - St To ng rg MU MU 8 3 ry Si La to ry to ry Sto t ory 2- 2-S 8-S 3-S Scenario B (Units) SV Proportional Profile (Units)
  • 63.
    Economy Scenario has thebest sales tax performance of all Additional City Sales Tax Revenue $50,000,000 $40,000,000 $30,000,000 $20,000,000 $10,000,000 $0 Trend Workshop Scenario C Scenario D Scenario T
  • 64.
  • 66.
    Comprehensive Plan Design FourComponents • Vision • Policy Plan • Implementation Plan • Monitoring System 66
  • 67.
    1st Component The Vision Capturing the City -Parish’s dreams: • Core Values derived from broad-based public input • Key Initiatives to realize the Vision • Vision Illustration based on a palette of building blocks or development patterns 67
  • 68.
    2nd Component The PolicyDocument • Eleven Elements linked that establish the policy foundation for achieving the Vision: – Future Land Use – Transportation Element – Economy – Infrastructure and Capital Improvements Plan – Conservation and Environmental Resources – Recreation and Open Space – Housing – Public Services and Facilities/Buildings – Urban Design, Development, and Redevelopment – Health and Human Services – Natural Hazards • Updated on 5 to 10 year cycle 68
  • 69.
    Land Use Element • Establishes basis for zoning capacity to achieve growth targets • Balances and integrates land uses with transportation systems to enable sustainable growth • Institutes a framework for ongoing, small area planning to refine and implement the Vision 69
  • 70.
    Urban Design Element • Establishes urban design policies tied to Vision building blocks – Encourages architecture that responds to the surrounding community in context and scale 70
  • 71.
    Housing Element Recognizes EBR’surban future – Encourages new types of ownership opportunities for non-traditional home buyers – Encourages housing supply to meet needs across the income spectrum for future generations – Creates housing conditions to attract middle income families to the Southern Sector 71
  • 72.
    Economic Element Establishes policies that advance economic goals – Fosters expansion and retention of business and industry – Informs land use element to ensure it provides the right zoning for the right development in the right places 72
  • 73.
    A strong Parks,Open Space and Environmental element
  • 74.
    Transportation Element • Establishes fundamental linkage land use and transportation • Establishes Context Sensitive Design (CSD) standards for streets • Identifies key projects 74
  • 75.
    Land Use &Transportation Connection
  • 76.
    Land Use &Transportation Connection
  • 77.
    Land Use &Transportation Connection
  • 78.
    Matching Street Designto Land Use One size does not fit all Streets should respond to the land uses around them
  • 79.
  • 80.
  • 81.
  • 82.
  • 83.
    Upcoming Events • 2010 • January 26, 27 (kick-off Event) • March 2-4th (Parish Wide workshops) • April 6th-8th (Neighborhood workshops) • May 18th-20th • Summarize workshop results • June 22nd-24th • Presentation of scenarios and initial strategic issues
  • 84.