Show various use cases and scenarios for Hadoop (tooling) on the cloud and modern data architectures.
•New insights into Analytics and Visualization, to impact the business bottom line.
•Tooling and insights provided by non-traditional approaches to data
•Example a 360 view of the customer,
•Sentiment analysis with social media such as Twitter, traffic patterns, etc.
Big data analytics: Technology's bleeding edgeBhavya Gulati
There can be data without information , but there can not be information without data.
Companies without Big Data Analytics are deaf and dumb , mere wanderers on web.
Application of Clustering in Data Science using Real-life Examples Edureka!
Clustering data into subsets is an important task for many data science applications. It is considered as one of the most important unsupervised learning technique. Keeping this in mind, we have come with a free webinar ‘Application of Cluster in Data Science using Real-life examples.’
IJACT–International Journal of engineering science, computer science is indexed by major Indexing sites which are DOAJ, Index Copernicus,Google Scholar. For more: http://ijact.in
IJRET : International Journal of Research in Engineering and Technology is an international peer reviewed, online journal published by eSAT Publishing House for the enhancement of research in various disciplines of Engineering and Technology. The aim and scope of the journal is to provide an academic medium and an important reference for the advancement and dissemination of research results that support high-level learning, teaching and research in the fields of Engineering and Technology. We bring together Scientists, Academician, Field Engineers, Scholars and Students of related fields of Engineering and Technology.
Presented by: Joseph Rickert, Data Scientist Community Manager, Revolution Analytics, Sep 25 2014.
Whenever data scientists are asked about what software they use R always comes up at the top of the list. In one recent survey, only SQL was rated higher than R. In this webinar we will explore what makes R so popular and useful. Starting with the big picture, we describe how R is organized and how to find your way around the R world. Then we will work through some examples highlighting features of R that make it attractive for data science work including:
Acquiring data
Data manipulation
Exploratory data analysis
Model building
Machine learning
Big Data Analysis in Hydrogen Station using Spark and Azure MLJongwook Woo
Decision Forest machine learning algorithm is adopted to find out the features to affect the temperature of fueling valve and controller and to predict it.
A final project presentation on the project based on THE GDELT Database.
Complete Report : https://samvat.github.io/ivmooc-gdelt-project/The GDELT Project - Final Report.pdf
Twitter word frequency count using hadoop components 150331221753pradip patel
Abstract- Analysis of twitter data can be very useful for marketing as well as for promotion strategies. This paper
implements word frequency count for 1.5+ million twitters dataset .The hadoop components such as Apache pig and
MapReduce framework are used for parallel execution of the data. This parallel execution makes the implementation
time-effective and feasible to execute on a single system
Exploring Correlation Between Sentiment of Environmental Tweets and the Stock...Data Works MD
Video of the presentation is available here: https://youtu.be/L6EMnvALYtU
Talk: Fortune 500 Company Performance Analysis Using Social Networks
Speaker: Yi-Shan Shir
This presentation focus on studying the correlation between financial performance and social media relationship and behavior of Fortune 500 companies. The findings from this research can assist in the prediction of Fortune 500 stock performance based on a number of social network analysis metrics.
Democratizing Machine Learning: Perspective from a scikit-learn CreatorDatabricks
<p>Once an obscure branch of applied mathematics, machine learning is now the darling of tech. I will talk about lessons learned democratizing machine learning. How libraries like scikit-learn were designed to empower users: simplifying but avoiding ambiguous behaviors. How the Python data ecosystem was built from scientific computing tools: the importance of good numerics. How some machine-learning patterns easily provide value to real-world situations. I will also discuss remain challenges to address and the progresses that we are making. Scaling up brings different bottlenecks to numerics. Integrating data in the statistical models, a hurdle to data-science practice requires to rethink data cleaning pipelines.</p><p>This talk will drawn from my experience as a scikit-learn developer, but also as a researcher in machine learning and applications.</p>
Global warming big data is analyzed and processed using Pig, Hive, Mapreduce, HDFC, HBase technologies. Results are visualized using Tableau and stored in HBase in Programming in Data Analytics Project.
Monitoring world geopolitics through Big Data by Tomasa Rodrigo and Álvaro Or...Big Data Spain
Data from the media allows to enrich our analysis and to incorporate these insights into our models to capture nonlinear behaviour and feedback effects of human interaction, assessing their global impact on the society and enabling us to construct fragility indices and early warning systems.
https://www.bigdataspain.org/2017/talk/monitoring-world-geopolitics-through-big-data
Big Data Spain 2017
16th - 17th November Kinépolis Madrid
Enhance The Technique For Searching Dimension Incomplete Databasespaperpublications3
Abstract: Data ambiguity is major problem in the information retrieval ambiguity is due to the loss in the data dimension it causes lot of problem in various real life application. Database may incomplete due to missing dimension and value. In previous work is totally based on the missing value. We focus on the problem is to find the missing dimension in our work. Missing dimension leads towards the problem in the traditional query approach. Missing dimension information create computational problem, so large number of possible combinations of missing dimensions need to be examined to check similarity between the query object and the data objects . Our aim is to reduce the all recovery version to increase the system performance as number of possible recovery data is reduces the time to estimate the true result is also reduces. Keywords: Missing Dimensions, Similarity search, Whole sequence query, Probability triangle inequality, Temporal data.
Title: Enhance The Technique For Searching Dimension Incomplete Databases
Author: Mr. Amol Patil, Prof. Saba Siraj, Miss. Ashwini Sagade
ISSN 2350-1022
International Journal of Recent Research in Mathematics Computer Science and Information Technology
Paper Publications
Data Science : Make Smarter Business DecisionsEdureka!
Data Science training certifies you with ‘in demand’ Big Data Technologies to help you grab the top paying Data Science job title with Big Data skills and expertise in R programming, Machine Learning and Hadoop framework. A Data Scientist deals with all the phases of data life cycle ranging from Data Acquisition and Data Storage using R-Hadoop concepts, applying modelling through R programming using Machine learning algorithms and illustrate impeccable Data Visualization by leveraging on 'R' capabilities.
Data analysis using hive ql & tableaupkale1708
The purpose of this study is to develop a system which will assist a user to determine if a location can be entitled as a “Safe” residence or not. The output will be based on an analysis carried out on the local crime history of the city. This involves examining a huge geolocation data and zeroing down to a single area. The area with majority crime incidents will be highlighted as Unsafe. Clicking/hovering on a single record will display name, associated crime and its rank depending on number of crimes occurred. Big Data Hadoop and Hive systems are implemented in Azure for the analysis.
An overview of crime report and analysis shows a significant amount of information related to crime. Multiple factors need to be considered while studying the different aspects of crime. These multiple measures are found in Uniform Crime Reports data and the National Crime Victimization Survey, a survey that interrogates the victim about their experience. Our paper depicts the nature and characteristics of crime using Hadoop Big Data systems, especially Hive in Azure. Besides, the map of the Geo-location presents which area is safe or unsafe. The results of different Hive queries are visualized using Tableau.
We present a software model built on the Apache software stack (ABDS) that is well used in modern cloud computing, which we enhance with HPC concepts to derive HPC-ABDS.
We discuss layers in this stack
We give examples of integrating ABDS with HPC
We discuss how to implement this in a world of multiple infrastructures and evolving software environments for users, developers and administrators
We present Cloudmesh as supporting Software-Defined Distributed System as a Service or SDDSaaS with multiple services on multiple clouds/HPC systems.
We explain the functionality of Cloudmesh as well as the 3 administrator and 3 user modes supported
Visualizing and Clustering Life Science Applications in Parallel Geoffrey Fox
HiCOMB 2015 14th IEEE International Workshop on
High Performance Computational Biology at IPDPS 2015
Hyderabad, India. This talk covers parallel data analytics for bioinformatics. Messages are
Always run MDS. Gives insight into data and performance of machine learning
Leads to a data browser as GIS gives for spatial data
3D better than 2D
~20D better than MSA?
Clustering Observations
Do you care about quality or are you just cutting up space into parts
Deterministic Clustering always makes more robust
Continuous clustering enables hierarchy
Trimmed Clustering cuts off tails
Distinct O(N) and O(N2) algorithms
Use Conjugate Gradient
5th Multicore World
15-17 February 2016 – Shed 6, Wellington, New Zealand
http://openparallel.com/multicore-world-2016/
We start by dividing applications into data plus model components and classifying each component (whether from Big Data or Big Simulations) in the same way. These leads to 64 properties divided into 4 views, which are Problem Architecture (Macro pattern); Execution Features (Micro patterns); Data Source and Style; and finally the Processing (runtime) View.
We discuss convergence software built around HPC-ABDS (High Performance Computing enhanced Apache Big Data Stack) http://hpc-abds.org/kaleidoscope/ and show how one can merge Big Data and HPC (Big Simulation) concepts into a single stack.
We give examples of data analytics running on HPC systems including details on persuading Java to run fast.
Some details can be found at http://dsc.soic.indiana.edu/publications/HPCBigDataConvergence.pdf
High Performance Processing of Streaming DataGeoffrey Fox
Describes two parallel robot planning algorithms implemented with Apache Storm on OpenStack -- SLAM (Simultaneous Localization & Mapping) and collision avoidance. Performance (response time) studied and improved as example of HPC-ABDS (High Performance Computing enhanced Apache Big Data Software Stack) concept.
International Journal of Engineering Research and Development (IJERD)IJERD Editor
journal publishing, how to publish research paper, Call For research paper, international journal, publishing a paper, IJERD, journal of science and technology, how to get a research paper published, publishing a paper, publishing of journal, publishing of research paper, reserach and review articles, IJERD Journal, How to publish your research paper, publish research paper, open access engineering journal, Engineering journal, Mathemetics journal, Physics journal, Chemistry journal, Computer Engineering, Computer Science journal, how to submit your paper, peer reviw journal, indexed journal, reserach and review articles, engineering journal, www.ijerd.com, research journals,
yahoo journals, bing journals, International Journal of Engineering Research and Development, google journals, hard copy of journal
Big Data Tools: A Deep Dive into Essential ToolsFredReynolds2
Today, practically every firm uses big data to gain a competitive advantage in the market. With this in mind, freely available big data tools for analysis and processing are a cost-effective and beneficial choice for enterprises. Hadoop is the sector’s leading open-source initiative and big data tidal roller. Moreover, this is not the final chapter! Numerous other businesses pursue Hadoop’s free and open-source path.
In the recent years the scope of data mining has evolved into an active area of research because of the previously unknown and interesting knowledge from very large database collection. The data mining is applied on a variety of applications in multiple domains like in business, IT and many more sectors. In Data Mining the major problem which receives great attention by the community is the classification of the data. The classification of data should be such that it could be they can be easily verified and should be easily interpreted by the humans. In this paper we would be studying various data mining techniques so that we can find few combinations for enhancing the hybrid technique which would be having multiple techniques involved so enhance the usability of the application. We would be studying CHARM Algorithm, CM-SPAM Algorithm, Apriori Algorithm, MOPNAR Algorithm and the Top K Rules.
Project is focused on analyzing big data available on parking tickets in LA open data portal. To analyze the available Big data, Big data processing environment with the combination of Hadoop distributed environment, Map- Reduce programming using Pig and Java, SQL: MySQL and NoSQL: HBase databases for data storage is used.
Most common technology which is used to store meta data and large databases.we can find numerous applications in the real world.It is the very useful for creating new database oriented apps
1. Summer 2016 Reportby:ShreyaChakrabarti
Self-Learning Hadoop
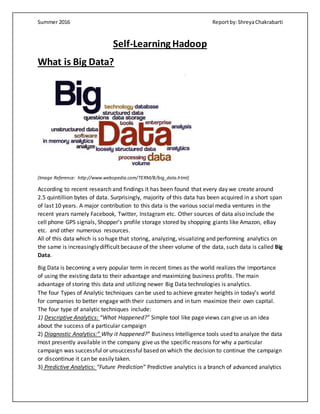
What is Big Data?
(Image Reference: http://www.webopedia.com/TERM/B/big_data.html)
According to recent research and findings it has been found that every day we create around
2.5 quintillion bytes of data. Surprisingly, majority of this data has been acquired in a short span
of last 10 years. A major contribution to this data is the various social media ventures in the
recent years namely Facebook, Twitter, Instagram etc. Other sources of data also include the
cell phone GPS signals, Shopper’s profile storage stored by shopping giants like Amazon, eBay
etc. and other numerous resources.
All of this data which is so huge that storing, analyzing, visualizing and performing analytics on
the same is increasingly difficult because of the sheer volume of the data, such data is called Big
Data.
Big Data is becoming a very popular term in recent times as the world realizes the importance
of using the existing data to their advantage and maximizing business profits. The main
advantage of storing this data and utilizing newer Big Data technologies is analytics.
The four Types of Analytic techniques can be used to achieve greater heights in today’s world
for companies to better engage with their customers and in turn maximize their own capital.
The four type of analytic techniques include:
1) Descriptive Analytics: “What Happened?” Simple tool like page views can give us an idea
about the success of a particular campaign
2) Diagnostic Analytics:” Why it happened?” Business Intelligence tools used to analyze the data
most presently available in the company give us the specific reasons for why a particular
campaign was successful or unsuccessful based on which the decision to continue the campaign
or discontinue it can be easily taken.
3) Predictive Analytics: “Future Prediction” Predictive analytics is a branch of advanced analytics
2. Summer 2016 Reportby:ShreyaChakrabarti
which is used to make predictions about unknown future events. Predictive analytics uses many
techniques like data mining, statistics modeling, machine learning and artificial intelligence to
analyze current data to make predictions about future.
4)Prescriptive Analytics: “Prevention better than cure” Once predictive analytics predicts what
needs to be done in order to maximize profits, care needs to be taken that nothing is done in
the opposite direction to hamper the profits.
Why Hadoop?
As discussed earlier Technology needs to advance at a drastic speed for the world to take
advantage of the existing as well as ever updating data.
Apache Hadoop is an open source software framework for distributed storage and distributed
processing of very large datasets on computer clusters built from commodity hardware.
In simple terms “Hadoop” can be said to be a database used to store large datasets and
perform data analysis on it.
Hadoop was designed on the base of Google File System paper published in 2003.Doug Cutting
the creator of Hadoop named it after his son’s toy elephant. Hadoop 0.1.0 was released in April
2006 and continues to evolve by the many contributors to the Apache Hadoop project.
Hadoop is based on Map-Reduce algorithms
Hadoop
Components
Hadoop
Distributed File
System
MapReduce
Processing
3. Summer 2016 Reportby:ShreyaChakrabarti
HDFS Architecture
(https://hadoop.apache.org/docs/r1.2.1/hdfs_design.html)
Apache Hadoop is a framework that allows for the distributed processing of large data sets
across clusters of commodity computers using a simple programming model. It is an open-
source data management framework with scale out storage and distributed processing
capabilities. It distributes data across multiple machines. Files are logically divided into equal
sized blocks. Blocks are spread across multiple machines who create replicas of blocks. Three
replicas are maintained to ensure availability. Data integrity is maintained by computing the
block checksum. The Name-node maintains address of the blocks on the respective data-nodes.
Whenever data is requested the name-node provides the address of the data physically closest
to the client. The secondary name node serves as a checkpoint server and is not a replacement
to Primary name-node when it fails.
4. Summer 2016 Reportby:ShreyaChakrabarti
Map Reduce
Earlier spawned from Google Map-Reduce is a popular algorithm for processing and generating
large data sets. The name MapReduce originally referred to the proprietary Google technology,
but has since been genericized. Google, however has moved on to newer technologies since
2014.
The belowdiagramisfromGoogle’sorignal Mapreduce paper.The diagramdescribesthe workingof the
Map-Reduce algorithm.
The Map-Reduce algorithm breaks down into three important steps namely Map, Group & Sort
and Reduce.
The MAP part of the algorithm divides the data into key: value pairs. The Key is the most
important part of the Map function as this key is further used by the reduce function too.
Group and sort basically groups the values with same keys together to make it simpler for the
next stage of Reducer.
The final stage of the Reducer is that it receives the grouped and sorted data from the previous
stage and selects the output desired from the processing of the dataset.
5. Summer 2016 Reportby:ShreyaChakrabarti
Some of the examples which can give an in depth understanding of MapReduce are explained
in below projects.
Mini-Project 1: Max and MinTemperatures in year 1800
The dataset in this mini project contains temperatures from the year 1800 which were recorded
at various weather stations.
The dataset can be explained as below:
The data also contains some other fields which are not relevant to our mini project.
We will be finding out the “Minimum Temperatures at a particularWeatherStation
throughout the year 1800” and “Maximum Temperatures at that particular Weather Station
throughout the year 1800”.(There are only two weather stations included in this particular
dataset)
Understanding the data plays a very important role in determining the “Map” and “Reduce”
part for writing a Map-Reduce Program.
Weather Station
Code
Date inthe year
1800 whenthe
temperature was
recorded
Type of
Temperature
(Maximumor
Minimum)
Temperaturesin
Celsius
6. Summer 2016 Reportby:ShreyaChakrabarti
The understanding of how a Map Reduce Program Works:
Data
Mapper (Key -Value Pairs)
Group and Sort
Reducer
The working of the Map-Reduce algorithm can be explained in the above diagram. The data is
then fed to the mapper where the mapper selects the required data which is relevant for the
result, basically separates the data into key-value pairs. Then this data is further grouped and
sorted according to the keys. The Reducer can be said to be a function which ultimately gives us
the result.
ITE00100554 18000101 TMAX -75
GM000010962 18000101 PRCP 0
EZE00100082 18000101 TMAX -86
E00100082 18000101 TMIN -135
EZE00100082 18000101 TMIN -135
ITE00100554 18000102 TMAX -60
ITE00100554 18000102 TMIN -125
GM000010962 18000102 PRCP 0
EZE00100082 18000102 TMAX -44
ITE00100554,-75 EZE00100082 ,-86
ITE00100554, -60
ITE00100554,-75,-60 EZE00100082 ,-86
ITE00100554,-60 EZE00100082 ,-86
7. Summer 2016 Reportby:ShreyaChakrabarti
The above logiccan be writtenasbelowinPythonLanguage Code
MinimumTemperature
MaximumTemperature
Mapper
(To establish Key-Value Pair)
Reducer
(For Final Results)
9. Summer 2016 Reportby:ShreyaChakrabarti
Mini-Project 2: Total Amount Orderedby eachcustomer
The datasetcontainsa listof customerswiththe amountstheyspendineachordertheyplacedina
restaurant.
The datasetcontains3 attributesnamelyCustomerID,OrderNumberandAmountSpend.
To write the code for thisdata analysisproblem, letusdesignanapproachforthe problem
Data
Mapper
The Mapper should be able to
establishthe Key-Value pair.Inthis
case the key value pair would be
Customer and the amount he
Spend.
Group and Sort
In group and sort there would be
grouping on the basis of the
customer.
The data after Grouping and
Sorting would contain the
CustomerNumberandthe amount
he spends in total
Reducer
The Reducerwould inturn produce
the output as to Customer with
what ID spend How much Money
in orders.
10. Summer 2016 Reportby:ShreyaChakrabarti
The code for the same is thus written as below in Python:
Output:
The output of this Project can also be improved by feeding the output of the first reducer into
another mapper to get a sorted output. This sort of MapReduce job is called “Chained
MapReduce Jobs”.
12. Summer 2016 Reportby:ShreyaChakrabarti
Project: Social Graph of Superhero’s
This dataset contains of Superhero Data from Marvel which mentions the appearance of Super
Hero’s with each other in various comic books. It basically traces the appearance of
superheroes with each other in various comic books which feature them.
The above image is a snippet from the data where the various numbers are assigned to various
characters and the first character(Highlighted) is the Superhero with the following numbers
belonging to other characters who the main character is Friends with.
Step:1 Find Total Number of Friends per Superhero
To find the most popular superhero first we need to map the character and the number of
friends the particular superhero has. To do this we need to add the friends per character and
map them as Key-Value pair and feed to the reducer. The reducer then adds up the number of
friends per character.
Step:2 Find Superhero with Maximum Friend Count
Mapper1: Count the number of
friends per character, per line.
Establish a key value pair of
Superhero: NumberOfFriends
Reducer1: Add up the
number of Friends per
Superhero
Reducer1: Total
number of friends per
Superhero
Mapper2: Substitute a
common key (Empty
Key) for example
None: 59 5933
where None: Key
59 5933: Value
Reducer2: Find out the
Superhero with max
friends
14. Summer 2016 Reportby:ShreyaChakrabarti
The load_name_dictionary displays the name of the Superhero from the superhero name file as
opposed to the code of the Superhero with the number of Friends he has.
Output:
Other Important Technologies inHadoop
YARN
Yarn can be simply called the operating system of Hadoop because it is responsible for
managing and monitoring workloads, maintaining a multi-tenant environment, implementing
security controls and managing high availability features of Hadoop.
(https://hadoop.apache.org/docs/r2.7.2/hadoop-yarn/hadoop-yarn-site/YARN.html)
15. Summer 2016 Reportby:ShreyaChakrabarti
Resource Manager: Master that arbitrates all the available cluster resources and thus helps
manage the distributed applications running on the YARN system.
Node Manager: Node Manager takes instructions from resource manager and manage
resources on a single node.
Application Master: Negotiators,applicationmastersare responsible fornegotiatingresourcesfrom
Resource Manager.
HIVE
Hive is an open source project run by volunteers at the Apache Software Foundation. Hive is
basically a data warehouse infrastructure built on top of Hadoop for providing data
summarization, query and analysis.
HIVE provides a SQL language HIVEQL with schema on read and transparently converts queries
to MapReduce.
SQOOP
Sqoop is a command-line interface application for transferring data between relational
databases and Hadoop. Sqoop got its name from SQL+Hadoop.
SPARK
Spark was developed in response to limitations in the MapReduce cluster computing paradigm.
Apache Spark is a fast, in-memory data processing engine with elegant and expressive
development APIs to allow data workers to efficiently execute streaming, machine learning or
SQL workloads that require fast iterative access to datasets. With Spark running on Apache
Hadoop YARN, developers everywhere can now create applications to exploit Spark’s power,
derive insights, and enrich their data science workloads within a single, shared dataset in
Hadoop.