Download to read offline
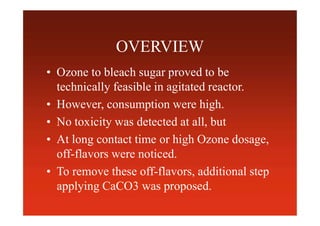
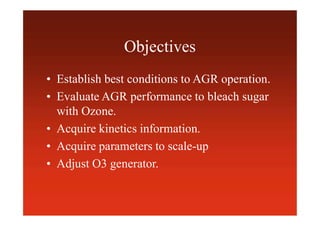
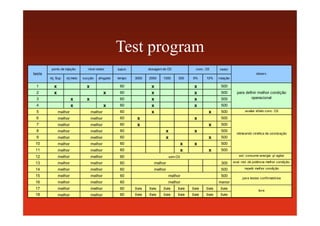
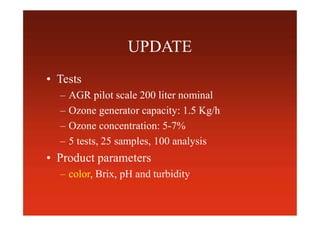
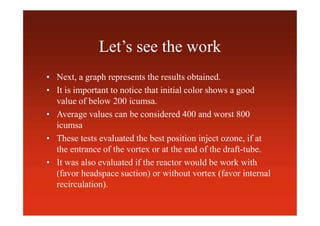
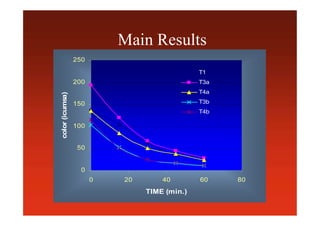

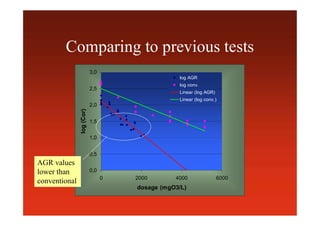
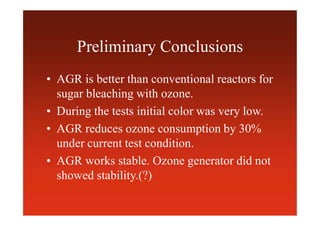
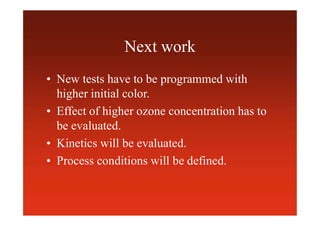

The document evaluates the feasibility of using ozone to bleach sugar in an agitated reactor (AGR), highlighting that while ozone application is effective, high consumption levels and off-flavors were observed at certain doses. Preliminary results show AGR performs better than conventional methods with a 30% reduction in ozone consumption, though further testing is necessary to optimize conditions and assess kinetics. Next steps include conducting additional tests with varying initial sugar colors and ozone concentrations.


