Monumental mapping: GIS and Hadrian’s Wall
•
1 like•794 views

A case study on the use of GIS in archaeology. Presented by Stuart at a Research Data seminar on GIS , which took place at the London School of Hygiene & Tropical Medicine on 17th March 2014
Report
Share
Report
Share
Download to read offline

Recommended
Towards a Graph of Ancient World Data & an Ecosystem of Gazetteers
Pelagios 3 is a 2-year project funded by the Andrew W. Mellon Foundation to annotate geographic documents predating 1492 by associating places mentioned in them with entries from various gazetteers. It aims to grow a graph of linked ancient world data by annotating over 39 partners from 6 countries have contributed around 830,000 annotations so far. The project develops tools to annotate documents and link gazetteer entries, and defines profiles for publishing gazetteer links and metadata online to allow cross-searching.
Digital Exposure of English Place-Names (DEEP) -Stuart Dunn
This document discusses the Digital Exposure of English Place-Names project. It notes that the project has digitized over 80 years of scholarship on English place-names, including 32 counties, 86 volumes, over 6 million place-name forms, and thousands of bibliographic references. It explains that place-names are dynamic, attested, contested, and documented entities that require crowd-sourcing to correct errors, validate data, add missing geographic information, and enrich point data with additional details. The document also announces a new scoping study to research crowd-sourcing models for enriching humanities data.
The NLS Historical Maps API - Chris Fleet
Presentation given at the Geospatial in the Cultural Heritage Domain - Past, Present & Future event in London on 7th March 2012. The event was organised as part of the JISC GECO project.
GIS Day 2015 - New Light Technologies, Inc.
GIS combines maps with databases to allow users to analyze geographic information and relationships. It represents real world features as points, lines, and polygons on maps and can overlay multiple data layers. Attributes associated with each feature allow users to perform spatial analysis and answer questions about locations and relationships between different features. GIS is used in many fields including transportation, natural resources, city planning, public health, and more to help with tasks like emergency response, business planning, and environmental analysis.
Public Meeting January 2012
The William and Mary Center for Archaeological Research and Hanbury Preservation Consulting were selected to conduct historic property surveys in Wytheville. They will conduct a reconnaissance survey of 355 properties and intensive surveys of 20 properties. The survey will collect data on the properties to support preservation, tourism, and planning efforts. The fieldwork will be conducted through September and draft reports will be completed by November. Community members are encouraged to provide input and stay involved in the project.
I ♥ Maps: Quantum GIS + Python
Quantum GIS (QGIS) is an open-source, highly customizable geospatial application that's great for data exploration, manipulation, and cartographic preparation -- in other words, it's software that allows you to make detailed, aesthetically-pleasing maps for free!
QGIS is also *extremely* script-able with Python, and integrates with a large number of database and analysis backends (GRASS, R, PostGIS, etc.). In this talk, Paige Bailey will be giving a short overview of QGIS; detailing a few mapping case studies; then showing how to leverage additional functionality by writing custom Python plugins.
OpenPlanetaryMap talk at EPSC 2017
Introduction and updates for OpenPlanetaryMap (OPM) presented at the European Planetary Science Conference (EPSC), held in Riga (Latvia) on September 2017. OPM is a new collaborative project to build the first Open Planetary Mapping and Social platform for researchers, educators, storytellers, and the general public. More at http://openplanetarymap.org
Aerial Photography in Archaeology
Lidar uses light detection and ranging to accurately map land surfaces at high resolution, enabling archaeologists to detect features that were previously difficult to identify except through intensive fieldwork. While satellite imagery can identify archaeological sites, its cost and lower resolution mean aerial photography remains the primary data source used in England. Online mapping tools provide wider access to imagery, though their most detailed views are from aerial photos rather than satellites. English Heritage continues using aerial photos as a key information source while also monitoring new remote sensing technologies.
France: ARIADNE - Success stories from partners and the research community
Inrap: a path toward open and shared data
Presentation by Kai Salas Rossenbach
Institut National des Recherches Archéologiques Préventive, France
ARIADNE Final Event, Florence, 16 December 2016
Understanding Gis
The document discusses Geographic Information Systems (GIS) and how it is used by the Kankakee County Highway Department. GIS allows users to visualize, analyze, and understand geospatial data through maps. The Highway Department uses GIS to map locations collected by GPS, locate parcel and right-of-way boundaries, track traffic accidents, and manage their sign inventory. Other uses of GIS discussed include natural resources, public safety, transportation, utilities, military, health, and various industries. The presentation provides examples of how GIS can be used for analysis and future offshore wind farm planning.
Hydrological reconnaissance for rural water projects using free online inform...
Hydrological reconnaissance for rural water projects using free online inform...SamSamWater Foundation
Presentation for the 6th Rural Water Supply Network Forum, Kampala, 2011
Abstract
Free online information can be beneficial in the preparation, design and implementation of rural water projects. Free online sources of meteorological data (rainfall, evaporation), maps (topography, geology), aerial imagery and elevation data are presented together with examples of how this information has been used in rural water projects. This online information can never fully substitute field observations and measurements, but it can provide valuable additional information and make preparation, design and implementation of rural water projects more efficient and successful.TransportCamp AU Presentation: Designing a multimodal, high-frequency network...
My presentation at the inaugural TransportCampAU in Melbourne, Nov 1 (http://www.transportcamp.org.au/events/transportcamp-melbourne-2014) about work with Beyond Zero Emissions (http://bze.org.au/) to design a high-frequency bus network, assisted by open source tools such as OpenTripPlanner.
Houston_P_Workshop_Australian Peri-Urban Observatory
This document proposes establishing an Australian Peri-urban Observatory to raise the profile of peri-urban issues, provide a permanent presence for related research and action, and serve as an interdisciplinary hub. It outlines existing international observatories as models and notes quasi-observatory functions already in Australia. The proposed Observatory would act as an independent information and analysis source on Australian peri-urban areas through research repository, commentary, and funded projects. It would involve a research network from universities and agencies and operate initially through a consortium website and small monitoring/capacity building projects.
21 3 2007 Edinburgh
Presentation given in Edinburgh about our e-science theme at Edinburgh University. More info at http://www.ahessc.ac.uk/theme
Education colleen beard_good2015
The library serves as both a provider and producer of open data. As a provider, the library supports teaching and research by helping users find appropriate open data sources and extract relevant data. As a producer, the library creates data through community engagement projects, student projects analyzing urban growth over time, and industry projects like creating a historical GIS data of a 1911 road network. The library also plays a leading role in research data management and ensuring data from government-funded research is accessible through open access portals.
Intro to GIS
The document announces a 2014 postgraduate workshop and seminar at UCT Libraries and GIS Lab to introduce geospatial data and map resources. Librarians and GIS Lab staff will present on the library's map collections, finding and referencing cartographic resources like maps and data. Speakers will cover the Government Publications, Special Collections, and Built Environment Library collections as well as referencing maps and data to avoid plagiarism and properly manage research data.
Spring 2016 - Career Fair
Vannesa Kello is seeking a job in transportation and has a Bachelor's degree in Civil Engineering with a concentration in transportation from UConn. She has relevant experience working as an undergraduate research assistant at UConn's Transportation Institute where she used GIS software and researched transportation systems and roadway safety. Additionally, she interned at an engineering firm where she assisted engineers with plans, drawings, and presentations. Her skills include CAD software, GIS, and languages.
OpenStreetMap in the public sector - case HSL
HSL is responsible for public transportation planning and coordination across the Helsinki region. It is working to improve its map production processes by making OpenStreetMap the primary data source and renewing its public transportation register's map interface. HSL collaborates with the OpenStreetMap community through events and an explicit permission to import HSL data. While OpenStreetMap provides benefits like fast updates, its quality and standards vary, posing challenges for HSL's adoption as an official map.
Earth observation for oil and gas
This is my presentation given at the ESRI PUG in London on 2nd November 2016. For more information please visit https://uk.linkedin.com/in/andrewcutts
AddressingHistory - Crowdsourcing the Past - Stuart Macdonald
Presentation given at the Geospatial in the Cultural Heritage Domain - Past, Present & Future event in London on 7th March 2012. The event was organised as part of the JISC GECO project.
Corridor Selection in USA and UAE with GIS
In preparation of the Dubai Rail Master Plan, GIS provided comprehensive mapping and was used for analysis. The GIS developed became integral to the planners, designers and developers assessing future demands of the Dubai Metro. Additionally, methods were developed to create and evaluate scenario based land use plans and socioeconomic projections to accommodate new growth in a more compact and less auto-dependent manner.
Authors note: This presentation was presented at the URISA GIS-Pro 2010 Conference. Figures are shown for illustration purposes only and subject to change without notice. Author does not guarantee the accuracy of the data and information shown and hereby expressly disclaims any responsibility for the truth, lack of truth, validity, invalidity, accuracy, inaccuracy of any said data and information.
Christopher j. busic_engineering_resume_2020-2021
Christopher Busic is an aerospace engineering student at the University of Tennessee with a 3.97 GPA. He has internship experience developing machine learning models for trajectory prediction and guidance at Dynetics. As an undergraduate research assistant, he analyzed asteroid simulant properties. On campus, he held leadership roles in AIAA coordinating events with aerospace companies like Dynetics and NASA. His technical skills include programming languages like C++ and Python along with CAD software.
Semantically Mapping Science (SMS) Platform
This document describes the Semantically Mapping Science (SMS) Platform, which aims to integrate heterogeneous data from the social sciences domain. The SMS Platform addresses challenges like linking heterogeneous data at scale, enriching data, and enabling usable browsing and querying of data. It utilizes semantic technologies like linked data and ontologies. The core modules of the platform are for data curation, browsing/querying, data enrichment, and data linking. Applications of the platform include a faceted browser, data enrichment services, and tools for data linking. An example use case demonstrates how the platform can integrate different datasets to analyze factors predicting university performance.
Europeana Network Association Members Council Meeting, Copenhagen by Aubery E...
The document outlines Europeana's Management Committee (MC) activity plan for 2017. It includes dates for MC meetings in February, June, September, October, and December. It also lists task forces and working groups that will operate throughout the year. The document then focuses on the membership campaign, providing details on its purpose and July update. It concludes by providing information on the Annual General Meeting in December 2017, to be held in Milan, where the Business Plan for 2018 will be introduced and elections will take place.
OSM HOT SBTF 2013_03_16
OpenStreetMap is a collaborative project to create a free editable map of the world. It began in 2004 and now has over 1 million users contributing data. The Humanitarian OpenStreetMap Team contributes mapping data for humanitarian and development contexts. OpenStreetMap data can be used for routing, downloaded for use in other projects, and edited in apps or through the website. Analysis has shown the positional accuracy of OpenStreetMap data is around 6 meters where there is significant contributor activity and quality assurance.
Italy: ARIADNE - Success stories from partners and the research community
Fasti Online has been expanded to include information on survey and conservation efforts from 3700 excavation sites in 14 countries since 2000. Over 1200 additional sites were added during the four years of the ARIADNE project. A new initiative called NAHAN aims to create a common platform for over 20 archives in Europe and North Africa, using the ARIADNE model. Fasti Online has grown due to increased awareness of the need to share archaeological information and has driven other new initiatives. It was also awarded the Archaeological Institute of America's first annual award for digital archaeology.
Application of gis and remote sensing in modern transport system
This document discusses various technologies used in intelligent transportation systems, including remote sensing, geographic information systems, and applications like advanced public transport systems, advanced traffic management systems, and advanced traveler information systems. It provides examples of intelligent transportation system implementations in India, describing components like traffic management, electronic toll collection, traveler information, and route guidance. It also outlines the benefits of intelligent transportation systems in improving traffic flow, easing congestion and driver frustration, and monitoring environmental and road conditions.
RobertFohrenbach Resume
Robert Fohrenbach received a Bachelor of Science in Civil Engineering from Rensselaer Polytechnic Institute in 2015. As an undergraduate researcher, he assessed freight delivery patterns through statistical analysis and surveyed data. His coursework included projects in transportation planning, traffic engineering, and a paper on variable toll pricing. He held leadership roles as Inter-Fraternity Council Treasurer and Steward Chairman for his fraternity.
Archaeological Applications Of Gis
GIS offers archaeologists an exciting tool to analyze and interpret spatial and temporal archaeological data. Main applications include cultural resource management, landscape analysis, and site catchment analysis. GIS allows visualization of 3D relationships, time series analysis, and predictive modeling. It provides advantages like integrating diverse data types, interpreting landscapes at various scales, and analyzing issues like site distributions. However, GIS also has limitations like being dependent on original data quality and having a bias towards spatial over other types of analysis. Future uses may include more 3D modeling and accounting for seasonal landscape changes.
Wikimaps Wikimania 2013
This document discusses plans for developing the Wikimaps project, which aims to make historical maps available on Wikimedia platforms. It describes efforts to digitize and georeference maps from archives, add location data to maps on Wikimedia Commons, extract features from old maps to add to Wikidata and OpenStreetMap, and develop tools to find maps and visualize historical data. The document also outlines upcoming workshops and sprints in Estonia, Hong Kong, and the US to advance this technical and collaboration work around historical maps between Wikimedia and cultural heritage organizations.
More Related Content
What's hot
France: ARIADNE - Success stories from partners and the research community
Inrap: a path toward open and shared data
Presentation by Kai Salas Rossenbach
Institut National des Recherches Archéologiques Préventive, France
ARIADNE Final Event, Florence, 16 December 2016
Understanding Gis
The document discusses Geographic Information Systems (GIS) and how it is used by the Kankakee County Highway Department. GIS allows users to visualize, analyze, and understand geospatial data through maps. The Highway Department uses GIS to map locations collected by GPS, locate parcel and right-of-way boundaries, track traffic accidents, and manage their sign inventory. Other uses of GIS discussed include natural resources, public safety, transportation, utilities, military, health, and various industries. The presentation provides examples of how GIS can be used for analysis and future offshore wind farm planning.
Hydrological reconnaissance for rural water projects using free online inform...
Hydrological reconnaissance for rural water projects using free online inform...SamSamWater Foundation
Presentation for the 6th Rural Water Supply Network Forum, Kampala, 2011
Abstract
Free online information can be beneficial in the preparation, design and implementation of rural water projects. Free online sources of meteorological data (rainfall, evaporation), maps (topography, geology), aerial imagery and elevation data are presented together with examples of how this information has been used in rural water projects. This online information can never fully substitute field observations and measurements, but it can provide valuable additional information and make preparation, design and implementation of rural water projects more efficient and successful.TransportCamp AU Presentation: Designing a multimodal, high-frequency network...
My presentation at the inaugural TransportCampAU in Melbourne, Nov 1 (http://www.transportcamp.org.au/events/transportcamp-melbourne-2014) about work with Beyond Zero Emissions (http://bze.org.au/) to design a high-frequency bus network, assisted by open source tools such as OpenTripPlanner.
Houston_P_Workshop_Australian Peri-Urban Observatory
This document proposes establishing an Australian Peri-urban Observatory to raise the profile of peri-urban issues, provide a permanent presence for related research and action, and serve as an interdisciplinary hub. It outlines existing international observatories as models and notes quasi-observatory functions already in Australia. The proposed Observatory would act as an independent information and analysis source on Australian peri-urban areas through research repository, commentary, and funded projects. It would involve a research network from universities and agencies and operate initially through a consortium website and small monitoring/capacity building projects.
21 3 2007 Edinburgh
Presentation given in Edinburgh about our e-science theme at Edinburgh University. More info at http://www.ahessc.ac.uk/theme
Education colleen beard_good2015
The library serves as both a provider and producer of open data. As a provider, the library supports teaching and research by helping users find appropriate open data sources and extract relevant data. As a producer, the library creates data through community engagement projects, student projects analyzing urban growth over time, and industry projects like creating a historical GIS data of a 1911 road network. The library also plays a leading role in research data management and ensuring data from government-funded research is accessible through open access portals.
Intro to GIS
The document announces a 2014 postgraduate workshop and seminar at UCT Libraries and GIS Lab to introduce geospatial data and map resources. Librarians and GIS Lab staff will present on the library's map collections, finding and referencing cartographic resources like maps and data. Speakers will cover the Government Publications, Special Collections, and Built Environment Library collections as well as referencing maps and data to avoid plagiarism and properly manage research data.
Spring 2016 - Career Fair
Vannesa Kello is seeking a job in transportation and has a Bachelor's degree in Civil Engineering with a concentration in transportation from UConn. She has relevant experience working as an undergraduate research assistant at UConn's Transportation Institute where she used GIS software and researched transportation systems and roadway safety. Additionally, she interned at an engineering firm where she assisted engineers with plans, drawings, and presentations. Her skills include CAD software, GIS, and languages.
OpenStreetMap in the public sector - case HSL
HSL is responsible for public transportation planning and coordination across the Helsinki region. It is working to improve its map production processes by making OpenStreetMap the primary data source and renewing its public transportation register's map interface. HSL collaborates with the OpenStreetMap community through events and an explicit permission to import HSL data. While OpenStreetMap provides benefits like fast updates, its quality and standards vary, posing challenges for HSL's adoption as an official map.
Earth observation for oil and gas
This is my presentation given at the ESRI PUG in London on 2nd November 2016. For more information please visit https://uk.linkedin.com/in/andrewcutts
AddressingHistory - Crowdsourcing the Past - Stuart Macdonald
Presentation given at the Geospatial in the Cultural Heritage Domain - Past, Present & Future event in London on 7th March 2012. The event was organised as part of the JISC GECO project.
Corridor Selection in USA and UAE with GIS
In preparation of the Dubai Rail Master Plan, GIS provided comprehensive mapping and was used for analysis. The GIS developed became integral to the planners, designers and developers assessing future demands of the Dubai Metro. Additionally, methods were developed to create and evaluate scenario based land use plans and socioeconomic projections to accommodate new growth in a more compact and less auto-dependent manner.
Authors note: This presentation was presented at the URISA GIS-Pro 2010 Conference. Figures are shown for illustration purposes only and subject to change without notice. Author does not guarantee the accuracy of the data and information shown and hereby expressly disclaims any responsibility for the truth, lack of truth, validity, invalidity, accuracy, inaccuracy of any said data and information.
Christopher j. busic_engineering_resume_2020-2021
Christopher Busic is an aerospace engineering student at the University of Tennessee with a 3.97 GPA. He has internship experience developing machine learning models for trajectory prediction and guidance at Dynetics. As an undergraduate research assistant, he analyzed asteroid simulant properties. On campus, he held leadership roles in AIAA coordinating events with aerospace companies like Dynetics and NASA. His technical skills include programming languages like C++ and Python along with CAD software.
Semantically Mapping Science (SMS) Platform
This document describes the Semantically Mapping Science (SMS) Platform, which aims to integrate heterogeneous data from the social sciences domain. The SMS Platform addresses challenges like linking heterogeneous data at scale, enriching data, and enabling usable browsing and querying of data. It utilizes semantic technologies like linked data and ontologies. The core modules of the platform are for data curation, browsing/querying, data enrichment, and data linking. Applications of the platform include a faceted browser, data enrichment services, and tools for data linking. An example use case demonstrates how the platform can integrate different datasets to analyze factors predicting university performance.
Europeana Network Association Members Council Meeting, Copenhagen by Aubery E...
The document outlines Europeana's Management Committee (MC) activity plan for 2017. It includes dates for MC meetings in February, June, September, October, and December. It also lists task forces and working groups that will operate throughout the year. The document then focuses on the membership campaign, providing details on its purpose and July update. It concludes by providing information on the Annual General Meeting in December 2017, to be held in Milan, where the Business Plan for 2018 will be introduced and elections will take place.
OSM HOT SBTF 2013_03_16
OpenStreetMap is a collaborative project to create a free editable map of the world. It began in 2004 and now has over 1 million users contributing data. The Humanitarian OpenStreetMap Team contributes mapping data for humanitarian and development contexts. OpenStreetMap data can be used for routing, downloaded for use in other projects, and edited in apps or through the website. Analysis has shown the positional accuracy of OpenStreetMap data is around 6 meters where there is significant contributor activity and quality assurance.
Italy: ARIADNE - Success stories from partners and the research community
Fasti Online has been expanded to include information on survey and conservation efforts from 3700 excavation sites in 14 countries since 2000. Over 1200 additional sites were added during the four years of the ARIADNE project. A new initiative called NAHAN aims to create a common platform for over 20 archives in Europe and North Africa, using the ARIADNE model. Fasti Online has grown due to increased awareness of the need to share archaeological information and has driven other new initiatives. It was also awarded the Archaeological Institute of America's first annual award for digital archaeology.
Application of gis and remote sensing in modern transport system
This document discusses various technologies used in intelligent transportation systems, including remote sensing, geographic information systems, and applications like advanced public transport systems, advanced traffic management systems, and advanced traveler information systems. It provides examples of intelligent transportation system implementations in India, describing components like traffic management, electronic toll collection, traveler information, and route guidance. It also outlines the benefits of intelligent transportation systems in improving traffic flow, easing congestion and driver frustration, and monitoring environmental and road conditions.
RobertFohrenbach Resume
Robert Fohrenbach received a Bachelor of Science in Civil Engineering from Rensselaer Polytechnic Institute in 2015. As an undergraduate researcher, he assessed freight delivery patterns through statistical analysis and surveyed data. His coursework included projects in transportation planning, traffic engineering, and a paper on variable toll pricing. He held leadership roles as Inter-Fraternity Council Treasurer and Steward Chairman for his fraternity.
What's hot (20)
France: ARIADNE - Success stories from partners and the research community
France: ARIADNE - Success stories from partners and the research community
Hydrological reconnaissance for rural water projects using free online inform...
Hydrological reconnaissance for rural water projects using free online inform...
TransportCamp AU Presentation: Designing a multimodal, high-frequency network...
TransportCamp AU Presentation: Designing a multimodal, high-frequency network...
Houston_P_Workshop_Australian Peri-Urban Observatory
Houston_P_Workshop_Australian Peri-Urban Observatory
AddressingHistory - Crowdsourcing the Past - Stuart Macdonald
AddressingHistory - Crowdsourcing the Past - Stuart Macdonald
Europeana Network Association Members Council Meeting, Copenhagen by Aubery E...
Europeana Network Association Members Council Meeting, Copenhagen by Aubery E...
Italy: ARIADNE - Success stories from partners and the research community
Italy: ARIADNE - Success stories from partners and the research community
Application of gis and remote sensing in modern transport system
Application of gis and remote sensing in modern transport system
Similar to Monumental mapping: GIS and Hadrian’s Wall
Archaeological Applications Of Gis
GIS offers archaeologists an exciting tool to analyze and interpret spatial and temporal archaeological data. Main applications include cultural resource management, landscape analysis, and site catchment analysis. GIS allows visualization of 3D relationships, time series analysis, and predictive modeling. It provides advantages like integrating diverse data types, interpreting landscapes at various scales, and analyzing issues like site distributions. However, GIS also has limitations like being dependent on original data quality and having a bias towards spatial over other types of analysis. Future uses may include more 3D modeling and accounting for seasonal landscape changes.
Wikimaps Wikimania 2013
This document discusses plans for developing the Wikimaps project, which aims to make historical maps available on Wikimedia platforms. It describes efforts to digitize and georeference maps from archives, add location data to maps on Wikimedia Commons, extract features from old maps to add to Wikidata and OpenStreetMap, and develop tools to find maps and visualize historical data. The document also outlines upcoming workshops and sprints in Estonia, Hong Kong, and the US to advance this technical and collaboration work around historical maps between Wikimedia and cultural heritage organizations.
CensusGIV - Geographic Information Visualisation of Census Data
The document discusses the development of CensusGIV, a prototype for providing innovative geographic visualization of UK census small area statistics. It aims to develop an interactive web-based mapping application using open source technologies to allow users to easily explore and analyze census data through dynamic choropleth maps and other visualization techniques. The document outlines the objectives, design considerations, system architecture, and timeline for the CensusGIV prototype. Key aspects discussed include data access, map creation, color theory, and a modular client-server architecture.
2013 gis, gil and libraries… mapping in the digital age
Presented at a ICTLIG, LIASA event on 8 July 2013. This talk introduces the concept of the Geographic Information Systems (GIS) Librarian within the context of Geographic Information Librarianship to an audience comprised of South African Librarians.
PIAS 2013-GIS.pptxfskjczjsbchdbfscnnND dHSA
This document defines geographic information systems (GIS) and describes their key components and uses. GIS is defined as a technology that uses hardware, software and information management strategies to capture, store, analyze and display spatially-referenced data to improve decision-making. It involves a spatially-referenced computer database and applications software. GIS is unique in that it handles spatial data referenced by location, and connects activities based on spatial proximity. Common GIS applications include facilities management, environmental analysis, transportation routing, health analysis, and more.
Qualitative GIS by Rob Berry @rural_gis
This document summarizes a presentation on qualitative GIS (QGIS) given by Robert Berry. It begins by providing context on traditional GIS as a quantitative tool and then outlines the emergence of QGIS, which uses mixed methods to incorporate qualitative data. Several case studies are described that demonstrate approaches to mapping interviews and literary texts. The document concludes that early QGIS research is showing potential for exploring qualitative data spatially but cautions that a truly qualitative GIS may not be possible and more theoretical development is still needed.
Maps: a "Must Have" for Genealogists
This document discusses the importance of maps for genealogists and provides information about various types of maps and resources for finding maps. It begins by describing the key elements of maps, such as scale and projection. It then discusses different types of maps including political, thematic, cadastral, and topographic maps. The rest of the document provides details on resources for finding maps, including libraries, archives, websites, and recommendations for using both print and electronic maps for genealogical research.
Public Access through technology; Using archaeological computing to interact ...
A presentation given at Strode College for students from the University of Plymouth, Truro College and Strode College , aimed at given them an overview on how technology is used to engage with the public using examples from Wessex Archaeology and other sources
ArchaeoSTOR Map: Publishing archaeological geodata on the web
http://dx.doi.org/10.1145/2345316.2345355
Modern field science, including archaeology, utilizes a mas- sive amount of digital data captured by state-of-the-art mea- surement instruments. Large archaeological data sets may include images, geospatial data, analytical data, and meta- data. Geospatial information plays a central role in the life cycle of those data; information is collected, organized, and published for analyses and visualization as final output us- ing geospatial data as an index. The web is an ideal place to publish scientific data and promote diverse collaboration, and thus we need a system to publish digital archaeologi- cal data efficiently so that it is also integrated in our data management workflow. In order to realize this goal, we designed and implemented a web-based application named ArcheoSTOR Map, which visualizes and publishes raw ar- chaeological data onto a map.
GIS data analysis
This document discusses GIS data analysis techniques including raster to vector conversion and spatial analysis through vector overlay. It provides information on various data types and models in GIS. Key analysis techniques covered are raster and vector data overlays, terrain mapping and analysis, and spatial interpolation methods. Specific vector and raster overlay methods like point-in-polygon, line-in-polygon and polygon-on-polygon are described. Spatial data editing techniques involving digitization errors and topological/non-topological editing are also summarized.
Real-time Visualisation of Cultural Heritage and Environmental Archaeology Da...
This document discusses a hack day event called "ArkHack" where participants worked to link archaeological, cultural heritage, and environmental data. It describes efforts to map environmental data from the SEAD database to linked open data formats. The document then discusses potential uses of linked data from multiple sources to reconstruct past landscapes and environments over time through techniques like paleoenvironmental modeling. Challenges and prerequisites for more fully realizing this vision are also outlined.
Kansa SAA 2014 Archaeological Data on Vastly Different Scales
Eric Kansa took the lead on presenting “Navigating and Visualizing Archaeological Data on Vastly Different Scales” for coauthors Yerka, Kansa, Anderson, DeMuth and Wells. Archaeological research can focus closely on individual objects, or cover a broad span of time over multiple millennia and continents. Data indexing managed by Open Context for DINAA facilitates these types of multiscalar research, hierarchically nesting both temporal and geographic data with a simplified interface and spectacular visualization.
00 charlton map_projections
The document discusses maps and map projections. It provides information on different types of map projections like cylindrical, conic, and planar projections. It explains key concepts like latitude, longitude, datums, and how different projections distort shapes and distances in different ways in order to portray the spherical Earth on a flat surface. No single projection can preserve all geometric properties.
GeoSemantic Technologies for Archaeological Resources
The semantics of heritage data is a growing area of interest with ontologies such as the CIDOC-CRM providing semantic frameworks and exemplary projects such as STAR and STELLAR demonstrating what can be done using semantic technologies applied to archaeological resources. In the world of the Semantic Web, advances regarding geosemantics have emerged to extend research more fully into the spatio-temporal domain, for example extending the SPARQL standard to produce GeoSPARQL. Importantly, the use of semantic technologies, particularly the structure of RDF, aligns with graph and network based approaches, providing a rich fusion of techniques for geospatial analysis of heritage data expressed in such a manner.
This paper gives an overview of the ongoing G-STAR research project (GeoSemantic Technologies for Archaeological Resources) with reference to broader sectoral links particularly to commercial archaeology. Particular attention is paid to examining the integration of spatial data into the heritage Global Graph and the relationship between Spatial Data Infrastructure (SDI) and Linked Data, moving beyond notions of ‘location’ as simple nodes, placenames and coordinates towards fuller support for complex geometries and advanced spatial reasoning. Finally, the potential impacts of such research is discussed with particular reference to the current practice of commercial archaeology, access to and publishing of (legacy, big) data, and leveraging network models to better understand and manage change within archaeological information systems.
Linking Spaces with Places:
Examples from the
PastPlace Project
This presentation was given to the seminar on “Integration of onomastic data into geo-spatial infrastructure” in Tallinn, Estonia, on September 19th 2013. This meeting was organized by the Baltic and Northern Divisions of the United Nations Group of Experts on Geographical Names (UNGEGN), and the UNGEGN Working Group on Toponymic Data Files and Gazetteers.
GIS Services at Michigan State University Libraries: Interactions with the Wi...
GIS Services at Michigan State University Libraries: Interactions with the Wi...National Information Standards Organization (NISO)
This presentation was provided by Amanda Tickner of Michigan State University during the NISO virtual conference, The Computer Campus: Integrating Information Systems and Services, held on August 15, 2018.Similar to Monumental mapping: GIS and Hadrian’s Wall (16)
CensusGIV - Geographic Information Visualisation of Census Data
CensusGIV - Geographic Information Visualisation of Census Data
2013 gis, gil and libraries… mapping in the digital age
2013 gis, gil and libraries… mapping in the digital age
Public Access through technology; Using archaeological computing to interact ...
Public Access through technology; Using archaeological computing to interact ...
ArchaeoSTOR Map: Publishing archaeological geodata on the web
ArchaeoSTOR Map: Publishing archaeological geodata on the web
Real-time Visualisation of Cultural Heritage and Environmental Archaeology Da...
Real-time Visualisation of Cultural Heritage and Environmental Archaeology Da...
Kansa SAA 2014 Archaeological Data on Vastly Different Scales
Kansa SAA 2014 Archaeological Data on Vastly Different Scales
GeoSemantic Technologies for Archaeological Resources
GeoSemantic Technologies for Archaeological Resources
Linking Spaces with Places:
Examples from the
PastPlace Project
Linking Spaces with Places:
Examples from the
PastPlace Project
GIS Services at Michigan State University Libraries: Interactions with the Wi...
GIS Services at Michigan State University Libraries: Interactions with the Wi...
More from London School of Hygiene and Tropical Medicine
Preparing to submit your thesis at LSHTM
This is a presentation given to final year doctoral students at the London School of Hygiene & Tropical Medicine. It covers issues pertaining to copyright and open access publishing that students need to consider before submitting their thesis, as well as information on research data management and the actual process of submission.
Your research is more than a thesis: Make the most of research data and other...
Your research is more than a thesis: Make the most of research data and other...London School of Hygiene and Tropical Medicine
Presentation by Gareth Knight at "Preparing to submit your thesis" lunchtime session at the London School of Hygiene & Tropical MedicineEnhance your research impact through open science
Presentation slides on Open Science and research reproducibility. Presented by Gareth Knight (LSHTM Research Data Manager) on 18th September 2018, as part of an Open Science event for LSHTM Week 2018.
Information Security and GDPR
Laurence Horton of the London School of Economics gave a talk on the information security implications of the General Data Protection Regulation (GDPR). Presented at the London Area Research Data meeting on 17th November 2017, held at the London School of Hygiene & Tropical Medicine.
GDPR and Research Data Management
An introduction to the General Data Protection Regulation (GDPR) and its implications for research data management. Presentation given by Tim Rodgers of Imperial College London at the London Area Research Data meeting, held at the London School of Hygiene & Tropical Medicine on 17th Nov 2017.
Towards Open Research: practices, experiences, barriers and opportunities
Towards Open Research: practices, experiences, barriers and opportunitiesLondon School of Hygiene and Tropical Medicine
Report on key findings of a Wellcome-commissioned study to investigate current practices for paper, data & code sharing among Wellcome & ESRC funded researchers and any barriers that are encountered. Presented by Gareth Knight at a CPD25 Open Access workshop at the Foundling museum in London on 26 April 2017.Data Journals and repositories: Getting academic credit for data sharing
Data Journals and repositories: Getting academic credit for data sharingLondon School of Hygiene and Tropical Medicine
Presentation slides from a talk by Gareth Knight which discussed the need to consider data sharing activities in academic citizenship, different approaches that may be taken to publish data associated with publications, and the opportunities presented by data journals Crowd sourcing and high resolution satellite imagery in public health
Crowd sourcing and high resolution satellite imagery in public healthLondon School of Hygiene and Tropical Medicine
Presentation by Chris Grundy of LSHTM which describes his use of satellite images for population estimation and surveys, as well as mapping work performed by the online mapping community and NGOs to improve crowd sourced mapping data.Determining the relationship between physical environment and weight status u...
Determining the relationship between physical environment and weight status u...London School of Hygiene and Tropical Medicine
Ketevan is a Research Fellow in the Department of Health Services Research and Policy at LSHTM. She currently works on SPOTLIGHT, a cross-European research project for sustainable prevention of obesity through integrated strategies, where she is managing a large-scale survey conducted in England to assess the perceptions of environmental obesogenicity in selected neighbourhoods. She also assessed the built environment in those neighbourhoods using remote imaging using Google Street View.i-Sense: an early-warning sensing systems for infectious diseases
i-Sense: an early-warning sensing systems for infectious diseasesLondon School of Hygiene and Tropical Medicine
An overview of the i-Sense platform, developed by UCL to monitor the spread of infectious disease. Presented by Jens Geyti of University College London at LSHTM's 'Enhancing data capture in health research' RDM event on November 20th, 2015.Internet-based surveillance of illness: the FluSurvey platform
Internet-based surveillance of illness: the FluSurvey platformLondon School of Hygiene and Tropical Medicine
Case study on the FluSurvey platform, developed by the London School of Hygiene & Tropical Medicine. Presented by Dr Sebastian Funk at LSHTM's 'Enhancing data capture in health research' RDM event on November 20th, 2015.An overview of the MyHeart Counts app
Case study on the development of the MyHeart Counts app built using Apple’s ResearchKit platform and future plans for Android development. Presented by Dr Dario Salvi of University of Oxford at LSHTM's 'Enhancing data capture in health research' RDM event on November 20th, 2015.
Electronic data collection for a modular household survey in Ethiopia
Electronic data collection for a modular household survey in EthiopiaLondon School of Hygiene and Tropical Medicine
Case study on the use of electronic data collection in a modular household survey as part of the IDEAS project. Presented by Keith Tomlin at LSHTM's 'Enhancing data capture in health research' RDM event on November 20th, 2015.Mobile-Based Experience Sampling for Behaviour Research
Mobile-Based Experience Sampling for Behaviour ResearchLondon School of Hygiene and Tropical Medicine
Case study on mobile-based experience sampling using the Q-Sense and EmotionSense platform. Presented by Dr. Neal Lathia of Cambridge University at LSHTM's 'Enhancing data capture in health research' RDM event on November 20th, 2015.Preparing Data for Sharing: The FAIR Principles
An introduction to the FAIR principles and a discussion of key issues that must be addressed to ensure data is findable, accessible, interoperable and re-usable. The session explored the role of the CDISC and DDI standards for addressing these issues.
Presented by Gareth Knight at the ADMIT Network conference, organised by the Association for Data Management in the Tropics, in Antwerp, Belgium on December 1st 2015.
RDM Training for
health researchers: An institutional perspective
RDM Training for
health researchers: An institutional perspectiveLondon School of Hygiene and Tropical Medicine
Presentation given by Gareth Knight at the Knowledge Exchange workshop on Feb 9th, 2016 at the America Square Conference Centre, LondonResearch Data Readiness in UK Institutions: Digital Curation Centre’s 2015 Su...
Research Data Readiness in UK Institutions: Digital Curation Centre’s 2015 Su...London School of Hygiene and Tropical Medicine
Presentation by Angus Whyte of the Digital Curation Centre. It was presented at the LSHTM Research Data Services workshop on June 30th 2015, an event organised to mark the end of LSHTM's Wellcome Trust funded RDM project. Updated version added on 14th August to clarify graph labels.Research data services at the University of Oxford
Presentation by Sally Rumsey of the University of Oxford. It was presented at the LSHTM Research Data Services workshop on June 30th 2015, an event organised to mark the end of LSHTM's Wellcome Trust funded RDM project.
Research Data Management at The University of Edinburgh
Research Data Management at The University of EdinburghLondon School of Hygiene and Tropical Medicine
The University of Edinburgh has over 33,000 students and 9,000 staff across three colleges covering a broad range of research disciplines. 83% of the University's research is rated as world-leading or internationally excellent. The University has prioritized data science and launched Edinburgh Data Science in 2014. It provides core research data management infrastructure to support good research practices. This includes training, policies, online data management planning tools, storage infrastructure, and repositories for active data use and long-term archiving. Challenges include promoting cultural change and integrating multiple research data services as needs evolve rapidly.Research data management at UAL
Presentation by Jeremy Barraud & Jess Crilly of University of the Arts London. It was presented at the LSHTM Research Data Services workshop on June 30th 2015, an event organised to mark the end of LSHTM's Wellcome Trust funded RDM project.
More from London School of Hygiene and Tropical Medicine (20)
Your research is more than a thesis: Make the most of research data and other...
Your research is more than a thesis: Make the most of research data and other...
Enhance your research impact through open science
Enhance your research impact through open science
Towards Open Research: practices, experiences, barriers and opportunities
Towards Open Research: practices, experiences, barriers and opportunities
Data Journals and repositories: Getting academic credit for data sharing
Data Journals and repositories: Getting academic credit for data sharing
Crowd sourcing and high resolution satellite imagery in public health
Crowd sourcing and high resolution satellite imagery in public health
Determining the relationship between physical environment and weight status u...
Determining the relationship between physical environment and weight status u...
i-Sense: an early-warning sensing systems for infectious diseases
i-Sense: an early-warning sensing systems for infectious diseases
Internet-based surveillance of illness: the FluSurvey platform
Internet-based surveillance of illness: the FluSurvey platform
Electronic data collection for a modular household survey in Ethiopia
Electronic data collection for a modular household survey in Ethiopia
Mobile-Based Experience Sampling for Behaviour Research
Mobile-Based Experience Sampling for Behaviour Research
RDM Training for
health researchers: An institutional perspective
RDM Training for
health researchers: An institutional perspective
Research Data Readiness in UK Institutions: Digital Curation Centre’s 2015 Su...
Research Data Readiness in UK Institutions: Digital Curation Centre’s 2015 Su...
Research data services at the University of Oxford
Research data services at the University of Oxford
Research Data Management at The University of Edinburgh
Research Data Management at The University of Edinburgh
Recently uploaded
Freshworks Rethinks NoSQL for Rapid Scaling & Cost-Efficiency
Freshworks creates AI-boosted business software that helps employees work more efficiently and effectively. Managing data across multiple RDBMS and NoSQL databases was already a challenge at their current scale. To prepare for 10X growth, they knew it was time to rethink their database strategy. Learn how they architected a solution that would simplify scaling while keeping costs under control.
Mutation Testing for Task-Oriented Chatbots
Conversational agents, or chatbots, are increasingly used to access all sorts of services using natural language. While open-domain chatbots - like ChatGPT - can converse on any topic, task-oriented chatbots - the focus of this paper - are designed for specific tasks, like booking a flight, obtaining customer support, or setting an appointment. Like any other software, task-oriented chatbots need to be properly tested, usually by defining and executing test scenarios (i.e., sequences of user-chatbot interactions). However, there is currently a lack of methods to quantify the completeness and strength of such test scenarios, which can lead to low-quality tests, and hence to buggy chatbots.
To fill this gap, we propose adapting mutation testing (MuT) for task-oriented chatbots. To this end, we introduce a set of mutation operators that emulate faults in chatbot designs, an architecture that enables MuT on chatbots built using heterogeneous technologies, and a practical realisation as an Eclipse plugin. Moreover, we evaluate the applicability, effectiveness and efficiency of our approach on open-source chatbots, with promising results.
"Choosing proper type of scaling", Olena Syrota
Imagine an IoT processing system that is already quite mature and production-ready and for which client coverage is growing and scaling and performance aspects are life and death questions. The system has Redis, MongoDB, and stream processing based on ksqldb. In this talk, firstly, we will analyze scaling approaches and then select the proper ones for our system.
How to Interpret Trends in the Kalyan Rajdhani Mix Chart.pdf
A Mix Chart displays historical data of numbers in a graphical or tabular form. The Kalyan Rajdhani Mix Chart specifically shows the results of a sequence of numbers over different periods.
Session 1 - Intro to Robotic Process Automation.pdf
👉 Check out our full 'Africa Series - Automation Student Developers (EN)' page to register for the full program:
https://bit.ly/Automation_Student_Kickstart
In this session, we shall introduce you to the world of automation, the UiPath Platform, and guide you on how to install and setup UiPath Studio on your Windows PC.
📕 Detailed agenda:
What is RPA? Benefits of RPA?
RPA Applications
The UiPath End-to-End Automation Platform
UiPath Studio CE Installation and Setup
💻 Extra training through UiPath Academy:
Introduction to Automation
UiPath Business Automation Platform
Explore automation development with UiPath Studio
👉 Register here for our upcoming Session 2 on June 20: Introduction to UiPath Studio Fundamentals: https://community.uipath.com/events/details/uipath-lagos-presents-session-2-introduction-to-uipath-studio-fundamentals/
Connector Corner: Seamlessly power UiPath Apps, GenAI with prebuilt connectors
Join us to learn how UiPath Apps can directly and easily interact with prebuilt connectors via Integration Service--including Salesforce, ServiceNow, Open GenAI, and more.
The best part is you can achieve this without building a custom workflow! Say goodbye to the hassle of using separate automations to call APIs. By seamlessly integrating within App Studio, you can now easily streamline your workflow, while gaining direct access to our Connector Catalog of popular applications.
We’ll discuss and demo the benefits of UiPath Apps and connectors including:
Creating a compelling user experience for any software, without the limitations of APIs.
Accelerating the app creation process, saving time and effort
Enjoying high-performance CRUD (create, read, update, delete) operations, for
seamless data management.
Speakers:
Russell Alfeche, Technology Leader, RPA at qBotic and UiPath MVP
Charlie Greenberg, host
Apps Break Data
How information systems are built or acquired puts information, which is what they should be about, in a secondary place. Our language adapted accordingly, and we no longer talk about information systems but applications. Applications evolved in a way to break data into diverse fragments, tightly coupled with applications and expensive to integrate. The result is technical debt, which is re-paid by taking even bigger "loans", resulting in an ever-increasing technical debt. Software engineering and procurement practices work in sync with market forces to maintain this trend. This talk demonstrates how natural this situation is. The question is: can something be done to reverse the trend?
Must Know Postgres Extension for DBA and Developer during Migration
Mydbops Opensource Database Meetup 16
Topic: Must-Know PostgreSQL Extensions for Developers and DBAs During Migration
Speaker: Deepak Mahto, Founder of DataCloudGaze Consulting
Date & Time: 8th June | 10 AM - 1 PM IST
Venue: Bangalore International Centre, Bangalore
Abstract: Discover how PostgreSQL extensions can be your secret weapon! This talk explores how key extensions enhance database capabilities and streamline the migration process for users moving from other relational databases like Oracle.
Key Takeaways:
* Learn about crucial extensions like oracle_fdw, pgtt, and pg_audit that ease migration complexities.
* Gain valuable strategies for implementing these extensions in PostgreSQL to achieve license freedom.
* Discover how these key extensions can empower both developers and DBAs during the migration process.
* Don't miss this chance to gain practical knowledge from an industry expert and stay updated on the latest open-source database trends.
Mydbops Managed Services specializes in taking the pain out of database management while optimizing performance. Since 2015, we have been providing top-notch support and assistance for the top three open-source databases: MySQL, MongoDB, and PostgreSQL.
Our team offers a wide range of services, including assistance, support, consulting, 24/7 operations, and expertise in all relevant technologies. We help organizations improve their database's performance, scalability, efficiency, and availability.
Contact us: info@mydbops.com
Visit: https://www.mydbops.com/
Follow us on LinkedIn: https://in.linkedin.com/company/mydbops
For more details and updates, please follow up the below links.
Meetup Page : https://www.meetup.com/mydbops-databa...
Twitter: https://twitter.com/mydbopsofficial
Blogs: https://www.mydbops.com/blog/
Facebook(Meta): https://www.facebook.com/mydbops/
Northern Engraving | Modern Metal Trim, Nameplates and Appliance Panels
What began over 115 years ago as a supplier of precision gauges to the automotive industry has evolved into being an industry leader in the manufacture of product branding, automotive cockpit trim and decorative appliance trim. Value-added services include in-house Design, Engineering, Program Management, Test Lab and Tool Shops.
Columbus Data & Analytics Wednesdays - June 2024
Columbus Data & Analytics Wednesdays, June 2024 with Maria Copot 20
inQuba Webinar Mastering Customer Journey Management with Dr Graham Hill
HERE IS YOUR WEBINAR CONTENT! 'Mastering Customer Journey Management with Dr. Graham Hill'. We hope you find the webinar recording both insightful and enjoyable.
In this webinar, we explored essential aspects of Customer Journey Management and personalization. Here’s a summary of the key insights and topics discussed:
Key Takeaways:
Understanding the Customer Journey: Dr. Hill emphasized the importance of mapping and understanding the complete customer journey to identify touchpoints and opportunities for improvement.
Personalization Strategies: We discussed how to leverage data and insights to create personalized experiences that resonate with customers.
Technology Integration: Insights were shared on how inQuba’s advanced technology can streamline customer interactions and drive operational efficiency.
Demystifying Knowledge Management through Storytelling
The Department of Veteran Affairs (VA) invited Taylor Paschal, Knowledge & Information Management Consultant at Enterprise Knowledge, to speak at a Knowledge Management Lunch and Learn hosted on June 12, 2024. All Office of Administration staff were invited to attend and received professional development credit for participating in the voluntary event.
The objectives of the Lunch and Learn presentation were to:
- Review what KM ‘is’ and ‘isn’t’
- Understand the value of KM and the benefits of engaging
- Define and reflect on your “what’s in it for me?”
- Share actionable ways you can participate in Knowledge - - Capture & Transfer
Your One-Stop Shop for Python Success: Top 10 US Python Development Providers
Simplify your search for a reliable Python development partner! This list presents the top 10 trusted US providers offering comprehensive Python development services, ensuring your project's success from conception to completion.
A Deep Dive into ScyllaDB's Architecture
This talk will cover ScyllaDB Architecture from the cluster-level view and zoom in on data distribution and internal node architecture. In the process, we will learn the secret sauce used to get ScyllaDB's high availability and superior performance. We will also touch on the upcoming changes to ScyllaDB architecture, moving to strongly consistent metadata and tablets.
Dandelion Hashtable: beyond billion requests per second on a commodity server
This slide deck presents DLHT, a concurrent in-memory hashtable. Despite efforts to optimize hashtables, that go as far as sacrificing core functionality, state-of-the-art designs still incur multiple memory accesses per request and block request processing in three cases. First, most hashtables block while waiting for data to be retrieved from memory. Second, open-addressing designs, which represent the current state-of-the-art, either cannot free index slots on deletes or must block all requests to do so. Third, index resizes block every request until all objects are copied to the new index. Defying folklore wisdom, DLHT forgoes open-addressing and adopts a fully-featured and memory-aware closed-addressing design based on bounded cache-line-chaining. This design offers lock-free index operations and deletes that free slots instantly, (2) completes most requests with a single memory access, (3) utilizes software prefetching to hide memory latencies, and (4) employs a novel non-blocking and parallel resizing. In a commodity server and a memory-resident workload, DLHT surpasses 1.6B requests per second and provides 3.5x (12x) the throughput of the state-of-the-art closed-addressing (open-addressing) resizable hashtable on Gets (Deletes).
What is an RPA CoE? Session 1 – CoE Vision
In the first session, we will review the organization's vision and how this has an impact on the COE Structure.
Topics covered:
• The role of a steering committee
• How do the organization’s priorities determine CoE Structure?
Speaker:
Chris Bolin, Senior Intelligent Automation Architect Anika Systems
5th LF Energy Power Grid Model Meet-up Slides
5th Power Grid Model Meet-up
It is with great pleasure that we extend to you an invitation to the 5th Power Grid Model Meet-up, scheduled for 6th June 2024. This event will adopt a hybrid format, allowing participants to join us either through an online Mircosoft Teams session or in person at TU/e located at Den Dolech 2, Eindhoven, Netherlands. The meet-up will be hosted by Eindhoven University of Technology (TU/e), a research university specializing in engineering science & technology.
Power Grid Model
The global energy transition is placing new and unprecedented demands on Distribution System Operators (DSOs). Alongside upgrades to grid capacity, processes such as digitization, capacity optimization, and congestion management are becoming vital for delivering reliable services.
Power Grid Model is an open source project from Linux Foundation Energy and provides a calculation engine that is increasingly essential for DSOs. It offers a standards-based foundation enabling real-time power systems analysis, simulations of electrical power grids, and sophisticated what-if analysis. In addition, it enables in-depth studies and analysis of the electrical power grid’s behavior and performance. This comprehensive model incorporates essential factors such as power generation capacity, electrical losses, voltage levels, power flows, and system stability.
Power Grid Model is currently being applied in a wide variety of use cases, including grid planning, expansion, reliability, and congestion studies. It can also help in analyzing the impact of renewable energy integration, assessing the effects of disturbances or faults, and developing strategies for grid control and optimization.
What to expect
For the upcoming meetup we are organizing, we have an exciting lineup of activities planned:
-Insightful presentations covering two practical applications of the Power Grid Model.
-An update on the latest advancements in Power Grid -Model technology during the first and second quarters of 2024.
-An interactive brainstorming session to discuss and propose new feature requests.
-An opportunity to connect with fellow Power Grid Model enthusiasts and users.
[OReilly Superstream] Occupy the Space: A grassroots guide to engineering (an...
The typical problem in product engineering is not bad strategy, so much as “no strategy”. This leads to confusion, lack of motivation, and incoherent action. The next time you look for a strategy and find an empty space, instead of waiting for it to be filled, I will show you how to fill it in yourself. If you’re wrong, it forces a correction. If you’re right, it helps create focus. I’ll share how I’ve approached this in the past, both what works and lessons for what didn’t work so well.
Recently uploaded (20)
Freshworks Rethinks NoSQL for Rapid Scaling & Cost-Efficiency
Freshworks Rethinks NoSQL for Rapid Scaling & Cost-Efficiency
How to Interpret Trends in the Kalyan Rajdhani Mix Chart.pdf
How to Interpret Trends in the Kalyan Rajdhani Mix Chart.pdf
Session 1 - Intro to Robotic Process Automation.pdf
Session 1 - Intro to Robotic Process Automation.pdf
Connector Corner: Seamlessly power UiPath Apps, GenAI with prebuilt connectors
Connector Corner: Seamlessly power UiPath Apps, GenAI with prebuilt connectors
Overcoming the PLG Trap: Lessons from Canva's Head of Sales & Head of EMEA Da...
Overcoming the PLG Trap: Lessons from Canva's Head of Sales & Head of EMEA Da...
Must Know Postgres Extension for DBA and Developer during Migration
Must Know Postgres Extension for DBA and Developer during Migration
Northern Engraving | Modern Metal Trim, Nameplates and Appliance Panels
Northern Engraving | Modern Metal Trim, Nameplates and Appliance Panels
inQuba Webinar Mastering Customer Journey Management with Dr Graham Hill
inQuba Webinar Mastering Customer Journey Management with Dr Graham Hill
Demystifying Knowledge Management through Storytelling
Demystifying Knowledge Management through Storytelling
Your One-Stop Shop for Python Success: Top 10 US Python Development Providers
Your One-Stop Shop for Python Success: Top 10 US Python Development Providers
Dandelion Hashtable: beyond billion requests per second on a commodity server
Dandelion Hashtable: beyond billion requests per second on a commodity server
[OReilly Superstream] Occupy the Space: A grassroots guide to engineering (an...
[OReilly Superstream] Occupy the Space: A grassroots guide to engineering (an...
Monumental mapping: GIS and Hadrian’s Wall
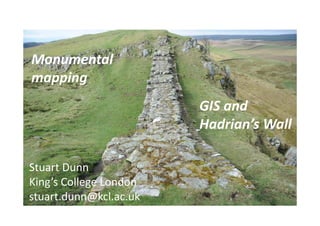
- 1. Monumental mapping GIS and Hadrian’s Wall Stuart Dunn King’s College London stuart.dunn@kcl.ac.uk
- 2. • Vector – points, lines and polygons • Ratser – pixels with attributes • GIS allows us to query and overlay data with geographic coordinates • “A map on top of a database”
- 3. • Everything happens somewhere • Historical sources refer to place in many different ways • Associating exact location with these is complex • Georeferencing • Accuracy versus precision • Relative versus absolute
- 4. e.g. roads, rivers e.g. places e.g. countries, territories etc Vector GIS
- 7. • ArcView x.x – ESRI; proprietary • GRASS – www.grass.osgeo.org • Quantum GIS - http://hub.qgis.org/projects/quantum- gis/wiki/Download • Google Earth – www.earth.google.com • Open Street Map - http://www.openstreetmap.org
- 8. Volunteered Geographical Information (VGI) is considered a special case of an intermediary discourse: information is not fixed, it can be extended, altered, or even deleted at any time. This multi-stage, reflective character has to taken into consideration in a discourse- analytical approach. C. Fink, 2011 - Mapping Together : On collaborative implicit cartographies, their discourses and space construction.
- 13. AD 1250 – Matthew Paris (Image source - British Library)
- 14. Antonine Wall, c. 1906
- 16. E.g. search for Chollerford GeoNames
- 19. Introduction: What is GIS? Vector & unique identifiers, APIs and openstreetmap
- 21. Introduction: What is GIS? Vector & unique identifiers, APIs and openstreetmap
- 22. Introduction: What is GIS? Vector & unique identifiers, APIs and openstreetmap
- 23. Introduction: What is GIS? Vector & unique identifiers, APIs and openstreetmap
- 24. Introduction: What is GIS? Vector & unique identifiers, APIs and openstreetmap