Download to read offline


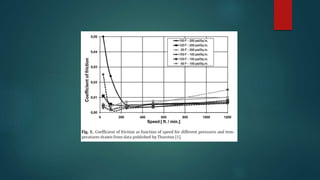


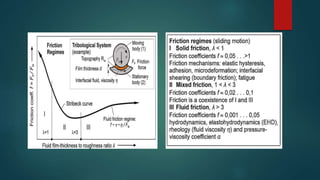


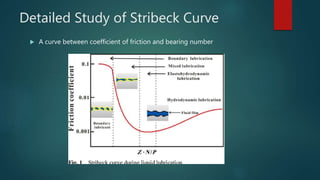
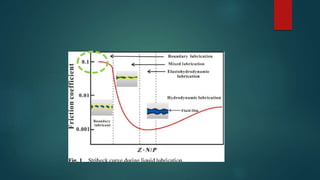
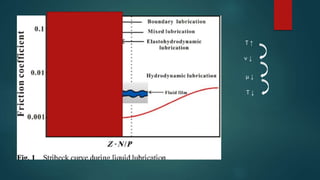
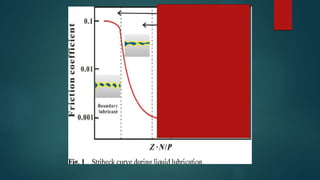

The document discusses the history and development of the Stribeck curve. It describes the contributions of early researchers like Hirn, Thurston, Beauchamp Tower, and Stribeck himself who divided the curve into different lubrication regimes. Later, Gümbel and Hersey plotted the curve against a dimensionless number and reached the same results independently. The Stribeck curve shows the relationship between coefficient of friction and a bearing number and how friction decreases with increasing speed or decreasing temperature, traversing the lubrication regimes.


