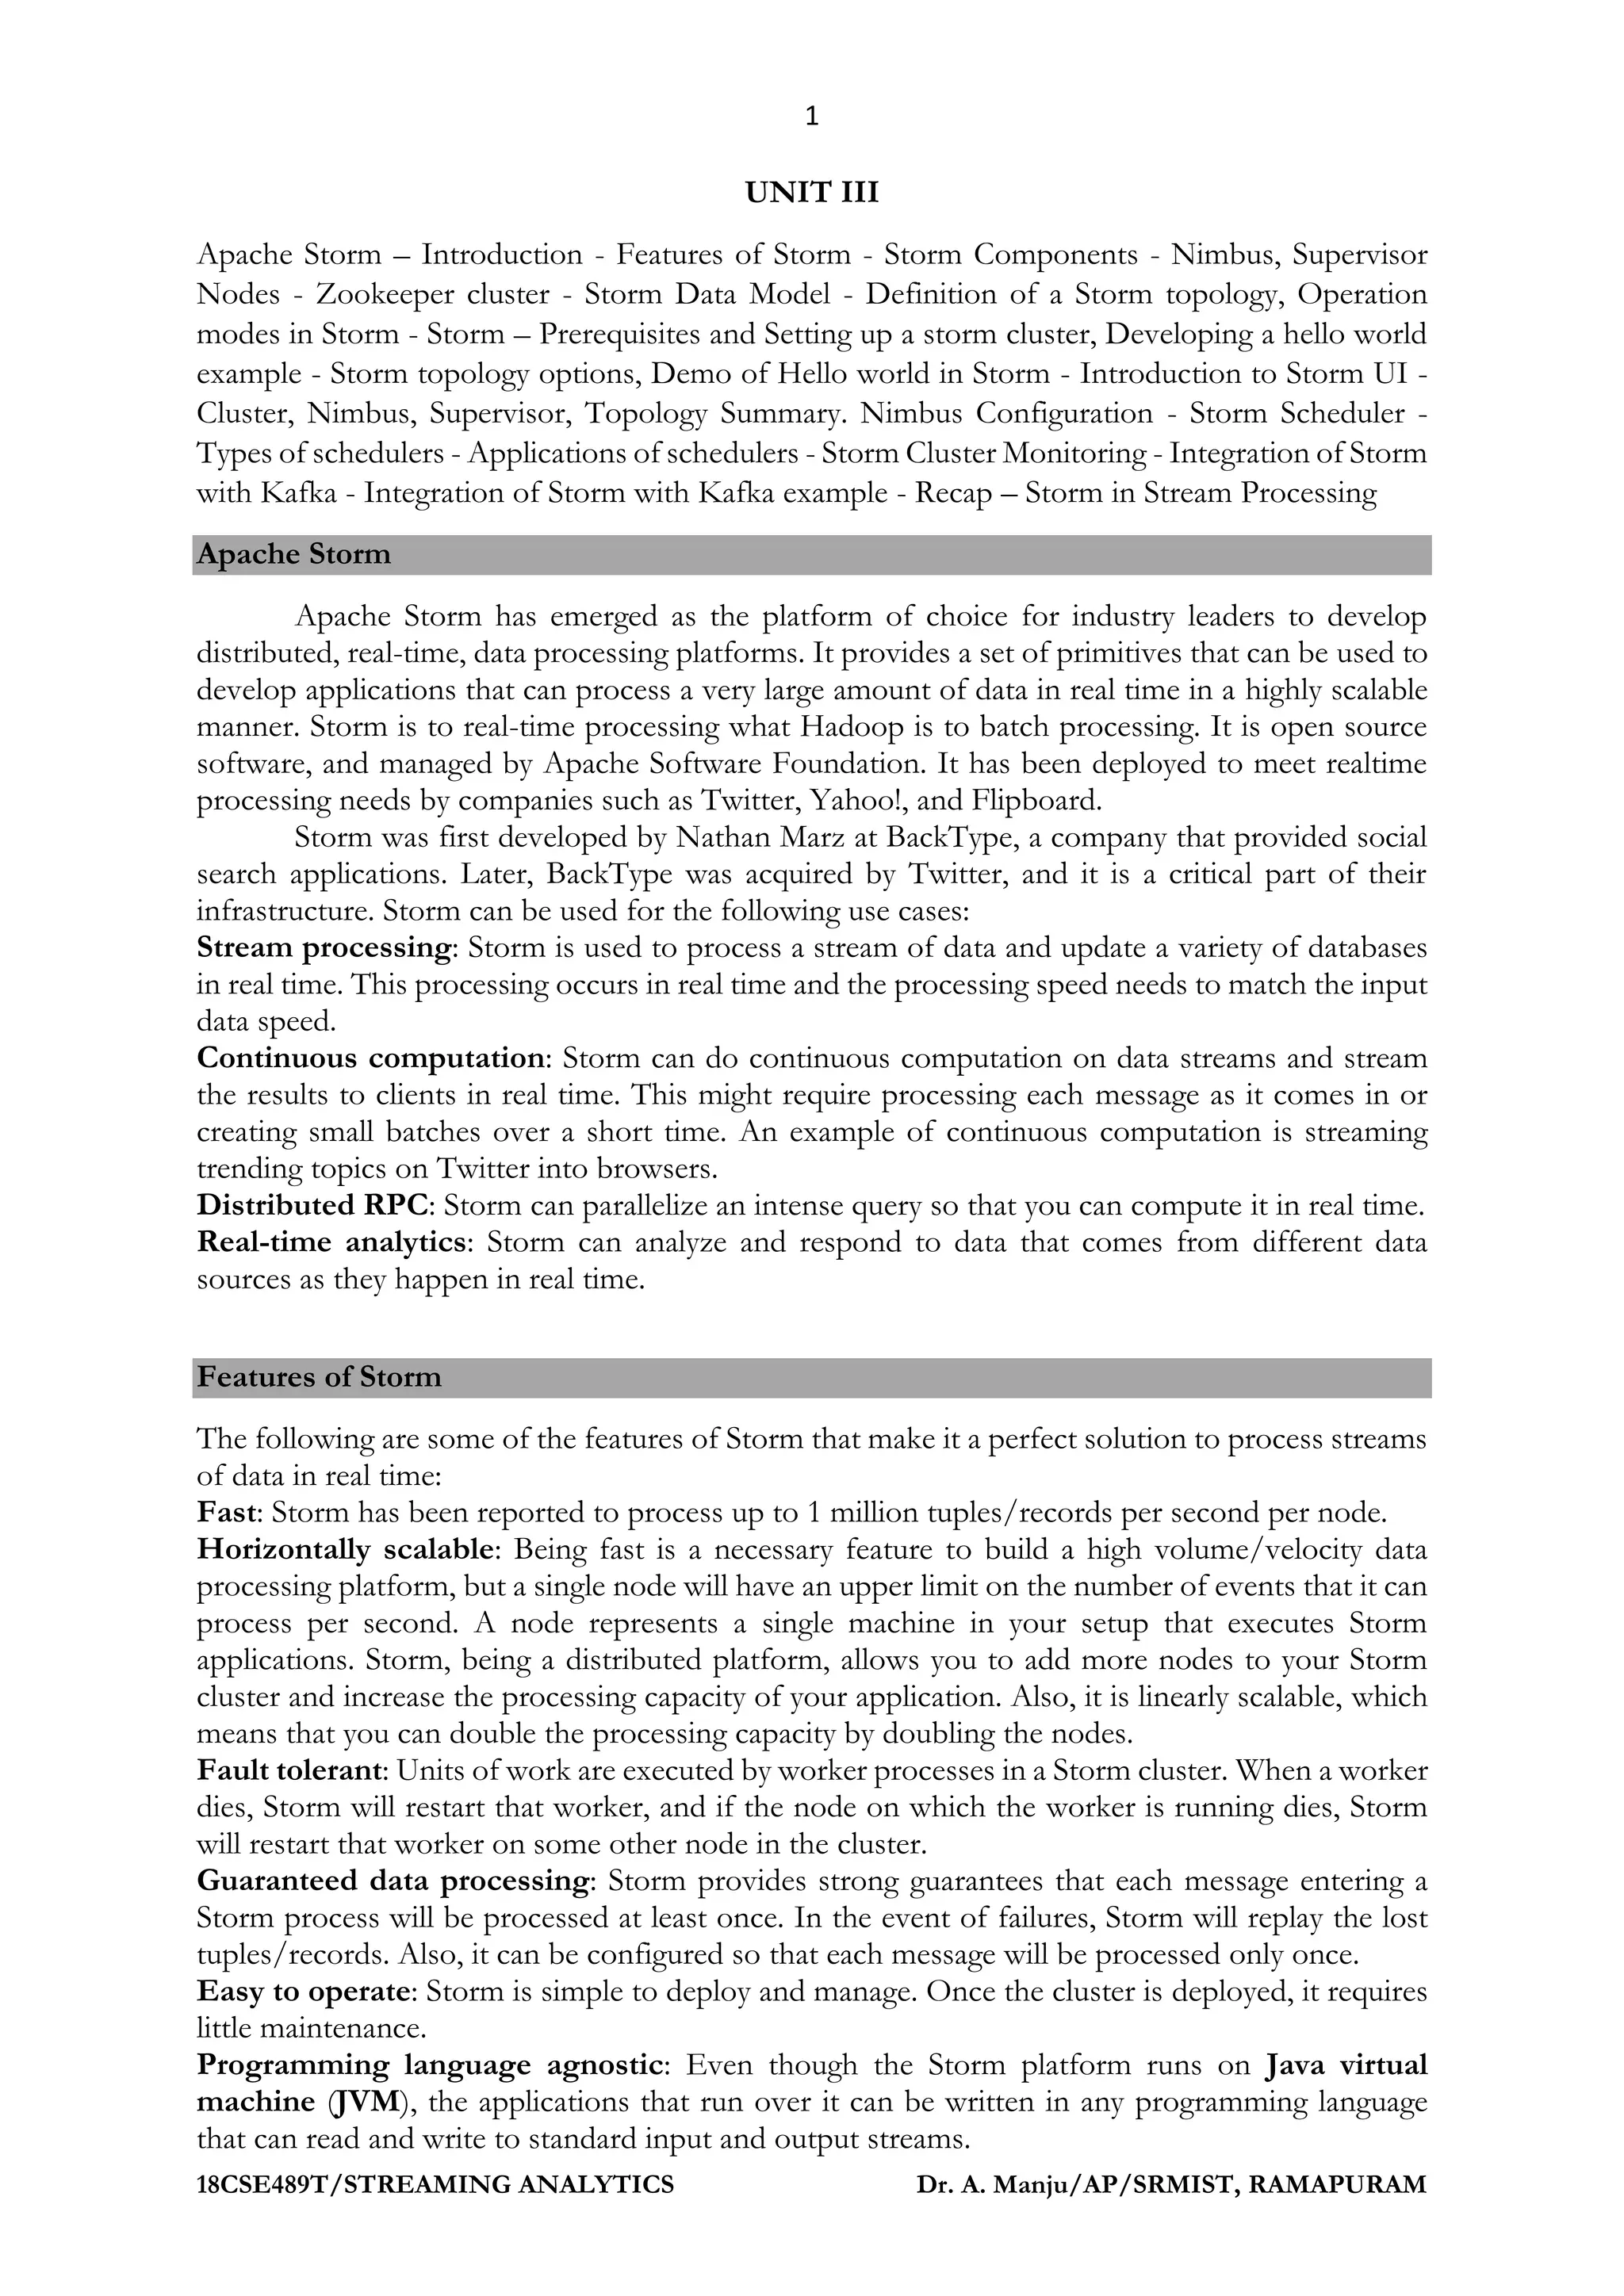
The document provides a comprehensive overview of Apache Storm, a distributed real-time data processing platform, highlighting its architecture, features, and components, including Nimbus and supervisor nodes. It explains the storm data model, topology definitions, operation modes, and the setup prerequisites, positioning Storm as a scalable and fault-tolerant solution for stream processing akin to Hadoop for batch processing. The document elaborates on the integration with Kafka, along with practical use cases such as continuous computation and real-time analytics.

![11
18CSE489T/STREAMING ANALYTICS Dr. A. Manju/AP/SRMIST, RAMAPURAM
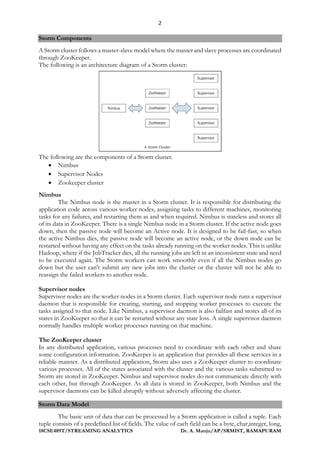
// print the value of field "site" on console.
System.out.println("######### Name of input site is : " + test);
}
public void declareOutputFields(OutputFieldsDeclarer declarer) {
}
}
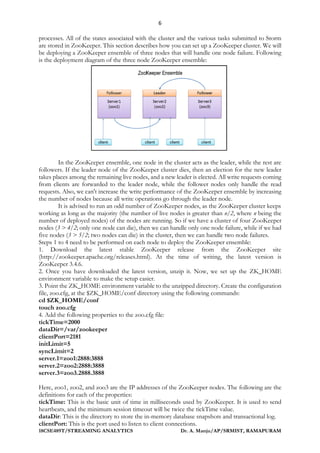
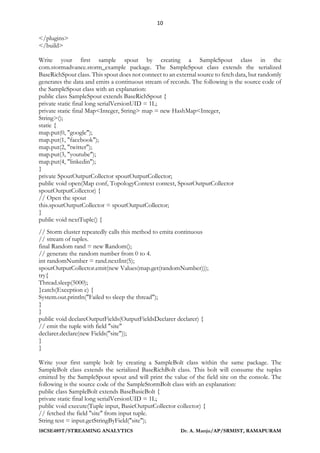
Create a main SampleStormTopology class within the same package. This class creates an instance
of the spout and bolt along with the classes, and chaines them together using a TopologyBuilder
class. This class uses org.apache.storm.LocalCluster to simulate the Storm cluster. The
LocalCluster mode is used for debugging/testing the topology on a developer machine before
deploying it on the Storm cluster. The following is the implementation of the main class:
public class SampleStormTopology {
public static void main(String[] args) throws AlreadyAliveException,
InvalidTopologyException {
// create an instance of TopologyBuilder class
TopologyBuilder builder = new TopologyBuilder();
// set the spout class
builder.setSpout("SampleSpout", new SampleSpout(), 2);
// set the bolt class
builder.setBolt("SampleBolt", new SampleBolt(), 4).shuffleGrouping("SampleSpout");
Config conf = new Config();
conf.setDebug(true);
// create an instance of LocalCluster class for
// executing topology in local mode.
LocalCluster cluster = new LocalCluster();
// SampleStormTopology is the name of submitted topology
cluster.submitTopology("SampleStormTopology", conf, builder.createTopology());
try {
Thread.sleep(100000);
} catch (Exception exception) {
System.out.println("Thread interrupted exception : " + exception);
}
// kill the SampleStormTopology
cluster.killTopology("SampleStormTopology");
// shutdown the storm test cluster
cluster.shutdown();
}
}
Go to your project's home directory and run the following commands to execute the topology in
local mode:
$> cd $STORM_EXAMPLE_HOME
$> mvn compile exec:java -Dexec.classpathScope=compile -
Dexec.mainClass=com.stormadvance.storm_example.SampleStormTopology
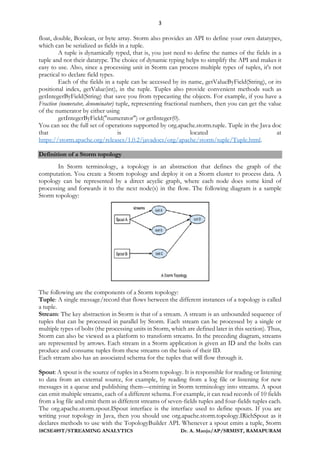
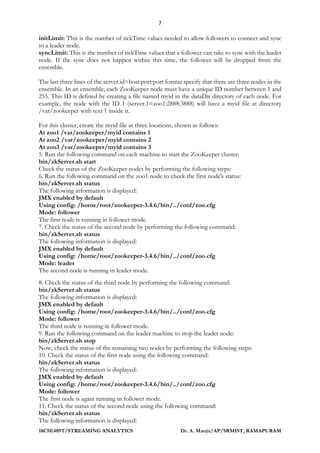
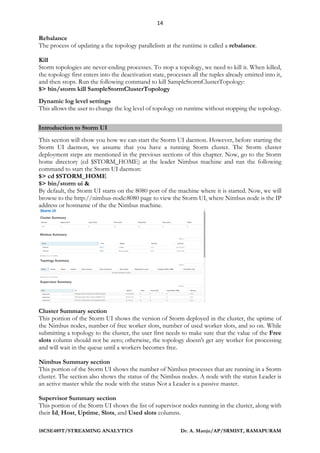
Now create a new topology class for deploying the topology on an actual Storm cluster. Create a
main SampleStormClusterTopology class within the same package. This class also creates an
instance of the spout and bolt along with the classes, and chains them together using a
TopologyBuilder class:
public class SampleStormClusterTopology {
public static void main(String[] args) throws AlreadyAliveException, InvalidTopologyException {
// create an instance of TopologyBuilder class
TopologyBuilder builder = new TopologyBuilder();
// set the spout class](https://image.slidesharecdn.com/saunitiii-241231054917-04aee176/85/Streaming-Analytics-Unit-3-notes-for-engineers-11-320.jpg)
![12
18CSE489T/STREAMING ANALYTICS Dr. A. Manju/AP/SRMIST, RAMAPURAM
builder.setSpout("SampleSpout", new SampleSpout(), 2);
// set the bolt class
builder.setBolt("SampleBolt", new SampleBolt(), 4).shuffleGrouping("SampleSpout");
Config conf = new Config();
conf.setNumWorkers(3);
// This statement submit the topology on remote
// args[0] = name of topology
try {
StormSubmitter.submitTopology(args[0], conf, builder.createTopology());
} catch (AlreadyAliveException alreadyAliveException) {
System.out.println(alreadyAliveException);
} catch (InvalidTopologyException invalidTopologyException) {
System.out.println(invalidTopologyException);
} catch (AuthorizationException e) {
// TODO Auto-generated catch block
e.printStackTrace();
}
}
}
Build your Maven project by running the following command on the projects home directory:
mvn clean install
The output of the preceding command is as follows:
------------------------------------------------------------------ ----
-
[INFO] ----------------------------------------------------------- ----
-
[INFO] BUILD SUCCESS
[INFO] ----------------------------------------------------------- ----
-
[INFO] Total time: 58.326s
[INFO] Finished at:
[INFO] Final Memory: 14M/116M
[INFO] ----------------------------------------------------------- ----
We can deploy the topology to the cluster using the following Storm client command:
bin/storm jar jarName.jar [TopologyMainClass] [Args]
The preceding command runs TopologyMainClass with the arguments arg1 and arg2.
The main function of TopologyMainClass is to define the topology and submit it to the Nimbus
machine. The storm jar part takes care of connecting to the Nimbus machine and uploading the
JAR part.
Log in on a Storm Nimbus machine and execute the following commands:
$> cd $STORM_HOME
$> bin/storm jar ~/storm_example-0.0.1-SNAPSHOT-jar-with-dependencies.jar
com.stormadvance.storm_example.SampleStormClusterTopology storm_example
In the preceding code ~/storm_example-0.0.1-SNAPSHOT-jar-withdependencies.
jar is the path of the SampleStormClusterTopology JAR that we are deploying on the Storm cluster.
The following information is displayed:
702 [main] INFO o.a.s.StormSubmitter - Generated ZooKeeper secret payload
for MD5-digest: -8367952358273199959:-5050558042400210383
793 [main] INFO o.a.s.s.a.AuthUtils - Got AutoCreds []
856 [main] INFO o.a.s.StormSubmitter - Uploading topology jar
/home/USER/storm_example-0.0.1-SNAPSHOT-jar-with-dependencies.jar to
assigned location: /tmp/storm-data/nimbus/inbox/stormjar-d3007821-
f87d-48af-8364-cff7abf8652d.jar](https://image.slidesharecdn.com/saunitiii-241231054917-04aee176/85/Streaming-Analytics-Unit-3-notes-for-engineers-12-320.jpg)
![13
18CSE489T/STREAMING ANALYTICS Dr. A. Manju/AP/SRMIST, RAMAPURAM
867 [main] INFO o.a.s.StormSubmitter - Successfully uploaded topology jar
to assigned location: /tmp/storm-data/nimbus/inbox/stormjar-d3007821-
f87d-48af-8364-cff7abf8652d.jar
868 [main] INFO o.a.s.StormSubmitter - Submitting topology storm_example
in distributed mode with conf
{"storm.zookeeper.topology.auth.scheme":"digest","storm.zookeeper.topology.
auth.payload":"-8367952358273199959:-5050558042400210383","topology.workers
":3}
1007 [main] INFO o.a.s.StormSubmitter - Finished submitting topology:
storm_example
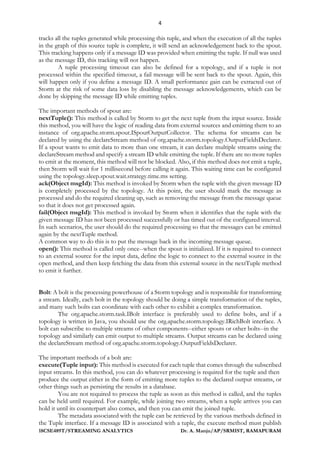
Run the jps command to see the number of running JVM processes as follows:
Jps
The preceding command's output is:
26827 worker
26530 supervisor
26824 worker
26468 nimbus
26822 worker
In the preceding code, a worker is the JVM launched for the SampleStormClusterTopology
topology.
Storm Topology Options
The following operations that a user can perform on the Storm cluster:
• Deactivate
• Activate
• Rebalance
• Kill
• Dynamic log level settings
Deactivate
Storm supports the deactivating a topology. In the deactivated state, spouts will not emit any new
tuples into the pipeline, but the processing of the already emitted tuples will continue. The
following is the command to deactivate the running topology:
$> bin/storm deactivate topologyName
Deactivate SampleStormClusterTopology using the following command:
bin/storm deactivate SampleStormClusterTopology
The following information is displayed:
0 [main] INFO backtype.storm.thrift - Connecting to Nimbus at
localhost:6627
76 [main] INFO backtype.storm.command.deactivate - Deactivated topology:
SampleStormClusterTopology
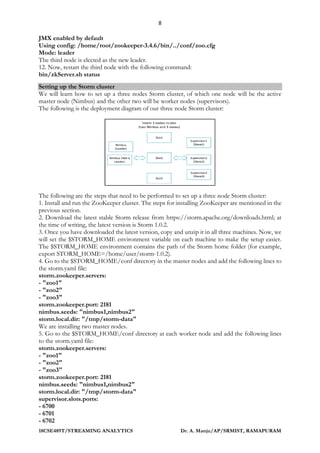
Activate
Storm also the supports activating a topology. When a topology is activated, spouts will again start
emitting tuples. The following is the command to activate the topology:
$> bin/storm activate topologyName
Activate SampleStormClusterTopology using the following command:
bin/storm activate SampleStormClusterTopology
The following information is displayed:
0 [main] INFO backtype.storm.thrift - Connecting to Nimbus at
localhost:6627
65 [main] INFO backtype.storm.command.activate - Activated topology:
SampleStormClusterTopology](https://image.slidesharecdn.com/saunitiii-241231054917-04aee176/85/Streaming-Analytics-Unit-3-notes-for-engineers-13-320.jpg)
![21
18CSE489T/STREAMING ANALYTICS Dr. A. Manju/AP/SRMIST, RAMAPURAM
{
"servers" : [ {
"port" : "12346",
"host" : "IP_OF_SUPERVISOR_MACHINE",
"queries" : [ {
"outputWriters": [{
"@class":
"com.googlecode.jmxtrans.model.output.GangliaWriter",
"settings": {
"groupName": "supervisor",
"host": "IP_OF_GANGLIA_GMOND_SERVER",
"port": "8649" }
}],
"obj": "java.lang:type=Memory",
"resultAlias": "supervisor",
"attr": ["ObjectPendingFinalizationCount"]
},
{
"outputWriters": [{
"@class":
"com.googlecode.jmxtrans.model.output.GangliaWriter", "settings" {
"groupName": " supervisor ",
"host": "IP_OF_GANGLIA_GMOND_SERVER",
"port": "8649"
}
}],
"obj": "java.lang:name=Copy,type=GarbageCollector",
"resultAlias": " supervisor ",
"attr": [
"CollectionCount",
"CollectionTime"
]
},
{
"outputWriters": [{
"@class":
"com.googlecode.jmxtrans.model.output.GangliaWriter",
"settings": {
"groupName": "supervisor ",
"host": "IP_OF_GANGLIA_GMOND_SERVER",
"port": "8649"
}
}],
"obj": "java.lang:name=Code Cache,type=MemoryPool",
"resultAlias": "supervisor ",
"attr": [
"CollectionUsageThreshold",
"CollectionUsageThresholdCount",
"UsageThreshold",
"UsageThresholdCount"
]
},
{
"outputWriters": [{](https://image.slidesharecdn.com/saunitiii-241231054917-04aee176/85/Streaming-Analytics-Unit-3-notes-for-engineers-21-320.jpg)
![22
18CSE489T/STREAMING ANALYTICS Dr. A. Manju/AP/SRMIST, RAMAPURAM
"@class":
"com.googlecode.jmxtrans.model.output.GangliaWriter",
"settings": {
"groupName": "supervisor ",
"host": "IP_OF_GANGLIA_GMOND_SERVER",
"port": "8649"
}
}],
"obj": "java.lang:type=Runtime",
"resultAlias": "supervisor",
"attr": [
"StartTime",
"Uptime"
]
}
],
"numQueryThreads" : 2
}]
}
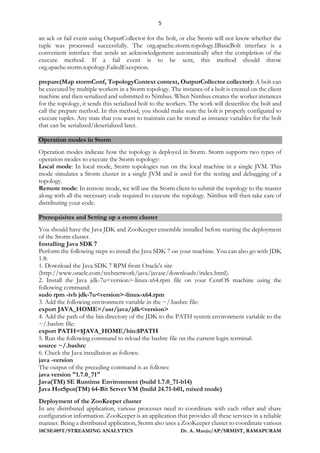
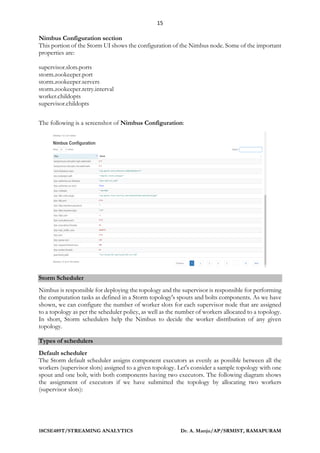
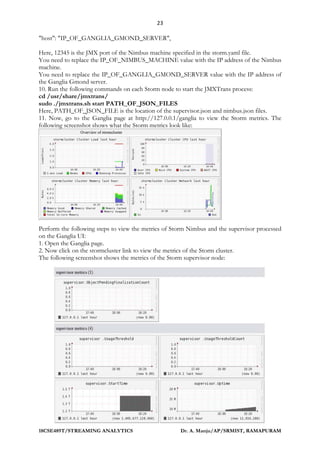
Here, 12346 is the JMX port of the supervisor specified in the storm.yaml file. You need to replace
the IP_OF_SUPERVISOR_MACHINE value with the IP address of the supervisor machine. If
you have two supervisors in a cluster, then the supervisor.json file of node 1 contains the IP
address of node 1, and the supervisor.json file of node 2 contains the IP address of node 2.
You need to replace the IP_OF_GANGLIA_GMOND_SERVER value with the IP address of
the Ganglia Gmond server.
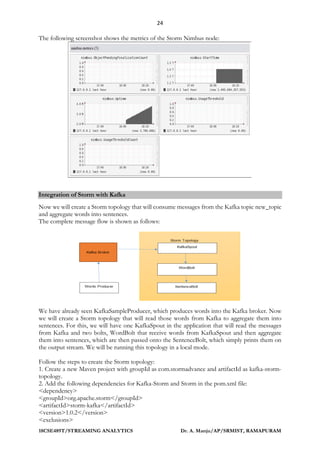
9. Create the nimbus.json file on the Nimbus node. Using JMXTrans, collect the Storm Nimbus's
process JVM metrics and publish them on Ganglia using the
com.googlecode.jmxtrans.model.output.GangliaWriter
OutputWriters class. The following are the contents of the nimbus.json file:
{
"servers" : [{
"port" : "12345",
"host" : "IP_OF_NIMBUS_MACHINE",
"queries" : [
{ "outputWriters": [{
"@class":
"com.googlecode.jmxtrans.model.output.GangliaWriter",
"settings": {
"groupName": "nimbus",
"host": "IP_OF_GANGLIA_GMOND_SERVER",
"port": "8649"
}
}],
"obj": "java.lang:type=Memory",
"resultAlias": "nimbus",
"attr": ["ObjectPendingFinalizationCount"]
},
{
"outputWriters": [{
"@class":
"com.googlecode.jmxtrans.model.output.GangliaWriter",
"settings": {
"groupName": "nimbus",](https://image.slidesharecdn.com/saunitiii-241231054917-04aee176/85/Streaming-Analytics-Unit-3-notes-for-engineers-22-320.jpg)
![27
18CSE489T/STREAMING ANALYTICS Dr. A. Manju/AP/SRMIST, RAMAPURAM
System.out.println("Received Word:" + word);
// add word to current list of words
words.add(word);
if (word.endsWith(".")) {
// word ends with '.' which means this is // the end of the
sentence
// publish a sentence tuple
collector.emit(ImmutableList.of((Object)
StringUtils.join(words, ' ')));
// reset the words list.
words.clear();
}
}
public void declareOutputFields(OutputFieldsDeclarer declarer) {
// here we declare we will be emitting tuples with
// a single field called "sentence"
declarer.declare(new Fields("sentence"));
}
}
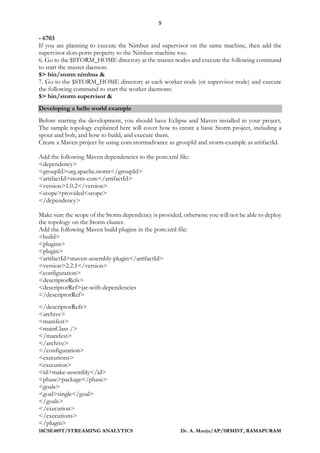
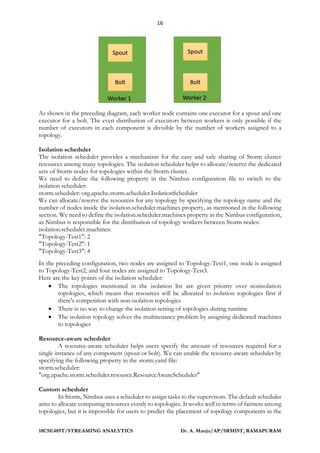
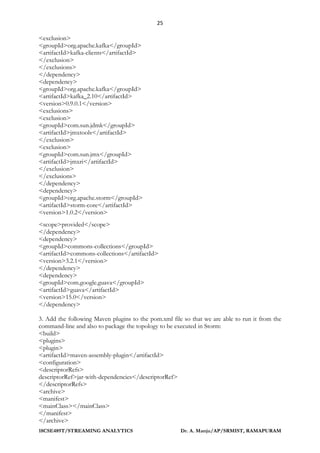
5. Next is SentenceBolt, which just prints the sentences that it receives. Create SentenceBolt in the
com.stormadvance.kafka package. The code is as follows, with explanations:
public class SentenceBolt extends BaseBasicBolt {
private static final long serialVersionUID =
7104400131657100876L;
public void execute(Tuple input, BasicOutputCollector collector)
{
// get the sentence from the tuple and print it
System.out.println("Recieved Sentence:");
String sentence = input.getString(0);
System.out.println("Recieved Sentence:" + sentence);
}
public void declareOutputFields(OutputFieldsDeclarer declarer) {
// we don't emit anything
}
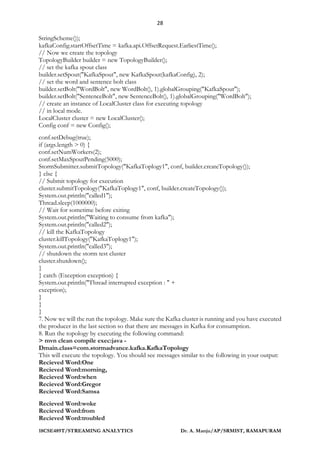
6. Now we will create the KafkaTopology that will define the KafkaSpout and wire it with
WordBolt and SentenceBolt. Create a new class called KafkaTopology in the
com.stormadvance.kafka package. The code is as follows, with explanations:
public class KafkaTopology {
public static void main(String[] args) {
try {
// ZooKeeper hosts for the Kafka cluster
BrokerHosts zkHosts = new ZkHosts("ZKIP:PORT");
// Create the KafkaSpout configuartion
// Second argument is the topic name
// Third argument is the zookeepr root for Kafka
// Fourth argument is consumer group id
SpoutConfig kafkaConfig = new SpoutConfig(zkHosts, "new_topic", "", "id1");
// Specify that the kafka messages are String
// We want to consume all the first messages in the topic everytime
// we run the topology to help in debugging. In production, this
// property should be false
kafkaConfig.scheme = new SchemeAsMultiScheme(new](https://image.slidesharecdn.com/saunitiii-241231054917-04aee176/85/Streaming-Analytics-Unit-3-notes-for-engineers-27-320.jpg)
![29
18CSE489T/STREAMING ANALYTICS Dr. A. Manju/AP/SRMIST, RAMAPURAM
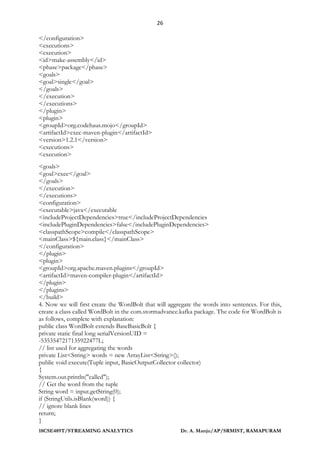
Recieved Word:dreams,
Recieved Word:he
Recieved Word:found
Recieved Word:himself
Recieved Word:transformed
Recieved Word:in
Recieved Word:his
Recieved Word:bed
Recieved Word:into
Recieved Word:a
Recieved Word:horrible
Recieved Word:vermin.
Recieved Sentence:One morning, when Gregor Samsa woke from troubled dreams, he
found himself transformed in his bed into a horrible vermin.
So we are able to consume messages from Kafka and process them in a Storm topology.
Integration of Storm with Kafka example
Deploy the Kafka topology on Storm cluster
The deployment of Kafka and Storm integration topology on the Storm cluster is similar to the
deployment of other topologies. We need to set the number of workers and the maximum spout
pending Storm config and we need to use the submitTopology method of StormSubmitter to
submit the topology on the Storm cluster.
Now, we need to build the topology code as mentioned in the following steps to create a JAR of
the Kafka Storm integration topology:
1. Go to project home.
2. Execute the command:
mvn clean install
The output of the preceding command is as follows:
------------------------------------------------------------------
-----
[INFO] -----------------------------------------------------------
-----
[INFO] BUILD SUCCESS
[INFO] -----------------------------------------------------------
[INFO] Total time: 58.326s
[INFO] Finished at:
[INFO] Final Memory: 14M/116M
[INFO] -----------------------------------------------------------
-----
3. Now, copy the Kafka Storm topology on the Nimbus machine and execute the following
command to submit the topology on the Storm cluster:
bin/storm jar jarName.jar [TopologyMainClass] [Args]
The preceding command runs TopologyMainClass with the argument. The main function of
TopologyMainClass is to define the topology and submit it to Nimbus. The Storm JAR part takes
care of connecting to Nimbus and uploading the JAR part.
4. Log in on the Storm Nimbus machine and execute the following commands:
$> cd $STORM_HOME
$> bin/storm jar ~/storm-kafka-topology-0.0.1-SNAPSHOT-jar-withdependencies.
jar com.stormadvance.kafka.KafkaTopology
KafkaTopology1
Here, ~/ storm-kafka-topology-0.0.1-SNAPSHOT-jar-with dependencies. jar is the path of the
KafkaTopology JAR we are deploying on the Storm cluster.](https://image.slidesharecdn.com/saunitiii-241231054917-04aee176/85/Streaming-Analytics-Unit-3-notes-for-engineers-29-320.jpg)